Purification of Lycium barbarum Polysaccharides by Foam Separation and Kinetic Analysis of the Process
2015-12-29CHENLiangZHANGWeiCHENYuantaoLIXuanlingLIUHaibinGAOZhongchao
CHEN Liang, ZHANG Wei*, CHEN Yuantao, LI Xuanling, LIU Haibin, GAO Zhongchao
(Department of Chemistry, Qinghai Normal University, Xining 810008, China)
Purification of Lycium barbarum Polysaccharides by Foam Separation and Kinetic Analysis of the Process
CHEN Liang, ZHANG Wei*, CHEN Yuantao, LI Xuanling, LIU Haibin, GAO Zhongchao
(Department of Chemistry, Qinghai Normal University, Xining 810008, China)
Foam separation was used for purifying polysaccharides from Lycium barbarum L. (LBPs) in this paper. LBPs were detected by phenol-sulphuric acid method and evaluated by enrichment ratio (E) and recovery (R). The effects of dilution fold, initial pH and gas velocity on separation efficiency were assessed based on a fitting model proposed by response surface methodology with Box-Behnken design. The optimal levels of the three factors were established and validated. A further study was performed to kinetically investigate the purification process. As a result, when dilution fold was 7.6, initial pH 3.42, and gas velocity 295 mL/min, maximum predicted values of E and R (2.57 and 57.31%, respectively) were obtained, indicating a relative error of 6.6% and 6.5% compared with the experimental values (2.41 and 61.28%), respectively. Kinetic experiments showed that the process could be described as a first-order reaction with an equivalent rate constant of 0.006 02 min-1. This study has provided a novel method for purification of LBPs, and the kinetic process may provide valuable guidance for enhancing the purification efficiency.
Lycium barbarum polysaccharides; foam separation; phenol-sulphuric acid method; response surface methodology; kinetic analysis
Lycium barbarum L. belongs to Solanaceae and is mainly distributed in arid and semi-arid regions of Northwestern China, Southeastern Europe and the Mediterranean areas[1]. As one kind of traditional Chinese medicines, it has been recognized by the Ministry of Public Health as an important edible and medicinal p lant resource. Studies on animals by modern pharmacology have shown that one of its functional components, Lycium barbarum polysaccharides (LBPs), possess all kinds of biological activities and benefit for human health, such as decreasing serum lipids, promoting immunity[2-3], enhancing antioxidant activity[4-8], lowering the content of sugar in blood[9-11]andimproving sexual activity of rats[12]. In order to realize all its promising applications, there is a strong need to supply the market with high-quality LBPs.
LBPs is almost acidic hetero-polysaccharides, with an average molecular weights distributed between 1 × 10⁴and 8.8 × 10⁴, composed of arabinose, rhamnose, xylose, mannose, galactose and glucose combined with peptide ch ain or protein in the form of covalent bond. Recently, a number of researches on the new method for LBPs extraction[13-18], purification[19-20], qualitative and quantitative detection[21-22], distribution of molecular weight and biological activity have been conducted. The traditional methods uses alcohol as precipitant to purify polysaccharides after degreasing and removing protein, which is a complex process with heavier usage of organic reagents but lower yield of polysaccharides.
Foam separation[23-24]has been used as a separation technique for decades, which takes the advantage of the different properties of these materials when adsorbed on the surface of the bubble to enrich target substances. In recent years, it has been widely used in separating substances with surface activity in low concentration, especially those with biological activity, which provides a simple, efficient and environment-friendly way for the purification of natural products. The structure of combined protein offers LBPs molecules surface activity to a certain degree. Therefore, it is possible that LB Ps can be purified by foam separation theoretically.
In our study, we intended to develop a novel and practical method for purification of LBPs, meanwhile, the kinetic analysis was used to guide for enhancing the efficiency technologically.
1 Materials and Methods
1.1 Materials and Chemicals
Nuomuhong wolfberry was from Qaidam Basin, China;D-glucose was obtained from Shanghai Yuan ye Biology Technology Co. Ltd., China; Ethanol, phenol and sulfuric acid were obtained from Tianjin Yonghua Chemical Reagent Co. Ltd., China; Hydrochloric acid, sodium hydroxide were purchased from Tianjin Tianli Chemical Reagent Co. Ltd., China. All reagents used were above analytical grade.
1.2 Instruments and Equipment
101A-1 E electro-thermal blowing drier, analytical balance were obtained from Beijing Dolly Scientific Instrument Co. Ltd., China; Colloid mill was obtained from Wenzhou Qixing Dairy Equipment Factory, China;IKA RH B-KT/C temperature control device, LD4-2 low speed centrifuge were obtained from Beijing Medical Machinery Factory, China; SHZ-D(Ⅲ) circulating water vacuum pump was obtained from Gongyi Yuhua Instrument Co. Ltd., China; IKA RV 10 rotary evaporators, PB-10 acidimeter, air compressor were purchased from Shanghai Jiebao Compressor Manufacturing Co. Ltd., China; Pressure valve, LZB-3 rotameter were obtained from Senlod Measurement and Control Co. Ltd., China; TU-1901 UV-vis spectrophotometer was obtained from Beijing General Instrument Senlod Measurement and Control Co. Ltd., China. Apparatus of foam separation were designed (Fig.1).

Fig.1 Schematic illustration of foam separation apparatus
1.3 Methods
1.3.1 Experiment
10.0 g sample was dried to constant weight under 60 ℃, soaked with 250 mL of deionized water for 24 h and then smashed into homogenate. Extract with 80 ℃ water for 2 h, centrifuged at 4 000 r/min for 10 min and filtered instantly. The residues for secondary extraction was collected and the solutions were pooled, concentrated to 50 mL. 200 mL of ethano l was added and refrigerated overnight. The solution were filtered to obtain the residue, which was dired and weigh. 500 mL of de-ionized water was added to dissolve it and the concentration of LBPs was detected by phenolsulfuric acid me thod and their content was calculated.
Control other factors constant, inspect the effect of diluted times, initial pH of the extract and gas velocity on separation efficiency, respectively. The extract was diluted to 300 mL at certain times and pH value was adjusted before bubbling at appropriate gas velocity. After separation, the foam was collected and the volume of the remaining liquid w as measured. The content of LBPs in foam layer and the liquid were determined. The enrichment ratio (E) andrecovery (R) were calculated. The foam separation conditions were optimized by using Box-Behnken design in response surface methodology (RSM). Finally, the dynamic process under the optimized technologic conditions were discussed. 1.3.2 Formulas
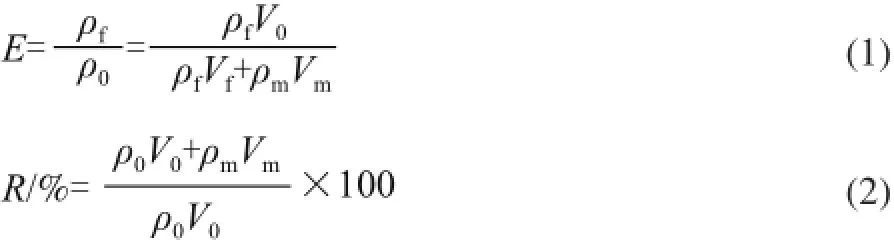
where ρfrefers to mass concentration of LBPs in the foam/(mg/mL); ρ0refers to the mass concentration of LBPs in the initial extract/(mg/mL); ρmrefers to mass concentration of LBPs in the liquid/(mg/mL); V0refers to 300 mL; Vfrefers to volume of the foam layer/mL; Vmrefers to volume of the liquid/mL.
Content of LBPs:
Where w refers to content of LBPs/%; m refers to weight of the sample/g; V refers to volume of the extract/mL; F refers to dilution times; 3.19 refers to conversion factor of glucose to polysaccharides.
1.3.3 RSM design
According to single experiment, the optimal levels were chosen as central point respectively, we desig ned an analysis process about 3-factors and 3-levels by Box-Behnken design. The total design consisted of 12 factorial points in threedimensional vertexes and 3 repeated zero point in the center to estimate random error of the test group.
2 Results and Discussion
2.1 Single experiment results
Yield of residue after precipitation by ethanol was 0.864 4 g and initial mass concentration of LBPs in the extract was 0.514 mg/mL, which means that the total content of LBPs in the sample is 2.56%.
2.1.1 Effect of dilution times on separation

Fig.2 Effect of dilution times on E and R
According to different times, the initial extract was diluted to 300 mL, then gas velocity was con trolled at 200 mL/min for bubbling. Half an hour later, the foam was collected. The concentrations of LBPs in foam layer and the liquid were measured separately. E and R were calculated, the trend was shown in Fig.2.
With the increasing of dilution times, the concentration of LBPs in the initial extract was decrea sed, when less than 3 times, concentration of the solution was too high, foam with lower dense was formed and raised slowly in the body of the liquid phase, and the foam layer was stable and not easy to coalescence and break, with higher content of water. Lower mass concentration an d higher volume of the foam layer directly led to lower E and higher R; with increasing dilution times, when micelle concentration (cmc) was closed to the critical point, surface tension became lowest. E and R were changed even to the highest; when dilution fold was too high, the LBPs concentration in solution was too low to collect enough foam for determination. The optimal dilution fold was 6.
2.1.2 Effect of initial pH on separation
50 mL of extract was diluted to 300 mL (6-fold dilution) with ionized water, bubbling before adjusting pH, and thel gas velocity was controlled at 200 mL/min. Half an hour later, the foam was collected and the concentration of LBPs in foam layer and the liquid were measured separately, E and R were calculated, the trend was shown in Fi g.3.

Fig.3 Effect of ini tial pH on E and R
LBPs were consisted of a combination of proteins and/ or polypeptide chain with hetero-polysaccharides, which will coagulate at isoelectric point and gather in the foam layer. Thus, pH value has important influence on the equilibrium process of LBPs’ distribution between the foam layer and liquid. The results showed that the change of initial pH affected remarkably E and R: when p H was 3.50, E and R reached the maximum values, and recovery was increased significantly. This may be due to the reasons that pH 3.50 is just right isoelectric point of the combined protein with the best surface activity. With increasing the initial pH, enrichment ratio and recovery were changed complex, when pH was above 4.50, downward trend of recovery becomesslow, compared with enrichment ratio. It may suggest that structure of LBPs is complex with different kinds of combined proteins, leading to no more than one isoelectric point. Thus, we chose pH 3.50 as the optimal pH.
2.1.3 Effect of gas velocity on separation
50 mL of extract solution was diluted to 300 mL with ionized water, pH was adjusted to 3.50 and the gas velocity was controlled at different levels. Half an hour later, foam was collected and measure concentrations of LBPs in foam layer and the liquid were measured, then E and R were calculated separately. The trend was shown in Fig.4.

Fig.4 Effect of gas velocity on E and R
Gas velocity affected the stability of the foam and the height of the foam layer. Lower gas velocity caused the formation of the foam but the foam stayed longer in the column, which was easy to obtain dry foam and make a higher mass concentration and lower volume in the foam. Thus, enrichment ratio was high and recovery was low. With the increase of gas velocity, time for the foa m to stay in the column was decreased, but more and more foam was generated and raised quickly, but drainage rate by the gravity between foams remain the same, leading to large amount of liquid in the foam, with which enrichment ratio was reduced and recovery was increased. As shown in Fig.4, when gas velocity was under 100 mL/min, the amount of foam formed was too small; while when gas velocity was higher than 400 mL/min, gas flows was too fast and the bubbles are too easy to be broken, height of the foam layer was unstable, and solutions in the column showed a phenomena of “backmixing”, enrichment ratio decreases, however. Thus, the gas velocity of 300 mL/min was chosen as the optimal velocity.
2.2 RSM optimization[25-26]
As shown in Table 1, we used X1(dilution times), X2(initial pH), and X3(gas velocity) as independent variables, calculate enrichment ratio E and recovery R were calculated as response values (Y1, Y2), results were shown as the follows.

Table 1 Design and results of RSM
The Design-Expert gave the fitted result and analysis of variance showed the regression equation about the comprehensive effect on enrichment ratio and recovery:

Coefficient of the parameter represents its importance contributions to Y. It signifies tha t three selected single factors were not in simple linear relationship with E and R, but complex interactive effects exist. According to the results of the regression analysis (Table 2), The Model F-value of 8.28 implies that the model is significant. There is only a 1.57% chance that a “Model F-Value” could occur due to noise. The coefficient for the correlation between enrichment ratio and the variables was=2.26/2.41=0.94, the “Lack of Fit F-value” of 4.18 implies that the Lack of Fit is not significantly related to the pure error, and there is a 19.91% chance that a “Lack of Fit F-value” could occur due to noise, i.e, it is highly significant. In other words, 94% of the enrichment ratio was changed along with dilution folds, initial pH and gas velocity. Thus, it is appropriate for us to describe the true relationships between enrichment ratio and the three various factors. As to recovery (Table 3), The Model F-value of 4.03 implies that there is a 6.96% chance that a “Model F-Value” could occur due to noise. The linear correlation coefficient ofwas 0.88, The “Lack of Fit F-value” of 181.65 implies that the Lack of Fit is significant. There is only a 0.55% chance that a “Lack of Fit F-value” could occur due to noise. In addition, when the value of P is lower than 0.05, the effect is remarkable, therefore, only the items X2X3,,have significant influence on E and the,,affect R much, on the contrary.

Table 2 Analy sis of variance and regression analysis for E

Table 3 Analysis of variance and regression analysis for RTable 3 Analysis of variance and regression analysis for
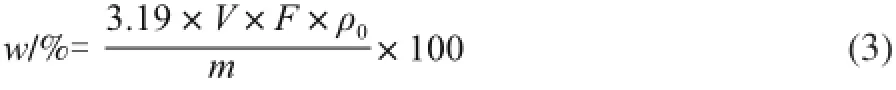
3D surface figure can vividly reflect the significance between response values and interaction of the factors. The steeper the curve is, the greater the influence of the factors on the corresponding value. When the characteristic values are positive, the curve takes a valley shape, there is a minimum;when the characteristic values are negative, the surface demonstrates a hill, there is a maximum; when negative or positive values appear simultaneous and saddle surface is formed, no extremum exists. Exactly, the projection from the 3-dimensional space point available elliptic contour map can be seen by the contour plot experiment the optimization of conditions should be in the center of the circle. According to the regression equations shown in the response surface analysis diagram and the corresponding contour map (Fig.5), it can be visually seen how the various factors influence on E and R. As shown below, the influence of initial pH on enrichment ratio was the largest, and the recovery depended greatly on dilution folds. However, gas velocity affected only slighly. Regression analysis results also confirmed the information given in the figure.


Fig.5 3D surface and contour plots showing the interactive effect of three factors on E and R
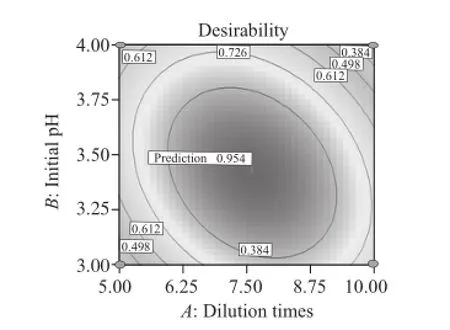
Fig.6 Desirability of the simulated model
Given that t he three single factors varied (in range), E and R to the target (maximum) to generate the optimization scheme[13]. Results showed that when diluted times =7.6, pH=3.42, gas velocity =295 mL/min, E and R can be up to the theoretic value of 2.57 and 57.31%, respectively, and desirability reaches 0.954 (Fig.6), meaning that the results are reliable. Furthermore, yield of LBPs by verifying experiment was 2.72%, and E was 2.41, R can be up to 61.28%.
2.3 Kinetic analysis[27]
Under th e optimized conditions simulated, dynamic process of LBPs purification by foam separation was researched. The foam was collected in compliance with the expected time, and the concentration of LBPs was determined in the foam layer. The residual liquid layer was obtained bysubtract of the total quality and a curve was drawn with ln(ρ0/ρ) as the variable and time as independent, results were shown in Fig.7.
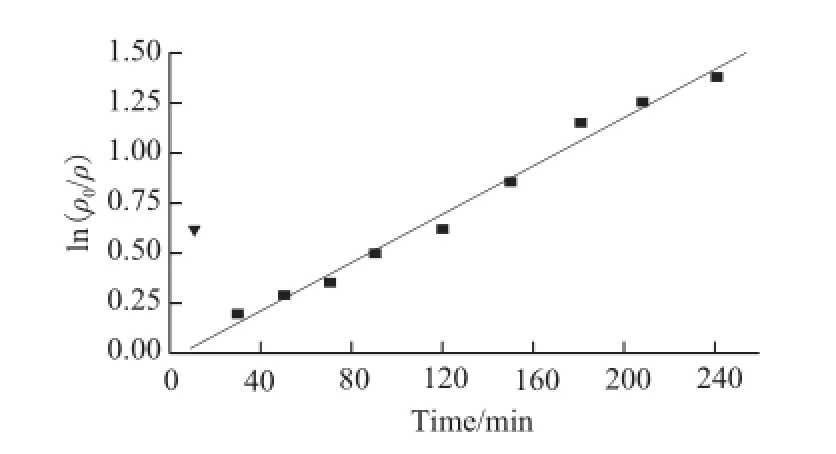
Fig.7 First-order reaction of LBPs purification by foam separation
Separation time affected the distribution balance of LBPs in the foam layer and the liquid. Results showed that ln (ρ0/ρ) changed linearly along with increasing time, ignoring the first point. The relative equation is Y=-0.029 82+0.006 02X (r2=0.995 21), i.e. ten minutes for equilibrium, the dynamic process belongs to first-order reaction with coefficient of 0.006 02 min-1. This may be due to the reasons that when time is too short, dynamic balance of ingredient with surface activity still has not been established in the gas-liquid interface, concentration of the target component is too high and E is increased as fast as time goes by. Concentration of LBPs in the foam layer increases, thus, R becomes higher and E lower. When for a too long time, the stability of foam layer is reduced, and the bubbles are easy to be broken, so volume of liquid is increased, and R falls fast.
3 Discussion
We mainly focused on optimization process of LBPs purification by foam separation. Compared with the traditional methods, it simplified the process with higher yield of LBPs, and avoided the heavy usage of organic solvents in the whole process to a great extent. In addition, the recycled ethanol can be used as precipitator. Through the result of rational optimization by RSM, the best technological condition was determined, with which we can control the related factors to generate the maximum yield of LBPs. As a result, we found an environmentally-friendly way for LBPs purification, trying to establish a new separation method for similar components. Moreover, the kinetics analysis result indicates that the process of foam separation could be regarded as first order reaction, meaning that the initial concentration in the extract does not affect the speed LBPs enriched in the foam layer, which provides theoretical support for the way to improve the efficiency of technological production. The measuring and analyzing the distribution of residence time are ongoing, and a mathematics model of this process is looking forward to be obtained.
nces:
[1] AMAGASE H, FAMSWORTH N R. A review of botanical characteristics, phytochemistry, clinical relevance in efficacy and safety of Lycium barbarum fruit (Goji)[J]. Food Research International, 2011, 44(7): 1702-1717.
[2] SU Yujing, HE Haimin, SUN Zhaoping. Study on status quo of application and prospect of development of the Lycium barbarum L. in food industries[J]. Food Science, 2002, 23(8): 292-295.
[3] KUMARAN A, KARUNAKARAN R J. Activity-guided isolation and identification of free radical-scavenging components from an aqueous extract of Coleus aromaticus[J]. Food Chemistry, 2007, 100(1): 356-361.
[4] QI Chunhui, ZHANG Yongxiang, CH EN Baowen, et al. Effects of Lycium barbarum polysaccharides on the splenocyte immune function of normal and aged model mouse and it’s possible mechanism in vitro[J]. Cellular Molecular Immunology, 1999, 15(9): 419-421.
[5] MA Hufei, WANG Simin, YANG Zhangmin. In vitro antioxidant activities of polysaccharides from wild Lycium barbarum in North Shaanxi[J]. Food Science, 2011, 32(3): 60-63.
[6] QIU Zhimin, RUI Hanming. Study on optimization of microwaveassisted extraction of polysaccharide from Lycium barbarum and research of its antioxidizability[J]. Science and Technology of Food Industry, 2012, 33(7): 220-223.
[7] LIANG Bin, JIN Minglin, LIU Hongbo. Water-soluble polysaccharide from dried Lycium barbarum fruits: isolation, structural features and antioxidant activity[J]. Carbohydrate Polyme rs, 2011, 83(4): 1947-1951.
[8] GAO Chunyan, TIAN Chengrui, ZHOU Mo. Study on antioxidant activities of Ch. wolfberry polysaccharides[J]. Journal of China Three Gorges University: Natural Sciences, 2005, 27(5): 457-458.
[9] CHEN Jing, PANG Yanjun, CAO Chunying, et al. Study on the extraction process of polysaccharide from Lycium barbarum L.[J]. China Medical Herald, 2009, 6(2): 16.
[10] CHEN Z S, SOO M Y, SRINIVASAN N, et al. Activation of macrophages by polysaccharid-protein complex from Lycium barbarum L.[J]. Phytotherapy Research, 2009, 23(8): 1116-1122.
[11] JIN Mingliang, HUANG Qingsheng, ZHAO Ke, et al. Biological activities and potential health benefit effects of polysaccharides isolated from Lycium barbarum L.[J]. International Journal of Biological Macromolecules, 2013, 54: 16-23.
[12] ZANOLI P, BENELLI A, ZAVATTI M, et al. Improved sexual behavior in male rats treated with a Chinese herbal extract: hormonal and neuronal implications[J]. Asian Journal of Andrology, 2008, 10(6): 937-945.
[13] TIAN Meili, WANG Min. Studies on extraction, isolation and composition of Lycium barbarum polysaccharides[J]. China Journal of Chinese Materia Medica, 2006, 31(19): 1604-1606.
[14] CAI Guanghua, WANG Xiaoling. Extraction of polysaccharides from Chinese wolfberry (Lycium barbarum L.) fruits by high intensity pulsed electric fields[J]. Food Science, 2012, 33(8): 43-48.
[15] DONG Jingzhou, WANG Zhicheng, WANG Ying. Rapid extraction of polysaccharides from fruits of Lycium barbarum L.[J]. Journal of Food Biochemistry, 2011, 35: 1047-1057.
[16] ZHANG Jiao, JIA Shaoyi, LIU Yong, et al. Optimization of enzyme-assisted extraction of the Lycium barbarum polysaccharides using response surface methodology[J]. Carbohydrate Polymers, 2011, 86(2): 1 089-1092.
[17] ZHAO Chao, YANG Rifu, QIU Taiqiu. Ultrasound enhanced subcritical water extraction of polysaccharides from Lycium barbarum L.[J]. Separation and Purification Technology, 2013, 120: 141-147.
[18] CHANG Liping, CHENG Jiahui, HSU S L, et al. Supercritical carbon dioxide anti-solvent purification of antioxidative compounds from Lycium barbarum fruits by using response surface methodology[J]. Separation and Purification Technology, 2012, 100: 66-73.
[19] KE Mang, ZHANG Xianjun, HAN Zihua, et al. Extraction, purification of Lycium barbarum polysaccharides and bioactivity of purified fraction[J]. Carbohydrate Polymers, 2011, 86(1): 136-141.
[20] ZHU Jing, LIU Wei, YU Juping, et al. Characterization and hypoglycemic effect of a polysaccharide extracted from the fruit of Lycium barbarum L.[J]. Carbohydrate Polymers, 2013, 98: 8-16.
[21] WEI Yuan, ZHANG Shenggui. Determination of content of Lycium barbarum polysaccharide by anthrone-sulfuric acid method[J]. Science and Technology of Food Industry, 2011, 32(3): 399-401.
[22] WANG C C, CHANG S C, CHEN B H. Chromatographic determination of polysaccharides in Lycium barbarum Linnaeus[J]. Food Chemistry, 2009, 116(2): 595-603.
[23] DENG Xiu. The progress of foam adsorption separation technology[J]. Petrochemical Technology, 1984, 13(9): 627-635.
[24] YIN Gang, ZHOU Rui, LI Chen, et al. Separation of carbohydrateprotein mixture by foam fractionation[J]. Chemical Engineering, 2000, 28(6): 34-37.
[25] YIN Guihao, DA NG Yuli. Optimization of extraction technology of the Lycium barbarum polysaccharides by Box-Behnken statistical design[J]. Carbohydrate Polymers, 2008, 74(3): 603-610.
[26] LIU Lin, YAN Ruiming, ZENG Fanjun. Study on optimization of the extraction technology of Lycium barbarum polysaccharides by response surface methodology[J]. Food and Fermentation Technology, 2011, 47(6): 33-35.
[27] LI Zhizhou. Study on optimization separation conditions of polysaccharide in Boletus edulis Bull by foam fractionation[J]. Food and Machinery, 2012, 28(3): 120-133.
泡沫分离法纯化枸杞多糖及其动力学过程分析
陈 亮,张 炜*,陈元涛,李轩领,刘海彬,高中超
(青海师范大学化学系,青海 西宁 810008)
采用泡沫分离法纯化枸杞多糖(Lycium barbarum polysaccharides,LBPs)。通过苯酚-硫酸法测定LBPs含量,以富集比(E)和回收率(R)为响应值,采用响应面法Box-Behnken设计,建立了三因素三水平拟合模型,优化了稀释倍数、初始pH值和气体流速对分离效果的综合影响;在验证得到的最佳工艺条件下,对枸杞多糖泡沫分离的动力学模型进行了分析。稀释倍数7.6、初始pH 3.42、气体流速295 mL/min时,富集比和回收率最高,分别为2.57和57.31%,与验证值(2.41和61.28%)的相对误差分别为6.6%和6.5%;动力学分析显示,泡沫分离枸杞多糖的过程可拟合为一级化学反应,等效速率常数为0.006 02min-1。实验建立了一种简单、高效的枸杞多糖纯化思路,并对生产工艺过程提供了一定的理论支持。
枸杞多糖;泡沫分离;苯酚-硫酸法;响应面法;动力学分析
TS218
A
1002-6630(2015)08-0029-08
2014-08-25
科技部科技人员服务企业项目(2009GJG20039)
陈亮(1989—),男,硕士研究生,研究方向为天然产物分离与提取。E-mail:Echol01@sina.cn
*通信作者:张炜(1972—),女,教授,硕士,研究方向为天然产物分离与提取。E-mail:zhangwei@qhnu.edu.cn
10.7506/spkx1002-6630-201508006