Quanti fi cation of tolvaptan in rabbit plasma by LC–MS/MS:Application to a pharmacokinetic study☆
2015-12-21KumarMoolaBalaSekharaReddyChallaChandrasekharKothapalliBannoth
Kumar S.Moola,Bala Sekhara Reddy Challa,Chandrasekhar Kothapalli Bannoth
aARPL Pvt.Ltd.,Bangalore 560099,India
bJawaharlal Nehru Technological University,Anantapur,Andhra Pradesh 522001,India
cVagdevi College of Pharmacy,Gurazala,Andhra Pradesh 522415,India
Original Article
Quanti fi cation of tolvaptan in rabbit plasma by LC–MS/MS:Application to a pharmacokinetic study☆
Kumar S.Moolaa,b,Bala Sekhara Reddy Challac,*,Chandrasekhar Kothapalli Bannothb
aARPL Pvt.Ltd.,Bangalore 560099,India
bJawaharlal Nehru Technological University,Anantapur,Andhra Pradesh 522001,India
cVagdevi College of Pharmacy,Gurazala,Andhra Pradesh 522415,India
A R T I c L E I N F o
Article history:
16 August 2014
Accepted 3 September 2014
Available online 7 October 2014
Tolvaptan LC–ESI–MS/MS Rabbit plasma Liquid–liquid extraction Pharmacokinetics
A sensitive,selective and high-throughput liquid chromatography–tandem mass spectrometry(LC–ESI–MS/MS)method was developed and validated for the quantitation of tolvaptan in rabbit plasma.Sample clean-up involved liquid–liquid extraction(LLE)and chromatography was performed on Zorbax SB C18analytical column(50 mm×2.1 mm,3.5μm)using 0.1%formic acid:methanol(20:80,v/v)as the mobile phase.The parent→product ion transitions for the drug(m/z 449.2→252.1)and IS(m/z 456.2→259.2) were monitored on a triple quadrupole mass spectrometer,operating in the multiple reaction monitoring (MRM)and positive ion mode.The method was validated over the concentration range of 0.10–1000.00 ng/mL and successfully applied to a pharmacokinetic study of healthy rabbits.
©2015 Xi'an Jiaotong University.Production and hosting by Elsevier B.V.This is an open access article under the CC BY-NC-ND license(http://creativecommons.org/licenses/by-nc-nd/4.0/).
1.Introduction
Tolvaptan is especially useful for heart failure patients as the y have higher serum levels of vasopressin.Tolvaptan(INN),also known as OPC-41061,is a selective,competitive vasopressin receptor 2 antagonist used to treat hyponatremia(low blood sodium levels)associated with congestive heart failure,cirrhosis,and the syndrome of inappropriate antidiuretic hormone(SIADH)[1]. Chemically it is(±)-4ʹ-[(7-chloro-2,3,4,5-tetrahydro-5-hydroxy-1H-1-benzazepin-1-yl)carbonyl]-otolu-m-toluidide.The empirical formula is C26H25ClN2O3and its molecular weight is 448.94[2]. The pharmacokinetic properties of tolvaptan are stereospeci fi c, with a steady-state ratio of the S-(-)to the R-(+)enantiomer of about 3.The absolute bioavailability of tolvaptan is unknown.At least 40%of the dose is absorbed as tolvaptan or metabolites.Food does not affect the bioavailability of tolvaptan.Tolvaptan is metabolized in the liver and its metabolites are inactive.The pharmacokinetic parameters of tolvaptan in healthy subjects were reported as follows:Tmax2–4 h,Cmax374 ng/mL,AUC0-243.71μg h/mL,AUC(∞)4.55μg·h/mL,t1/212 h[3,4].
Literature retrieval revealed that there were few methods reported for quantitation of tolvaptan in biologicalmatrices[2,5–14]. As of now,to our knowledge,a few studies on tolvaptan pharmacokinetics have been reported[2,5–14].The LC–MS/MS methods for determination of tolvaptan described in these papers have several obvious shortcomings.Firstly,the lower limit of quantitations(LLOQs)in these reports were 0.457[5],2[10],5[6–9,12,13]
and 10 ng/mL[11],respectively.The low sensitivity could not meet the requirement of the pharmacokinetic study of low-dose tolvaptan.Secondly,the time-consuming and expensive solid-phase extraction was used for pretreatment of samples in these methods [2,6–13].The PPT method was not suitable for highthroughput determination in pharmacokineticstudy[5]. Thirdly, chromatography and validation details were not provided in these reports[2,6–13],which might have little guiding signi fi cance for reproducing or developing the determination methods of tolvaptan.This was achieved by Peiet al.,[5]and Derangula et al.[14].In this paper,we developed and validated a highly sensitive,simple and speci fi c LC–MS/MS method for determination of tolvaptan in rabbit plasma using LLE for the fi rst time.The method was successfully applied to a pharmacokinetic study of tolvaptan in
healthy rabbits.
2.Experimental
2.1.Chemicals and materials
Reference standards of tolvaptan(99.7%)were obtained fromVivan life sciences(Mumbai,India)and tolvaptan-D7(99.89%,IS) was procured from United States of Pharmacopoeia(USP)(Fig.1). HPLC grade methanol and acetonitrile were obtained from Mallinckrodt Baker(Mexico).Reagent grade formic acid was obtained from Merck Specialties Pvt.Ltd.,(Mumbai,India).HPLC grade methyl tertiary butyl ether and dichloromethane were obtained from RCI Labscan(Mumbai,India).Water used in the entire analysis was prepared from the Milli-Q water puri fi cation system procured from Millipore(Bangalore,India).Rabbits were procured from Bioneeds(Bangalore,India).
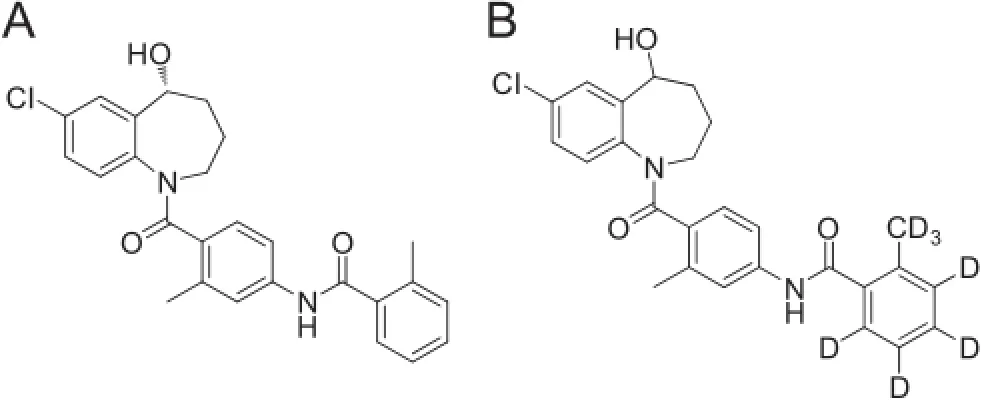
Fig.1.Chemical structures of tolvaptan and tolvaptan-D7.
2.2.Instrumentation
The 1200 Series HPLC system(Agilent Technologies,Waldbronn,Germany)connected to the API 4200 triple quadrupole mass spectrometer(ABI-SCIEX,Toronto,Canada)with a turboelectrospray interface in positive-ion mode was used for detection. Data processing was performed on Analyst 1.5.1 software package (SCIEX).
2.3.Standard stock,calibration standards and quality controlsample preparation
The standard stock solutions of 100.00μg/mL of tolvaptan and tolvaptan-D7 were prepared by dissolving a requisite amount in methanol.Calibration standards and quality control(QC)samples were prepared with blank plasma from a standard stock solution of tolvaptan.Calibration curve standards were made at concentrations of 0.10,0.20,0.50,1.00,10.00,100.00,200.00,400.00, 600.00,800.00 and 1000.00 ng/mL,while QC samples were prepared at four levels,viz.700.00 ng/mL(HQC,high quality control), 500.00 ng/mL(MQC,middle quality control),0.30 ng/mL(LQC,low quality control)and 0.10 ng/mL(LLOQC,lower limit of quality control)for tolvaptan.From internal standard stock solution,IS working solution of 100.00 ng/mL was prepared with 70%MeOH in 0.1%formic acid and stored at 2–8°C in the refrigerator.Calibration standards and QC samples were stored at-30°C until use.
2.4.Chromatographic conditions
Chromatographic separation was carried out on a reversedphase Zorbax SB C18column(50 mm×2.1 mm,3.5μm)using 0.1% formic acid:methanol(20:80,v/v)as the mobile phase at a fl owrate of 0.6 mL/min at 40°C.Retention time of tolvaptan and tolvaptan-D7 was found to be approximately 0.9±0.2 min with a total runtime of 1.5 min.
2.5.Mass spectrometric conditions
Ionization and detection of the analyte and IS were carried out on a triple quadrupole mass spectrometer,AB-SCIEX(Toronto, Canada),equipped with electrospray ionization and operated in positive ion mode.Quantitation was performed using multiple reaction monitoring(MRM)mode to monitor parent→product ion (m/z)transition for tolvaptan 449.2→252.1(Fig.2A and Fig.2B). For IS,the[M+H]+(m/z 456.2)was monitored as the precursor ion(Fig.3A)and a fragment at m/z 259.2 was monitored as the product ion(Fig.3B).Mass parameters were optimized as source temperature 600°C,nebulizer gas 30(nitrogen)psi,heater gas 40 (nitrogen)psi,curtain gas 25(nitrogen)psi,CAD gas 7(nitrogen) psi,ion spray(IS)voltage 5500 V,source fl ow rate 0.6 mL/min without split,entrance potential 10 V,declustering potential 40 V, and collision energy 16 V for both the analyte and IS,collision cell exit potential 12 V and the dwell time 200 ms for the analyte andcollision cell exit potential 10 V for IS.
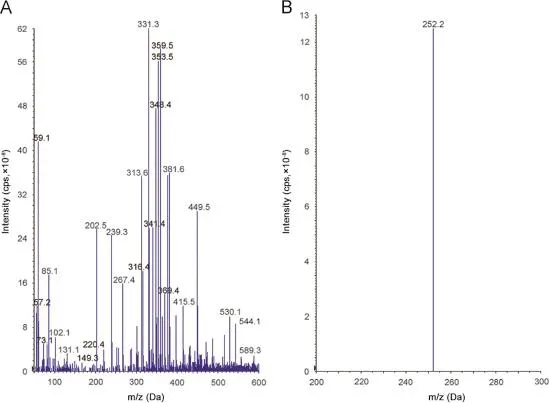
Fig.2.Parent ion mass spectrum(A)and product ion spectrum(B)of tolvaptan.
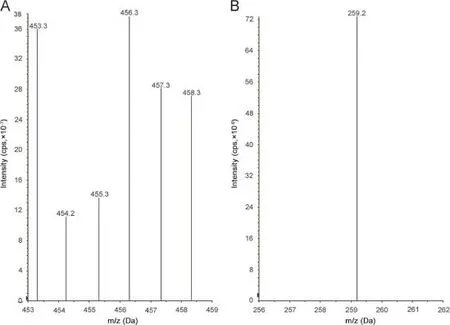
Fig.3.Parent ion mass spectrum(A)and product ion spectrum(B)of tolvaptan-D7.
2.6.Sample preparation
Prior to analysis,all frozen subject samples,calibration standards and QC samples were thawed and allowed to equilibrate at room temperature.To an aliquot of 50μL of spiked plasma sample, 50μL of IS was added and vortexed brie fl y.To these samples,3 mL of extraction solvent(methyl tertiary butylether:dichloromethane (80:20)v/v)was added and capped and the samples were vortexed for 5 min.Centrifugation of the samples was done at 4000 rpm for 5 min at 20°C.Supernatant from each sample was transferred into respective tubes and evaporated to dryness under nitrogen at 40±2°C.The dried samples were reconstituted with 500μL of methanol:0.1%formic acid(70:30,v/v).All the tubes containing samples were vortexed brie fl y and transferred into autosampler vials for injection into the chromatographic system.
2.7.Method validation
The method validation was performed as per the United States Food and Drug Administration(USFDA)guidelines[15].The method was validated for system suitability,carryover,linearity, selectivity,precision and accuracy,sensitivity,matrix effect,recovery and stability.
2.7.1.System suitability and autosampler carryover
System suitability experiment was performed by using aqueous solution of tolvaptan and IS at the start of each batch during the method validation.The carryover effect of the autosampler was evaluated by injecting a sequence of aqueous standard,mobile phase,standard blank and extracted standard equivalent to the highest standard in the calibration range.As per the acceptance criteria,the response in the blank should not be greater than 20% of LOQ response.
2.7.2.Linearity and LLOQ
The linearity of the method was determined by analysis of fi ve linear curves containing eleven non-zero concentrations.The ratio of analyte to IS area versus analyte concentration was used for regression analysis.Each calibration curve was analyzed individually by using least square weighted(1/x2)linear regression. The lowest standard on the calibration curve was accepted as the LOQ if the analyte response was at least fi ve times more than that of drug-free(blank)extracted plasma.The deviation of standards other than LLOQ from the nominal concentration should not be more than±15.0%.For LLOQ,it should not be more than±20.0%.
2.7.3.Precision and accuracy
For determining the intra-day accuracy and precision,replicate analysis of plasma samples of tolvaptan was performed on the same day.The run consisted of a calibration curve and six replicates of LLOQC,LQC,MQC and HQC samples.The inter-day accuracy and precision were assessed by analysis of fi ve precision and accuracy batches on four consecutive validation days.The precision of the method was determined by calculating the percent coef fi cient of variation(%CV)for each level.The deviation at each concentration level from the nominal concentration was expected to be within±15.0%,except LLOQ,for which it should be within±20.0%.
2.7.4.Selectivity
The selectivity of the method towards endogenous plasma matrix components was assessed in ten lots(fi ve K2EDTA plasma lots,two hemolyzed lots,two lipimic lots and one heparinised lot) of blank rabbit plasma.This was done to estimate the extent to which endogenous plasma components contribute towards interference at the retention time of the analytes and IS.The cross talk of MRMfor analyte and IS was checked using the highest standard on the calibration curve and working solution of IS(Fig.4).
2.7.5.Matrix effect
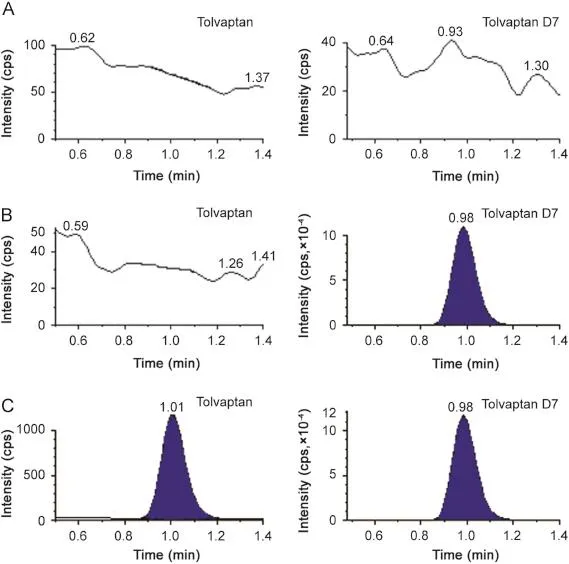
Fig.4.(A)Blank,(B)Blank+IS,and(C)LLOQ chromatograms of tolvaptan and tolvaptan-D7 in rabbit plasma.
Ion suppression/enhancement effects on the MRM LC–MS/MS sensitivity were evaluated by the post-column analyte infusion experiment.A standard solution containing tolvaptan(at MQC level)and IS was infused post-column into the mobile phase at 10μL/min by employing the in-built infusion pump.Aliquots of 10μL of extracted control plasma were then injected into the column by the autosampler,and MRM LC–MS/MS chromatogram was acquired for the analytes and IS.Any dip in the baseline upon injection of double blank plasma(without IS)would indicate ion suppression,while a peak at the retention time of the analyte and IS indicates ion enhancement.
2.7.6.Recovery
The relative recovery(RE)and process ef fi ciency were assessed;allthree parameters were evaluated at HQC,MQC and LQC levels in six replicates.
RE was calculated by comparing the mean area response of extracted samples(spiked before extraction)to that of un-extracted samples(spiked after extraction)at each QC level.The recovery of IS was similarly estimated.
The overall‘process ef fi ciency’(PE)was calculated as (ME×RE)/100.The assessment of relative matrix effect was based on the direct comparison of the MS/MS responses(peak areas)of the analytes spiked into extracts originating from different lots of plasma.The variability in these responses,expressed as CV(%), was considered as the measurement of relative matrix effect.
Absolute matrix effect(ME)was assessed by comparing the mean area response of un-extracted samples(spiked after extraction)with that of neat standard solutions.
2.7.7.Stability
Stability experiments were carried out to examine the analyte stability in stock solutions and in plasma samples under different conditions.Short-term stability at room temperature and longterm stability of spiked solution stored at-30°C were assessed by comparing the area response of stability sample of the analyte and IS with that of sample prepared from fresh stock solutions.The solutions were considered stable if the deviation from nominal value was within±10%.
Autosampler(wet extract)stability,bench top stability,freeze–thaw stability and long-term stability were performed at LQC and HQC levels in six replicates at each level.The samples were considered stable if the deviation from the mean calculated concentration of freshly thawed QC samples was within±15%.
2.8.Analysis of plasma samples
The bio-analytical method described above was used to determine tolvaptan concentrations in plasma followed by oral administration to healthy rabbits.Six New Zealand albino male rabbits weighing between 1.5 and 1.8 kg were kept in individual cages and maintained at 25°C for 10 days prior to experiment. Standard diet and water ad libitum were given to them.All experiments were performed according to the guidelines of the Institutional Animal Ethics Committee,Bioneeds Bangalore.Tolvaptan,2.77 mg/1.8 kg body weight(equivalent dose of 30 mg tolvaptan tablet),was administered orally in a single dose.All studieswere performed after keeping rabbits for overnight fasting.Blood samples of 0.3 mL were collected at the interval 0(pre-dose) 0.333,0.667,1.333,2.667,3,3.333,3.67,4.5,8,16,30,36,42 and 48 h(post-dose)in heparinized Eppendorf tubes.These samples were centrifuged immediately at 3500 rpm and 4°C temperature for 10 min.Plasma samples were taken and stored at-30°C until assay.Pharmacokinetic parameters like peak plasma concentration (Cmax),time to reach peak plasma concentration(Tmax),area under the concentration–time curve(AUC)and elimination half-life(t1/2) were calculated by a non-compartmental statistic model using Win Non-Lin 5.1 software(Pharsight,USA).
2.9.Pharmacokinetics and statistical analysis
Blood samples were taken for a period of 3–5 times of the terminal elimination half-life(t1/2)and it was considered as the area under the concentration–time curve(AUC)ratio higher than 80%as per the FDA guidelines.Plasma tolvaptan concentration–time pro fi les were visually inspected,and Cmaxand Tmaxvalues were determined.The AUC0–twas obtained by the trapezoidal method.The AUC0–∞was calculated up to the last measureable concentration,and extrapolations were obtained using the last measureable concentration and the terminal elimination rate constant(Ke)was estimated from the slope of the terminal exponential phase of the plasma of the tolvaptan concentration–time curve(by means of the linear regression method).The terminal elimination half-life(t1/2)was then calculated as 0.693/Ke.The pharmacokinetic parameters were considered when the ratio of averages of log transformed data was within 80%–125%for AUC0–t, AUC0–∞and Cmax[16–18].
3.Results and discussion
3.1.Method development
During method development,different options were evaluated to optimize mass spectrometry detection parameters,chromatography and sample extraction.
3.1.1.Mass spectrometry detection parameters optimization
Electrospray ionization(ESI)provided a maximum response over atmospheric pressure chemical ionization(APCI)mode and was chosen for this method.The instrument was optimized to obtain sensitivity and signalstability during infusion of the analyte in the continuous fl ow of mobile phase to electrospray ion source operated at both polarities at a fl ow rate of 10μL/min.Tolvaptan gave more responses in positive ion mode as compared to the negative ion mode.The predominant peaks in the primary ESI spectra of tolvaptan and tolvaptan-D7 correspond to the[M+H]+ions at m/z 449.2 and 456.2,respectively[Figs.2A and 3A].Product ions of tolvaptan and tolvaptan-D7 were m/z of 252.1 and 259.2, respectively[Figs.2B and 3B].
3.1.2.Chromatography optimization
Initially,a mobile phase consisting of ammonium formate and methanol in varying combinations was tried,but a low response was observed.The mobile phase containing ammonium acetate: acetonitrile(20:80,v/v)gave the better response,but poor peak shape was observed.A mobile phase with various strengths of formic acid in water in combination with methanol and acetonitrile with varying combinations was tried.Using a mobile phase containing 0.1%formic acid in water in combination with methanol(20:80,v/v),the best signal along with a marked improvement in the peak shape was observed for tolvaptan and tolvaptan-D7.
Short length columns such as Symmetry Shield RP18(50 mm×2.1 mm,3.5μm),Inertsil ODS-2V(50 mm×4.6 mm, 5μm),Hypurity C18(50 mm×4.6 mm,5μm)and Hypurity Advance(50 mm×4.0 mm,5μm)were tried during the method development.Symmetry Shield RP18column gave a relatively good peak shape,but the response was low.Using Hypurity C18column, poor chromatography was observed.The best signal was obtained using the Zorbax SB C18(50 mm×2.1 mm,3.5μm)column.It gave satisfactory peak shapes for both tolvaptan and tolvaptan-D7.Flow rate of the mobile phase was adjusted and optimized at 0.6 mL/ min without splitter.Both the drug and IS were eluted at 0.9 min with the total run time of 1.5 min.For an LC–MS/MS analysis, utilization of stable isotope-labeled or suitable analog drugs as an internal standard proved helpful when a signi fi cant matrix effect was possible.In our case,tolvaptan-D7 was found to be best for the present purpose.The column oven temperature was kept at a constant temperature of about 40°C.Injection volume of 10μL sample was adjusted for better ionization and chromatography.
3.1.3.Extraction optimization
Prior to loading the sample for LC injection,the co-extracted proteins should be removed from the prepared solution.For this purpose,we initially tested different extraction procedures like protein precipitation(PP),liquid–liquid extraction(LLE),and solid phase extraction(SPE).We found ion suppression effect in PP method for the drug and IS.Further,we tried with SPE and LLE and found that LLE was suitable for extraction of the drug and IS.We tried several organic solvents(ethyl acetate,chloroform,n-hexane, dichloromethane and methyl tertiary butyl ether)individually as well with combinations in LLE to extract the analyte from the plasma sample.In our case,the methyl tertiary butyl ether:dichloromethane(80:20,v/v)combination served as a good extraction solvent.High recovery and selectivity were observed in the LLE method.These optimized detection parameters,chromatographic conditions and extraction procedure resulted in reduced analysis time with accurate and precise detection of tolvaptan in rabbit plasma.
3.2.Method validation
The method was validated in terms of system suitability,carryover,linearity,selectivity,precision and accuracy,sensitivity, matrix effect,recovery,stability,ruggedness and dilution integrity. 3.2.1.System suitability and autosampler carryover
Throughout the method validation,the CV of the system suitability was observed below 5.0%at the retention time of tolvaptan and IS.Carryover evaluation was performed in each analytical run to ensure that it did not affect the accuracy and precision of the proposed method.There was a negligible carryover(≤5%of the LLOQ response)observed during autosampler carryover experiment.No enhancement in the response was observed in double blank after subsequent injection of the highest calibration standard(aqueous and extracted)at the retention time of the analyte and IS.
3.2.2.Linearity and LLOQ
The calibration curves were linear over the concentration range of 0.10–1000.00 ng/mL with the correlation coef fi cient r≥0.9850 for tolvaptan(Table1).
3.2.3.Precision and accuracy
The accuracy and precision(%CV)observed for the calibration curve standards ranged from 96.83%to 112.80%and 0.95%to 13.91%for tolvaptan.The lowest concentration(LLOQ)in the standard curve for tolvaptan was measured at a signal-to-noise ratio(S/N)of≥20.The intra-and inter-batch precision andstock solutions were compared with stock solutions prepared before 9 days.The%change for tolvaptan and tolvaptan-D7 were both less than 5%,indicating that stock solutions were stable at least for 9 days.

Table 1 Calibration curve details.

Table 2 Precision and accuracy(analysis with spiked plasma samples at four different concentrations).
Bench top and autosampler stability for tolvaptan was investigated at LQC and HQC levels.The results revealed that tolvaptan was stable in plasma for at least 24 h at room temperature and 72 h in an autosampler.It was con fi rmed that repeated freezing and thawing(three cycles)of plasma samples spiked with tolvaptan at LQC and HQC levels did not affect their stability.The long-term stability results also indicated that tolvaptan was stable in a matrix up to 65 days at-30°C(Table 3).
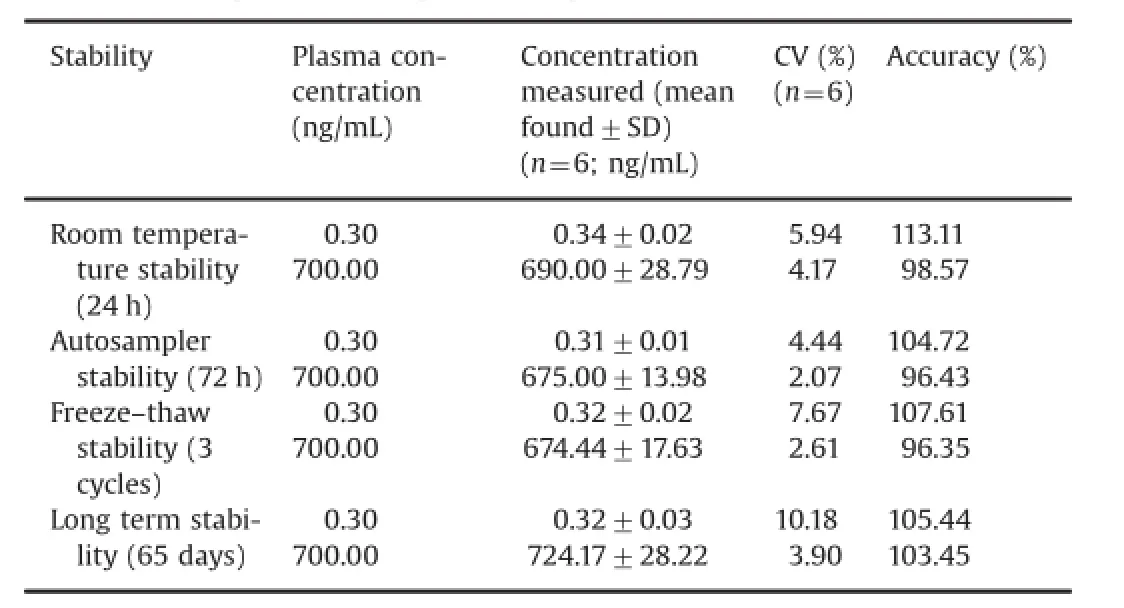
Table 3 Stability of tolvaptan in rabbit plasma samples.
3.3.Application of the method
The above validated method was used in the determination of tolvaptan in plasma samples for establishing the pharmacokinetics of a single 2.77 mg/1.8 kg body weight(equivalent dose to 30 mg tablet)in 12 healthy rabbits by oral route.Typical plasma concentration versus time pro fi les is shown in Fig.5.All the plasma concentrations of tolvaptan were within the standard curve region and retained above 0.1 ng/mL(LOQ)for the entire sampling period (Table 4).
4.Conclusion
The proposed method exhibited excellent performance in terms of sensitivity,selectivity,ruggedness and ef fi ciency(1.5 min per sample)due to cleaner extracts,with simplicity of sample preparation.This method was successfully applied to pharmacokinetics of rabbit plasma.
Acknowledgments
The authors are grateful to the Indian Institute of Chemical accuracy were established from validation runs performed at HQC, MQC,LQC and LLOQ QC levels.The intra-and inter-batch precision ranged from 2.12%to 7.76%and 1.17%to 9.19%,respectively,for tolvaptan.The accuracy values were within 97.43%–113.33%and 97.05%–114.60%for the analyte in intra-and inter-batches (Table 2).
3.2.4.Selectivity
To establish the selectivity of the method for interference due to endogenous plasma components from haemolysed,lipidemic, heparinised and K2EDTA blank plasmas,the%change in the area ratio(analyte/IS)at LLOQ level was within 4%–6%,while the precision(%CV)in their measurement varied from 2.0%to 4.5%.
The extraction procedure together with mass detection gave very good selectivity for the analysis of the drug and IS in the blank plasma.No endogenous interferences were found at the retention times of the analyte and IS.
3.2.5.Matrix effect
Matrix effect may be de fi ned as a composite of some undesirable effects that originate from a biological matrix.These components may result in ion-suppression/ion-enhancement,decrease/increase in sensitivity of analytes over a period of time, increased baseline,imprecision of data,drift in retention time and distortion or tailing of a chromatographic output.The result of a post-column infusion experiment indicated no ion suppression or enhancement at the retention time of the analyte and IS as evident from the fl at baseline.There was no ion suppression and enhancement observed at retention time of the analyte and IS.
3.2.6.Recovery
The relative recovery and process ef fi ciency for the drug was 87.10%.The recovery for IS in rabbit plasma was 90.37%.
3.2.7.Stability
Stock solution stability was performed to check stability of tolvaptan and tolvaptan-D7 in stock solutions prepared in methanol and stored at 2–8°C in a refrigerator.The freshly preparedTechnology,Hyderabad for Literature survey and Acron Accunova, Manipal,India,for their Lab facility of this research work.
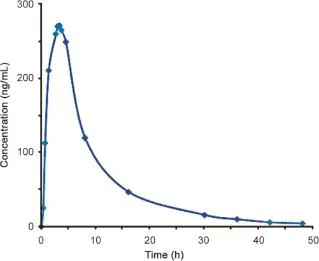
Fig.5.Mean plasma concentrations vs.time graph of tolvaptan after oral administration of 2.77 mg/1.8 kg in male rabbits.
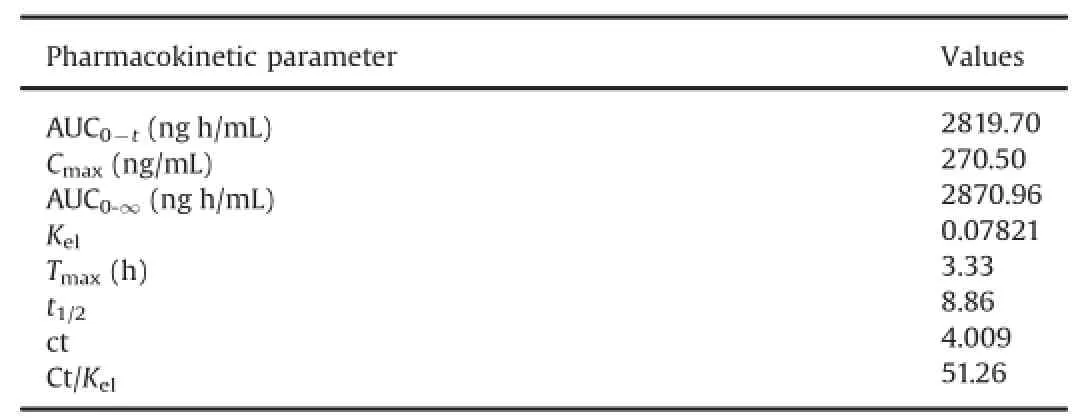
Table 4 Mean pharmacokinetic parameters of tolvaptan in rabbit plasma after oral administration of 2.77 mg/1.8 kg in male rabbits.
References
[1]R.W.Schrier,P Gross,M.Gheorghiade,et al.,Tolvaptan,a selective oral vasopressin V2-receptor antagonist for hyponatremia,N.Engl.J.Med.355(2006) 2099–2112.
[2]S.E.Shoaf,Z.Wang,P.Bricmont,et al.,Pharmacokinetics,pharmacodynamics and safety oftolvaptan,a nonpeptide AVP antagonist,during ascending singledose studies in healthy subjects,J.Clin.Pharmacol.47(2007)1498–1507.
[3]J.E.Udelson,F.M.Grew,E.Flores,et al.,Multicenter,randomized,double-blind, placebo-controlled study on the effect of oraltolvaptan on left ventricular dilation and function in patients with heart failure and systolic dysfunction,J. Am.Coll.Cardiol.49(2007)2151–2159.
[4]M.Gheorghiade,C Orlandi,J.C.Burnett Jr.,et al.,Rationale and design of the multicenter,randomized,double-blind,placebo-controlled study to evaluate the ef fi cacy of vasopressin antagonism in heart failure:outcome study with tolvaptan(Everest),J.Card.Fail.11(2005)260–269.
[5]Q.Pei,B.Zhang,H.Tan,et al.,Development and validation of an LC–MS/MS method for the determination of tolvaptan in human plasma and its application to a pharmacokinetic study,J.Chromatogr.B 913–914(2013)84–89.
[6]S.E.Shoaf,S.R.Kim,P.Bricmont,et al.,Pharmacokinetics and pharmacodynamics of single-dose oral tolvaptan in fasted and non-fasted states in healthy caucasian and Japanese male subjects,Eur.J.Clin.Pharmacol.68(2012)1595–1603.
[7]S.E.Shoaf,P.Bricmont,S.Mallikaarjun,et al.,Absolute bioavailability of tolvaptan and determination of minimally effective concentrations in healthy subjects,Int.J.Clin.Pharmacol.Ther.50(2012)150–156.
[8]S.E.Shoaf,P.Bricmont,S.Mallikaarjun,et al.,Effects of CYP3A4 inhibition and induction on the pharmacokinetics and pharmacodynamics of tolvaptan,a non-peptide AVP antagonist in healthy subjects,Br.J.Clin.Pharmacol.73 (2012)579–587.
[9]S.E.Shoaf,Y.Ohzone,S.Ninomiya,et al.,In vitro P-glycoprotein interactions and steady-state pharmacokinetic interactions between tolvaptan and digoxin in healthy subjects,J.Clin.Pharmacol.51(2011)761–769.
[10]S.R.Kim,T.Hasunuma,O.Sato,et al.,Pharmacokinetics,pharmacodynamics and safety of tolvaptan,a novel,oral,selective nonpeptide AVP V2-receptor antagonist:results of single-and multiple-dose studies in healthy Japanese male volunteers,Cardiovasc.Drugs Ther.25(2011)S5–S17.
[11]S.Yi,H.Jeon,S.H.Yoon,et al.,Pharmacokinetics and pharmacodynamics of oral tolvaptan administered in 15-to 60-mg single doses to healthy Korean men,J.Cardiovasc.Pharmacol.59(2012)315–322.
[12]S.E.Shoaf,S.Mallikaarjun,P.Bricmont,Effect of grapefruit juice on the pharmacokinetics of tolvaptan,a non-peptide arginine vasopressin antagonist,in healthy subjects,Eur.J.Clin.Pharmacol.68(2012)207–211.
[13]S.E.Shoaf,S.L.Bramer,P.Bricmont,C.A.Zimmer,Pharmacokinetic and pharmacodynamic interaction between tolvaptan,a non-peptide AVP antagonist, and furosemide or hydrochlorothiazide,J.Cardiovasc.Pharmacol.50(2007) 213–222.
[14]V.R.Derangula,N.R.Pilli,B.R.Bhukya,et al.,Bioanalysis of tolvaptan,a novel AVP-V2 receptor antagonist in human plasma by a novel LC–ESI–MS/MS method:a pharmacokinetic application in healthy South Indian male subjects, Biomed.Chromatogr.28(2014)332–340.
[15]Guidance for Industry:Bioanalytical Method Validation,U.S.Department of Health and Human Services,Food and Drug Administration,Center for Drug Evaluation and Research(CDER),Center for Biologics Evaluation and Research (CBER),2001.
[16]Thejomoorthy Karavadi,B.R.Challa,Bio-analytical method development and validation of pregabalin by solid phase extraction with HPLC–MS/MS:application to a pharmacokinetic study,J.Liq.Chromatogr.Relat.Technol.37(2013) 130–144.
[17]Guidance for Industry Food-effect Bioavailability and Fed Bio Equivalence Studies,U.S.Department of Health and Human Services,Food and Drug Administration,Center for Drug Evaluation and Research(CDER),2002.
[18]Guidance for Industry Bioavailability and Bioequivalence Studies for Orally Administered Drug Products—General Considerations,U.S.Department of Health and Human Services,Food and Drug Administration,Center for Drug Evaluation and Research(CDER),2003.
7 July 2014
in revised form
☆Peer review under responsibility of Xi'an Jiaotong University.
.Tel.:+91 9010285749;fax:+91 8088259567.
E-mail addresses:baluchalla_99@yahoo.com,
reddysampathu@yahoo.co.uk(B.S.R.Challa).
杂志排行
Journal of Pharmaceutical Analysis的其它文章
- Application of analytical instruments in pharmaceutical analysis
- Comparative study of adsorptive role of carbonaceous materials in removal of UV-active impurities of paclitaxel extracts☆
- In vitro–in vivo studies of the quantitative effect of calcium, multivitamins and milk on single dose cipro fl oxacin bioavailability☆
- Optimization,validation and application of an assay for the activity of HMG-CoA reductase in vitro by LC–MS/MS☆
- Antimicrobial and antiproliferative prospective of kosinostatin–a secondary metabolite isolated from Streptomyces sp.☆
- Identi fi cation,synthesis and characterization of process related des fl uoro impurity of ezetimibe and HPLC method validations☆
