Analysis of Tibetan Plateau Vortex Activities Using ERA-Interim Data for the Period 1979-2013
2015-11-21LINZhiqiang林志强
LIN Zhiqiang(林志强)
Tibetan Autonomous Regional Climate Center,Lhasa 850000
(Received March 24,2015;in final form August 12,2015)
Analysis of Tibetan Plateau Vortex Activities Using ERA-Interim Data for the Period 1979-2013
LIN Zhiqiang∗(林志强)
Tibetan Autonomous Regional Climate Center,Lhasa 850000
(Received March 24,2015;in final form August 12,2015)
Based on the ECMWF Interim reanalysis(ERA-Interim)500-hPa height data for the period 1979-2013,the Tibetan Plateau vortex(TPV)activities are investigated with an objective identification and tracking algorithm.The vortex tracks over the Tibetan Plateau(TP)and its vicinity are identified,and the cold/warm nature of the TPV is revealed from the 500-hPa temperature fields.A TPV activity dataset is thus derived. Examination of the TPV frequency,intensity,persistence,geographical location,and migration from the TP suggests an average of 53 TPVs annually during the study period,with 6.7 of them shifting out of the TP. For these vortexes,the longer the lifetime,the lower the frequency,and 81%of the TPVs are initially warm in nature.The particularly high-intensity vortexes occur dominantly in the rainy period(May-September),with their origin mainly in western Nagqu and northern Ali.They disappear largely in the Tanggula maintain area on the east side of the vortex high-frequency center and the Dangqu River valley in western Qinghai Province,possibly due to the topography.It is also found that the frequency of TPVs is decreasing,with 2 fewer TPV occurrences per 10 yr.Meanwhile,it is statistically significant that 1.4 fewer TPVs move out of the TP and the percentage of TPVs moving out of the TP versus the total number of TPVs has reduced by 2.3%every 10 yr.
plateau vortex,objective identification,ERA-Interim,climate characteristics
1.Introduction
As early as in the 1960s,Chen(1964)and Wu(1964)reported the existence of Tibetan Plateau vortexes(TPVs).A subsequent study noted that the horizontal scale of a TPV is approximately 500 km and its vertical scale is approximately 2-3 km(Ye and Gao,1979).These shallow systems are produced in the Tibetan boundary layer during boreal summer,wherein Nagqu is one of the key source regions.The TPV is a sub-synoptic low-pressure gyre(Li,2007;Chen and Li,2011),whose formation and development is related to the unique thermal and dynamical characteristics of the Tibetan Plateau(TP)(Lhasa Group of Tibetan Plateau Meteorological Research,1981).Sensible heating produced by cumulus convection and turbulence(Luo,1992;Luo et al.,1993),pumping in the boundary layer(Li and Xu,2005),together with atmospheric low-frequency oscillation(Zhang et al.,2010),play an important role in the genesis and development of TPVs.The TPV has properties in its thermal structure that are similar to those of a tropical cyclone(Li and Jiang,2000;Li Guoping et al.,2011).
Recent studies on the mechanism of genesis and development of these vortexes have emphasized the role of water vapor and related latent heat release from vapor condensation in the formation and development of TPVs.As shown in Li et al.(2014a),the daily change in the TPV frequency is closely linked to net vapor flux into the TP,leading to the fact that the time interval of frequent occurrence of TPVs corresponds to the strongest net vapor flux,and the latent heating from the convergent rising air motion over the region serves as the key cause of frequent vortex for-mation.In addition,the latent heat release due to convergent rising air motion in the eastern part of the TPV acts as an important mechanism of the TPV moving eastward(Li Guoping et al.,2011;Li et al.,2014a).
The summer vortexes over the TP have a critical effect on its weather,serving as one of the dominant precipitating systems(Yu et al.,2012;Lin et al.,2014a,b).Under a favorable circulation pattern and appropriate moisture transport conditions,some TPVs are able to move eastward out of the TP and develop strongly enough to give rise to large-scale rainfall and intense convective weather in downstream regions of China(Guo,1986;Yu and Gao,2006;Yu et al.,2007,2008,2012,2014;Yu,2008;He et al.,2009b). Furthermore,coupling of an eastward traveling TPV and a southwest vortex will cause the precipitation to be greatly strengthened(Chen et al.,2004;Zhou et al.,2009;Huang et al.,2010;Tu and He,2010).
Many researchers have adopted data from different sources to investigate the formation,development,and eastward migration of TPVs(Cooperative Research Group of the Tibetan Plateau Low Systems,1978;Guo,1986;Yu and Gao,2006;He et al.,2009a;Wang Xin et al.,2009;Feng et al.,2014;Li Guoping et al.,2014).During 2010-2012,Institute of Plateau Meteorology of China Meteorological Administration(CMA)published the 1998-2011 Yearbook of TPVs and Shear Lines,which are authoritative data for TPV studies.Because of the sparse distribution of stations over the TP and thus insufficient observations,it is difficult to examine the track of a long-lived TPV traveling long distance over the region.Previous research has depended largely on general surveys of synoptic maps,with statistics related to TPVs based mainly on CMA-published historical charts,station-derived 500-hPa weather maps(Guo,1986;Yu and Gao,2006;Yu,2008;Wang Xin et al.,2009;He et al.,2009a;Institute of Plateau Meteorology of China Meteorological Administration,2011),or subjective surveys of reanalysis data(Li Guoping et al.,2014).Uncertainties may arise in studies of TPVs because of the subjective limitation of the survey work carried out by meteorologists.It is known that weather maps are not the source of data shared by all,and are unsuitable for comparisons between vortex and circulation data.
Therefore,currently,the only approach to objectively studying vortex characteristics is based on highresolution,long-duration reanalysis or general circulation model output data,for identification and longterm analyses of weather systems,e.g.,extratropical cyclones,tropical cyclones,or anticyclones(Hodges,1994;Sinclair,1997;Simmonds,2000;Wernli and Schwierz,2006;Wang Xinmin et al.,2009;Mesquita et al.,2010;Geng and Sugi,2011;Hanley and Caballero,2012).Lin et al.(2013)attempted to objectively identify TPVs that occurred in 2009 and discovered that recognition based on NCEP FNL(final)analysis data was close to that based on the Yearbook of TPVs and Shear Lines,thereby tentatively demonstrating the applicability of objective recognition.Limited by the volume of observations,Lin et al.(2013)and Feng et al.(2014)independently analyzed TPVs using different reanalysis sources.However,their identifications were based on short-period data,and they did not examine the TPVs'thermal characteristics.Thus,they were unable to completely reveal the features of these vortexes.In the present work,an in-depth exploration of the activities of TPVs is performed,based on the ECMWF Interim reanalysis(ERA-Interim)data for the period 1979-2013.
2.Data and methodology
2.1 Data
The ERA-Interim data(Dee et al.,2011)used in this study consist of 500-hPa height and humidity fields at 0200,0800,1400,and 2000 BT(Beijing Time)and the resolution of 1°(latitude)×1°(longitude). Compared to other kinds of reanalysis,ERA-Interim data are higher in resolution,have a longer time span,and are assimilated with considerable amount of satellite observations.Bao and Zhang(2013)compared ERA-Interim data with independent sounding observations from the Second Tibetan Meteorological Experiment in 1998 and noted that ERA-Interim is a far superior dataset,in terms of accuracy,than ERA-40(ECMWF 40-yr reanalysis),and is thus more applica-ble to vortex studies.The ECMWF's terrain data are also used,again with a resolution of 1°×1°.In this study,the terrain height of 3000 m is used as the geographic boundary for the TP(Fig.1).
2.2 TPV identification method
Based on the cyclone recognition scheme introduced by Wernli and Schwierz(2006)and the TPV identification criterion put forward by Lin et al.(2013),TPV recognition and tracking are performed at the 500-hPa height as follows:
(1)Scan all 500-hPa grid points,compare their 500-hPa geopotential height values,and identify those low(high)value points by judging whether the grid point height values are not less(more)than those of the surrounding 8 grid points.When the grid points are neighboring for some lows(highs),the mean position is taken over these points.
(2)Track the 5-gpm-spaced contours in the 500-hPa height field,in order to draw a family of all closed isolines of each low or high,i.e.,all closed contours that encompass all equal-valued points of the low or high. The maximum(minimum)contour of the low(high) is called the outermost closed contour(OCC),which defines the domain.Correspondingly,the minimum(maximum)isoline of the family acts as the innermost closed contour(ICC)of the low(high).
(3)Remove the grid points of the lows with no closed contours,because only the low appearing as a closed system is defined to be a low in the present study.This condition is imposed after Step(1)to eliminate false lows.Step(1)provides only a weaker condition for defining a low(Wernli and Schwierz,2006).If this is taken as the only means of identification,many lows would occur,a high number of which would be false systems at the synoptic level.Therefore,other conditions should be used to restrict this from happening.The other conditions include,for example,a threshold in the pressure difference between the low's grid points and surrounding counterparts(Wernli and Schwierz,2006),the relative vorticity threshold of lowcovered grid points(Haak and Ulbrich,1996),and the Laplace pressure threshold(Simmonds,2000).Now we restrict that around the low's grid points,there must be closed contours.This is in fact a synthesized threshold condition for the low-covered and ambientgrid points.
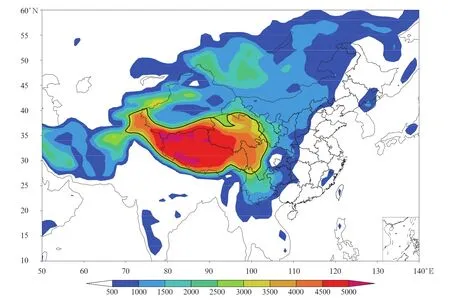
Fig.1.Topography of the TP.The heavy black line denotes the boundary of the TP and the coloring indicates the altitude(m)of the terrain.
(4)Employing the ICC center(mean location of all grid points on the ICC)as the core of the vortex would result in a more reasonable central position of the vortex in comparison to that based on the method by which the lowest-valued grid point is taken directly as the vortex's center(Hodges,1994;Simmonds,2000;Wernli and Schwierz,2006;Hanley and Caballero,2012),where the effects of the surrounding grid points are considered.
(5)Following the above steps,all low-pressure systems over the TP can be identified.The TPV is a near-surface meso system,with its spatial scale constrained within a certain range.We thus give the OCC-covered area larger than 10000 km2as its minimum domain size condition(Lin et al.,2013).Our experiments show that,without the area limitation,5250 vortexes would have been recorded for the TP during 1979-2013(annual mean of 150),among which many weak systems would have been included.Obviously,that would not be in accordance with meteorological practice.
(6)To eliminate the localized thermal lows over the TP,we set a condition that the persistence of the vortex has to be greater than three time intervals(inclusive).The data used are spaced six hourly,so our requirement contains at least two continued sounding intervals(0800 and 2000 BT),which is in accordance with the requirements for TPVs in routine meteorological forecast operation.
Following Lin et al. (2013),the difference in geopotential height between the vortex core(HL)and mean geopotential height over the same latitudes is defined as a parameter of TPV intensity.We define the intensity(I)to be-1 multiplied by the difference between the central HLand the mean geopotential height over 60°-120°E,i.e.,
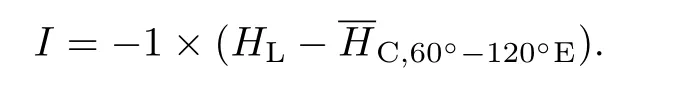
We can see that the greater the I is,the stronger the intensity of the TPV.Meanwhile,the intensity index can effectively eliminate the effects owing to the change in height produced by seasonal variation.
2.3 TPV tracking algorithm
Following Wernli and Schwierz(2006),we propose a simple tracking algorithm,dependent upon the inertia of the vortex's movement.The tracking is performed as follows:
(1)The vortex has the position Pt-1at the last time level(t-1).At the present time level(t),its position is Pt,and at the next time level the position isat the first guess position(FGP),which moves along
Then,at the next time level(t+1),the TPV's location is expected to be within D from the FGP.Wernli and Schwierz(2006)adopted D=1000 m,while Hanley and Caballero(2012)used a dynamic value for D:during the vortex's activity(12 h),D=500 m;otherwise,D=840 m.Our experiment shows the use of D=400 m to be good,producing the lowest level of wrong tracking.
(2)For a newly born TPV,no information on its position at the previous time(t-1)is available and its initial location is set to be the FGP.As the vortex enters the FGP-given D domain,where multiple lows are present,the system closest to the FGP is used.
2.4 Method for determining the thermal characteristics of a TPV
To determine the thermal characteristics of a TPV,some minor changes to the trough discrimination scheme proposed by Herrera et al.(2001)are made.Based on the modified scheme,Lin(2015)examined climate characteristics of the southern branch trough(also called the India-Burma trough),indicating good results in identifying quasi north-southdirection troughs.The scheme is now applied to the TPV cases with specific procedure given below.
Draw a minimal rectangle containing the OCC(denoted as R1 in Fig.2)for the vortex,and two same-sized rectangles on both sides of R1 at the same latitudes(R2 and R3).We denote the minimal longitude of all the grid points on the OCC as minlon,maximal longitude as maxlon,minimal latitude as minlat,and maximal latitude as maxlat.Then,the grid point at the bottom left of R1 is positioned at(minlat,minlon),and the top-right point is at(maxlat,maxlon). For R2,the grid point at the bottom left is located at(minlat,2×minlon-maxlon),while the point at the top right is at(maxlat,minlon).For R3,the grid point at the bottom left is at(minlat,maxlon),while the top-right point is at(maxlat,2×maxlon-minlon). The differences in mean temperature between R1,R2,and R3 are calculated as follows:
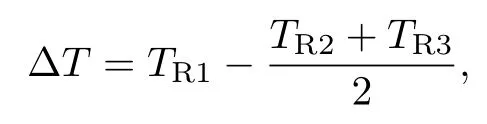
where TR1,TR2and TR3represent the temperature averaged over all grid points within R1,R2,and R3(see Fig.2),respectively.Evidently,with ΔT<0,the TPV is a cold trough(vortex),whereas for ΔT>0 the vortex is a warm ridge or warm vortex,and thus the TPV is warm.
3.Characteristics of TPV tracks
3.1 Brief description of TPV activities over the study region
According to their origins,the TPVs are divided into two classes:those coming from outside and those produced inside the TP region.The statistics show that,during 1979-2013,the number of external-source lows(under the restriction defined earlier)is 329(Fig. 3a),with an annual average of 9.4.The number of internal-source lows,meanwhile,is 1857(Fig.3b),with an annual mean of 53,indicating a predominance of the latter.The external-source lows act mostly at the outskirts of the TP,with only a few invading the interior.This can be explained well by the dynamics of the TP.When a low rises to move over the TP from lower levels,the air column is shortened and suffers a pressure increase.Subsequently,the vortex weakens to such an extent that it disintegrates(Ye and Gao,1979).In the present study,only internal-source vortexes are taken as TPVs;the other types are not taken into account.
Figure 3c shows the TPVs that move out of the TP.Their total number during the study period is 234,which equates to an annual average of 6.7.Most of the TPVs migrate out of the TP to the east or northeast,some traveling so far that they reach the vicinity of Japan.Some of the other TPVs,whose source is in the western TP,may leave the region to the west,reaching the Pamir Mountains.A further proportion,with their source in the southern TP,can migrate south-ward to reach the Indian Peninsula.In addition,a number of the TPV lows,with their source in the north,can migrate northward into southern Tibet.All of these TPVs,when leaving the TP,soon disappear in the area close to Tibet.Only a limited number TPVs migrate southwestward into Yunnan Province,and then even as far southward as the Indochina Peninsula.
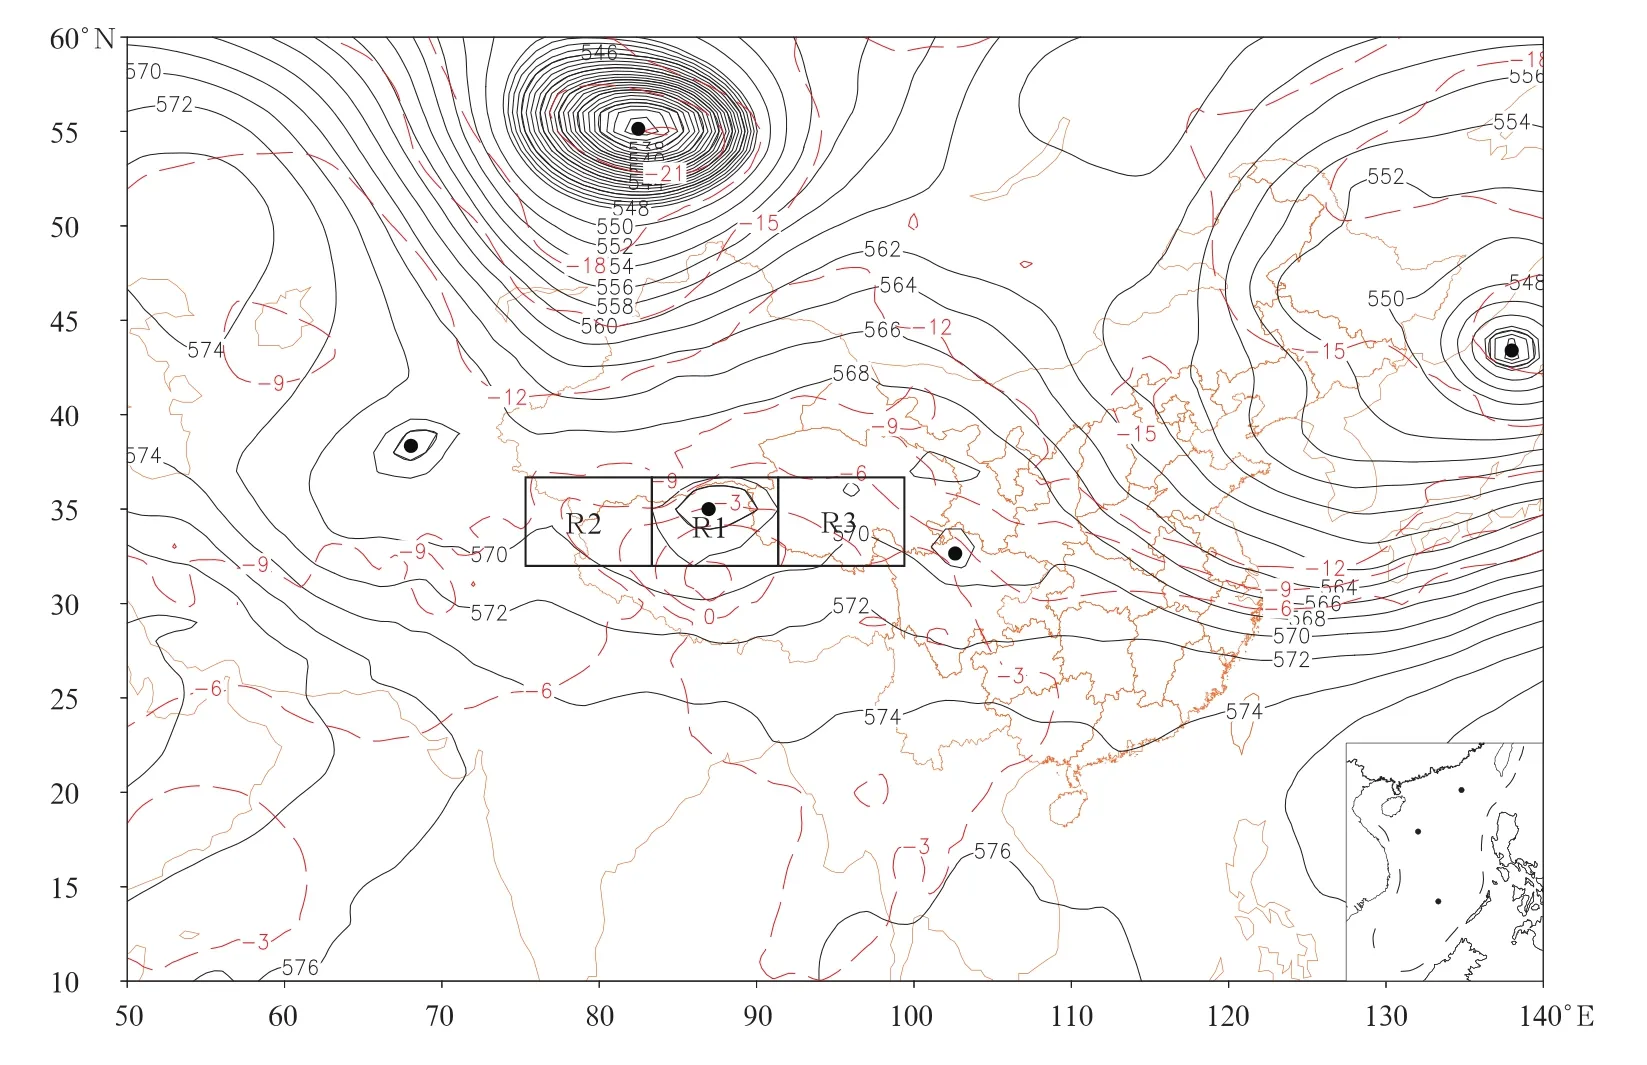
Fig.2.Objective discrimination of the thermal properties of a TPV.The dark black dot demotes the center of a low and the solid thin lines(500-hPa height contours)around the center represent a family of its contours,spaced at 0.5 dagpm;other solid thin lines away from the vortex center are spaced at 2 dagpm;the dotted lines are the temperature isolines at 3℃intervals;and the thick lines delimit the boxes for calculation.
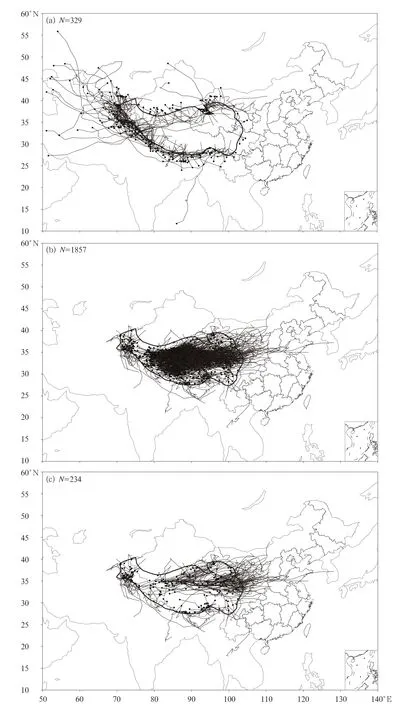
Fig.3.Statistical plot of TPV tracks:(a)external-source vortexes,(b)internal-source vortexes,and(c)outwardmigrating vortexes.
Many studies have been carried out concerning those vortexes that move northeast-,southeast-,and eastward(see Cooperative Research Group of the Tibetan Plateau Low Systems,1978;Lhasa Group of Tibetan Plateau Meteorology Research,1981;Liu and Fu,1986;Luo et al.,1993;Yu and Gao,2006;He et al.,2009a;Wang Xin et al.,2009;Li Guoping et al.,2014),but no reports on the TPVs that travel in other directions can be found in the literature.It is worth noting that,due to the dynamics of the TP,the lows that move out of the region should be invigorated in view of the lengthened air column and reduction in pressure.Therefore,the number of TPVs leaving the TP should be greater,considering the dynamics only -a fact that does not agree with the reality.This demonstrates that TPV development is more closely linked to the thermal conditions of the TP(Yu and Gao,2006;Yu et al.,2007,2008).Recently,Li et al.(2014b)demonstrated the differences in high-and low-level circulations and atmospheric heat sources between those TPVs migrating out and those remaining in situ,emphasizing the importance of latent heat release in the migration process.However,the thermal and dynamic roles played by the TP in outward vortex migration remain a problem to be solved.
3.2 Distribution of some TPV parameters
To reveal the general characteristics of TPVs,Fig.4 presents the frequencies of TPV persistence,strength,and thermal type(i.e.,cold/warm)at different intervals.In terms of persistence,the longer the TPV lifetime,the lower the frequency(Fig.4a). About 47%of TPVs persist for three time levels(18 h),and 64%(93%)last for under one day(two days),suggesting that TPVs are short-lived systems and few TPVs have long lifecycles.Based on the identification from ERA-Interim data,the maximum lifetime is 7.5 days,covering 30 time levels.This TPV generated at 2000 BT 6 August 1991 at the border between Northeast Tibet and Qinghai(32.3°N,97.41°E),after its genesis,it remained for about 24 h at its source,and then entered the western Sichuan.Next,it travelled southward along the border between Yunnan and Guizhou provinces into the Indochina Peninsula,and disappeared in central Myanmar(17.81°N,99.95°E)at 0200 BT 14 August 1991.
Figure 4b shows the frequencies of TPV intensity and central geopotential height.The intensity frequencies show a normal distribution,with the maximal frequencies of intensity ranging over 1.5-2.5 dagpm(making up 24%).Those TPVs with strength ranging over 0.5-6.5 dagpm account for 83.6%of the total. Also of note is that about 8.4%of the TPVs have astrength lower than 0,and they are so weak that they are higher compared to their surroundings(in terms of geopotential height).For instance,a TPV that generated at 1200 BT 27 October 1986,over the western part of the Ali region,was located at latitudes where there was a trough-ridge-trough weather pattern,with Tibet positioned under the ridge.In spite of the fact that the low had a central geopotential height of only 566 dagpm,which remained higher than the height of the trough zones on both sides,the TPV was so weak as to reach-5 dagpm.The strongest TPV emerged over the Pamir Mountains(32.19°N,77.06°E),west of Tibet,at 0800 BT 9 February 1981,and moved southeastward along the terrain of Southwest Tibet.In view of the fact that the TPV was in the saddle area between the Iranian high and western Pacific subtropical high,its intensity was more than 14 dagpm.
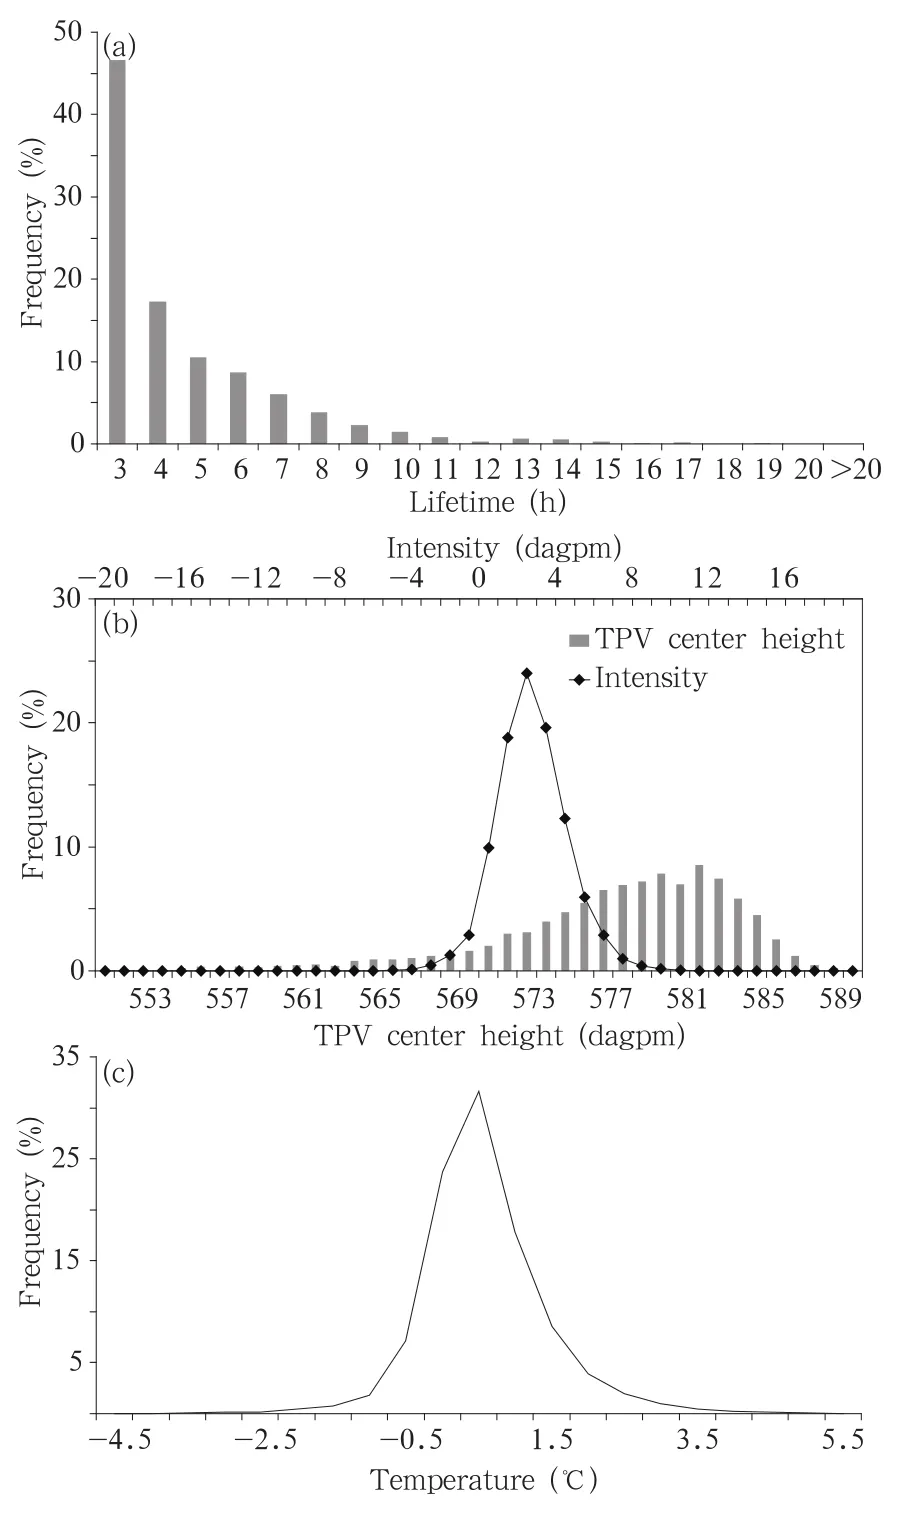
Fig.4.Frequencies of TPV(a)persistence,(b)intensity,and(c)thermal type(i.e.,cold/warm).
Compared to the frequencies of strength,the frequencies of central height also follow a normal distribution(figure omitted).The maximum frequencies of central height occur in the range over 581.5-582.5 dagpm,except that the frequencies vary gently(steeply)on the left(right)side.The central height values average 577.8 dagpm,and the smallest(largest)are 548.7(589.4)dagpm.The central height values of the TPVs fall between 570 and 585 dagpm,accounting for 85.7%of the total.The distribution of our central heights is similar to that of Li Lun et al.(2011)and Li et al.(2014b),but the values are lower than theirs,possibly due to the difference in the height values between the NCEP/NCAR reanalysis data that they employed and the ECMWF Interim reanalysis data that we used.
The frequencies of thermal type(i.e.,cold/warm properties)also follow a normal distribution(Fig.4c),with the most frequencies in the range 0°-0.5℃(32% of the total),followed by-0.5 to 0℃ (24%).Those TPVs within the range of-1 to 10℃make up 80%of the total.Most TPVs are situated in a weak trough or ridge area in the temperature field.About 34%(about 66%)of the TPVs are cold(warm).Moreover,examination of the initially generated TPVs shows about 81%(19%)of the TPVs to be warm(cold),in rough agreement with previous studies(Cooperative Research Group of the Tibetan Plateau Low Systems, 1978;Yu and Gao,2006;Wang Xin et al.,2009;Li Guoping et al.,2014).
4.Geographic distribution of TPVs
The sources(Fig.5a)and dispersal destinations(Fig.5b)of TPVs in the grid boxes,at a resolution of 1°(latitude)×1°(longitude),are analyzed statistically.The principal sources are in the western Nagqu and the northern Ngari.These sources derived in our research are in agreement with those centered on the counties ranging from Xainza to Gerze,obtained from the First Tibetan Meteorological Experiment(Lhasa Group of Tibetan Plateau Meteorology Research,1981).Further,they are in rough agreement with the conclusion of Lin et al.(2013)that the sources are in northwestern Tibet and northwestern Qinghai,and are also in concert with the 1981-2010 boreal summer vortex high-frequency cores reported by Li Guoping et al.(2014).Of the four high-frequency centers,the Songpan and northeastern Dege centers are of lower frequency,except the cores in northeastern Nagqu and the counties from Xainza to Gerze(Wang Xin et al.,2009).The aforementioned lower-frequency centers possibly occur because of the fact that(1)the sparse distribution of sounding stations over the western plateau provides limited observations,which makes the movement of vortexes based on these observations there hard to identify(Yu,2008;Wang Xin et al.,2009;Lin et al.,2013);and(2)the objective recognition scheme based on the reanalysis data is able to identify newly born TPVs in western Tibet,but the subjective analysis is not able to discriminates a newly born vortex until it has developed more robustly.Most TPVs are produced in an inverse triangular and broad area centered in Gerze County,covering Ngari Prefecture,central-western Nagqu,northwestern Qinghai,and western Xigaze region.For the part north of 36°of Qinghai Province,it is hard to detect any vortex genesis.There is low-frequency genesis of TPVs in the northern part of the western Sichuan Plateau,where Dege and Songpan are located.The lower-frequency vortex genesis areas are located in the south of the western Sichuan Plateau,Tibetan Nyingchi Prefecture,and the northwestern part of Yunnan.A small number of TPVs are produced over Kashmir to the southwest of the TP,in agreement with Region I of TPV genesis given by Lin et al.(2013),where the proportion of genesis is not so high as that in Lin et al.(2013).As shown in Fig.3c,some TPVs can easily move out of this region to the west.
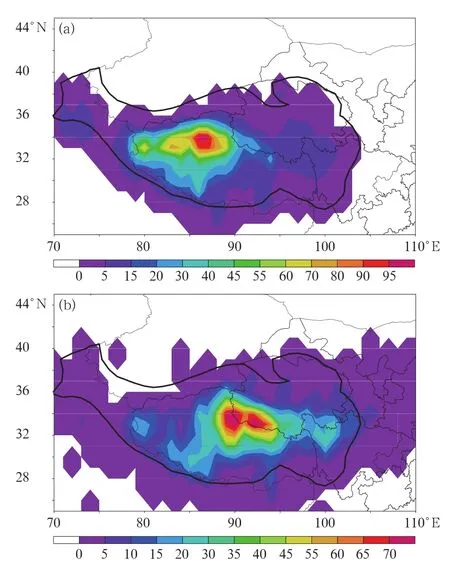
Fig.5.Distribution of the frequency of(a)source and(b)dispersal locations of TPVs.The frequency is given by number of vortexes within each 1°(latitude)×1°(longitude)box.
Figure 5b delineates the geographic distribution of the dispersal locations.Compared to the pattern of sources,the dispersion pattern shows a banded area of disintegration.The high-frequency dispersal centers are in the Tanggula Mountains,east of the source centers,and the Tangqu River valley in western Qinghai.Besides,a sub-high-frequency center emerges in the north of the Sichuan Plateau.The TPV-dispersal high-frequency area is east of the source,in close association with terrain.The dispersal high-frequency centers are situated in the vicinity of the Tanggular,Niqing Tanggula,and Gongdis Mountains,and subhigh-frequency centers are situated around the Bayankla Mountains and Grand Snow Mountains.It is not clear whether the blockings by these high mountains act as the main cause of vortex disintegration;further study using more data analysis and simulation is required.
5.Seasonal variation of TPVs
5.1 Frequency of TPVs emerging in the TP
Figure 6 presents the monthly mean number of TPVs and their persistence(time levels)during 1979-2013,revealing prominent inter-monthly features.The highest frequencies of TPVs occur in June and July,with a yearly average of 10.3,followed by May(9.6). This is in contrast to a mean of 0.3 for December and January.TPVs emerge largely in the rainy season(May-September),during which the number makes up 84%of the yearly total.As shown in Fig.6,the number of TPVs and their persistence are higher in April than in September.The distribution of the persistence is close to that of the vortex number.The number is largest during May-July,but the number in May is slightly smaller compared to that during June-July. The persistence,meanwhile,is the same in May as it is in June,and longer than in July-a result that is close to that reported in Lin et al.(2013).In terms of the mean persistence,vortexes in May(December)last longer than 5(less than 3.4)time levels,which are the extremes.
5.2 Monthly differences in the persistence and intensity of TPVs
As well as monthly variation in the frequency ofTPVs,their persistence and intensity also experience such changes(Fig.7).Different from the frequency,however,the mean persistence maximizes(minimizes)in May(December),reaching 30(20.7)h.On a seasonal basis,the mean spring(winter)persistence maximizes(minimizes),reaching 29.2(24)h,with 28.1(25.5)h in summer(autumn)in between.For the strength of the TPVs defined in this study,the effects of seasonal cycle-dependent geopotential height have been removed(Lin et al.,2013),thereby enabling us to reveal the intensity characteristics.The strength is positively correlated to the persistence,reaching a coefficient of 0.63-a result that is generally accepted. Under a similar circulation background,a high-intensity vortex will overcome adverse effects more easily and last longer,compared to a lowintensity vortex.The strength is greatest(least)in February(December),reaching 2.7(0.7)dagpm,with 2.5 dagpm in May.On a seasonal basis,TPVs are stronger(weaker)in summer(winter).This is perhaps because of the fact that,in summer,the TP serves as a heat source(Ye and Gao,1979),and the 500-hPa level is in the lower troposphere,which,under the influence of surface longwave heating,makes the air rise,causing the pressure to be lower there than in the surrounding areas.In addition,the Iranian high is strengthened in summer,enabling it to extend eastward,and the subtropical high is invigorated,to stretch westward. Once a vortex appears over the TP in between,a highvortex-high situation will occur,leading to a vortex of greater strength.
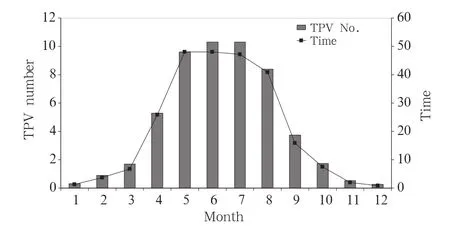
Fig.6.Monthly variation in the number and persistence of TPVs during 1979-2013.
5.3 Monthly differences in TPVs shifting out of the TP
Figure 8 depicts the number(monthly mean)of TPVs moving out of the TP and the ratio of these TPVs to the total number of TPVs,both showing a unimodal pattern.For genesis,the peak(valley)value is in May(January),with the outgoing number reaching 1.5(0.03)TPVs in May(January).But from the outgoing proportion,we see the maximum(minimum)in December(August),accounting for 33%(8%)of the total.The outgoing percentage is approximately 10% in June and July,although the number of TPVs gen-erated is the largest.In May,on the other hand,although the outgoing percentage is not so high(16%),the number of generated TPVs is rather large,causing the biggest number of outgoing TPVs.As seen from the sources(Fig.3c)of outgoing TPVs,TPVs move out more easily if the source is located in the TP fringe,or in its eastern part.
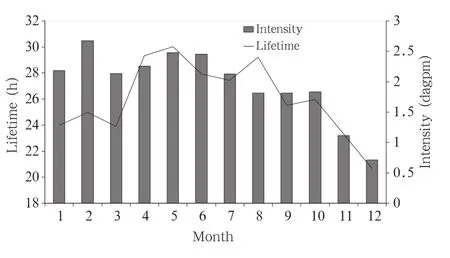
Fig.7.Monthly variation in the persistence and intensity of TPVs during 1979-2013.
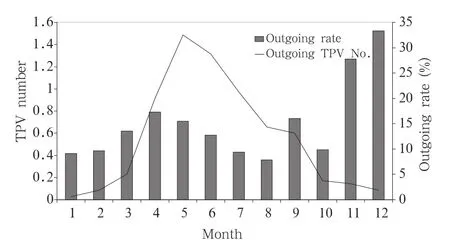
Fig.8.Monthly mean number of TPV geneses and the ratio of outgoing TPVs to total TPVs in the period 1979-2013.
6.Interannual variation of TPVs
6.1 Frequency of TPVs during 1979-2013
The interannual variation in the number of TPVs is shown in Fig. 9,revealing the annual number of internal-source TPVs to decrease non-significantly during the period 1979-2013.In spring,summer,autumn and winter,the climatological tendency reaches -0.7,-0.09,-0.8,and-0.2(10 yr)-1,respectively,failing to pass the significance test at the 0.1 level.The climatological tendency of annually-generated TPVs is -2(10 yr)-1.The largest(smallest)number is 69(29)TPVs in 2001(2009 and 2010).The yearly averagednumber of TPVs during 1979-2013 is 53.Although the trend is close to the statistics reported by Wang Xin et al.(2009),the annual number of TPVs differs from that presented in other studies,e.g.,the annual number of TPVs in 2009 is 53 in Lin et al.(2013),using NCEP FNL data,and 57 using the 2009 Yearbook of TPVs and Shear Lines(published in 2011).This is in sharp contrast to the value of 29 for 2009 presented in this work,possibly in relation to the model outcome based on reanalysis,and also the TPV criterion used.This problem needs to be investigated by considering numerical models with different resolutions,and reanalysis data in detailed comparisons.
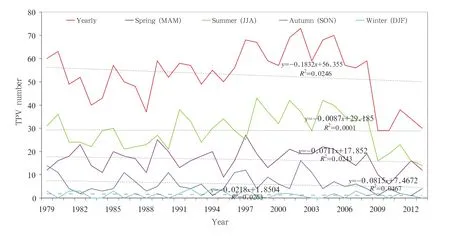
Fig.9.Interannual variation in the mean number of TPVs during 1979-2013.MAM(March-April-May),JJA(June-July-August),SON(September-October-November),and DJF(December-January-February).
6.2 Frequency of TPVs moving out of the TP
Figure 10 shows that the annual number of TPVs shifting out of the TP during 1979-2013 is,on average,6.7,maximizing at 16(28%of the yearly total)in 1992,in contrast to 1 in 2011 and 2013.Compared to the number of TPVs generated in this period,the number of outgoing TPVs from the TP decreases noticeably from 1979 onward,with a climatological tendency of -1.4 fewer vortexes per 10 years,significant at the 0.01 level.The number of outgoing TPVs is on the decrease on a seasonal basis,with the climatological tendency in spring,summer,autumn,and winter reaching-0.6,-0.4,-0.4,and-0.01(10 yr)-1,respectively.The figure for autumn passes the significance test at the 0.05 level,while those of the other seasons fail to pass at the 0.1 level.Both the number of TPVs produced over the TP and the number of outgoing ones experience a drop.Whether the reduced number of outgoing TPVs relates to the decrease in total vortexes generated over the TP is an interesting question.To answer it,the ratio of outgoing TPVs to total TPVs is calculated on an annual basis,and the interannual variation in the percentage of outgoing TPVs is examined(Fig.10b). We find that the ratio presents a distinct decrease during 1979-2013,with a tendency of-2.3%(10 yr)-1. The ratio also exhibits a remarkable interannual variation,minimizing(maximizing)at less than 5%(28%)in 2011(1992)and averaging at 13%over this period,a statistical value that is in good agreement with that reported by others(Liu and Fu,1986;Yu et al.,2007,2012;Wang Xin et al.,2009;Li Guoping et al.,2014).
7.Conclusions and discussion
Using ERA-Interim data,objective recognition and tracking of TPVs is conducted in this study for the period 1979-2013,and their thermal status is also defined by using an objective scheme.The following conclusions can be drawn:
(1)During the study period,the number of exter-nal-source vortexes is 329,with an annual mean of 9.4. The number of internal-source TPVs is 1857,averaging 53 annually.A total of 234 of these 1857 TPVs moved out of the TP,averaging about 6.7 on a yearly basis,and their outgoing movement can be grouped into four main directions,but especially the east.
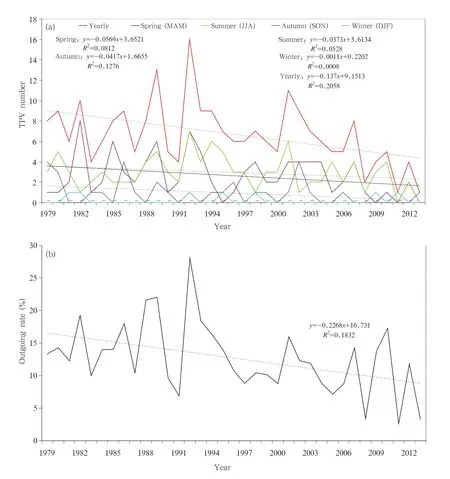
Fig.10.(a)Annual number of outgoing internal-source TPVs(season abbreviations as in Fig.9a)and(b)annual ratio of outgoing TPVs to total TPVs during 1979-2013.
(2)TPVs persist for 18-180 h,with an 18-h duration happening most frequently.The intensities lie from-5 to 14 dagpm (normal distribution),mostly between 1.5 and 2.5 dagpm.The initially warm TPVs are predominant.The internal-source TPVs largely originate in the western part of Nagqu and northern Ngari,and the dispersal areas are predominantly in the Tanggula Mountains,east of the high-frequency center of the source,and the Dangqu River valley in western Qinghai.TPVs occur mainly in summer,with a limited number happening in winter.The outgoing TPVs maximize(minimize)in May(January).Their strength(persistence)is stronger(longer)in springsummer than in autumn-winter.
(3)During the study period,the frequency of internal-source TPVs exhibits a non-significant decrease,but the number of outgoing TPVs and the ratio to total TPVs decrease noticeably and significantly.The climatological tendency of the outgoingnumber is-1.4(10 yr)-1,statistically significant at the 0.01 level,and the tendency(rate of decrease)of the percentage of outgoing TPVs reaches-2.3%(10 yr)-1.
The results of the present study show that the chosen reanalysis and objective scheme are feasible in revealing the activities of internal-source TPVs. Because of the lack of a general criterion for determining the existence of TPVs from the reanalysis data,an objective identification scheme is proposed,but improvements are still needed.Whether such a criterion is applicable depends on detailed comparison between the objective recognition and the yearbook data.What effects the TP thermodynamic factors have upon the genesis/development of TPVs will be examined in future work,based on reanalysis data and the TPV dataset derived herein.The results obtained should be reliable because the reanalysis data and the data derived by this study are consistent.The identification results would be different if different reanalysis datasets at different resolutions are employed.Other questions that remain to be addressed include:Why is the percentage of outgoing TPVs very low? What changes happen to the properties and structure of a TPV when it is displaced out of the TP?Are the changes in the number of TPVs,particularly the outgoing TPVs,related to the climate background?Will global warming-related surface air temperature rises over the TP have an effect upon the genesis/development and(thermal)structure of TPVs?Finally,TPVs are responsible for extremely large discrepancies in precipitation over the TP,causing low predictability of rainfall areas and intensity. This is a key point in operational weather forecasting in the TP region,and is the direction of our future research efforts.
Acknowledgments.The author is grateful to the anonymous reviewers for their constructive comments and suggestions,and to the editors for their assistance.Special thanks go to Colin Smith,who has greatly improved the language quality of this paper.
Bao,X.H.,and F.Q.Zhang,2013:Evaluation of NCEPCFSR,NCEP-NCAR,ERA-Interim,and ERA-40 reanalysis datasets against independent sounding observations over the Tibetan Plateau.J.Climate,26,206-214.
Chen Gong and Li Guoping,2011:Characteristics of the tangential flow field of the Tibetan Plateau vortices and associated waves.Acta Meteor. Sinica,69,956-963.(in Chinese)
Chen Qian,1964:Synoptic and climatic characteristics of the Tibetan Plateau 500-hPa vortex.Technical Reports of Lanzhou Conference of Synoptic Meteorology,127-129.(in Chinese)
Chen Zhongming,Min Wenbin,Miao Qiang,et al.,2004:A case study on coupling interaction between plateau and southwest vortexes.Plateau Meteor.,23,75-80.(in Chinese)
Cooperative Research Group of the Tibetan Plateau Low Systems,1978:The research on the development of the Tibetan Plateau vortex in midsummer.Sci. China,8,341-350.(in Chinese)
Dee,D.P.,S.M.Uppala,A.J.Simmons,et al.,2011:The ERA-Interim reanalysis:Configuration and performance of the data assimilation system.Quart.J. Roy.Meteor.Soc.,137,553-597.
Feng,X.Y.,C.H.Liu,R.Rasmussen,et al.,2014:A 10-yr climatology of Tibetan Plateau vortices with NCEP Climate Forecast System reanalysis.J.Appl. Meteor.Climatol.,53,34-46.
Geng,Q.Z.,and M.Sugi,2001:Variability of the North Atlantic cyclone activity in winter analyzed from NCEP-NCAR reanalysis data. J.Climate,14,3863-3873.
Guo Mianzao,1986:A preliminary survey of the low vortex over the Tibetan Plateau in summer.Plateau Meteor.,5,184-188.(in Chinese)
Haak,U.,and U.Ulbrich,1996:Verification of an objective cyclone climatology for the North Atlantic. Meteor.Z.,5,24-30.
Hanley,J.,and R.Caballero,2012:Objective identification and tracking of multicentre cyclones in the ERA-Interim reanalysis dataset.Quart.J.Roy. Meteor.Soc.,138,612-625.
He Guangbi,Gao Wenliang,and Tu Nini,2009a:The dynamic diagnosis on eastward moving characteristics and developing mechanism of two Tibetan Plateau vortex processes.Acta Meteor.Sinica,67,599-612.(in Chinese)
He Guangbi,Gao Wenliang,and Tu Nini,2009b:The observational analysis of shear line and low vortex over the Tibetan Plateau in summer from 2000 to 2007.Plateau Meteor.,28,549-555.(in Chinese)
Herrera,R.G.,D.G.Puyol,E.H.Mart´ın,et al.,2001:Influence of the North Atlantic Oscillation on the Canary Islands precipitation.J.Climate,14,3889-3903.
Hodges,K.I.,1994:A general method for tracking analysis and its application to meteorological data.Mon. Wea.Rev.,122,2573-2586.
Huang Chuhui,Gu Qingyuan,Li Guoping,et al.,2010:Mechanism analysis of plateau vortex moving east trigger rainstorm in Sichuan basin.Plateau Meteor.,29,832-839.(in Chinese)
Institute of Plateau Meteorology of China Meteorological Administration,2011:Tibetan Plateau Vortex and Shear Line Yearbooks(2009).China Meteorological Press,Beijing,23-96.(in Chinese)
Lhasa Group of Tibetan Plateau Meteorology Research,1981:Research of 500-mb Vortex and Shear Lines over the Tibetan Plateau in Summer.Science Press,Beijing,341-348.(in Chinese)
Li,L.,R.H.Zhang,and M.Wen,2014a:Diurnal variation in the occurrence frequency of the Tibetan Plateau vortices.Meteor.Atmos.Phys.,125,135-144.
Li,L.,R.H.Zhang,M.Wen,et al.,2014b:Effect of the atmospheric heat source on the development and eastward movement of the Tibetan Plateau vortices. Tellus A,66,24451,doi:10.3402/tellusa.v66.24451.
Li Guoping,2007:Dynamic Meteorology of the Tibetan Plateau.2nd Edition,China Meteorological Press,Beijing,31-35.(in Chinese)
Li Guoping and Jiang Jing,2000:A type of singular solitary wave and its application of structure analysis of the Tibetan Plateau vortex.Acta Meteor.Sinica,58,447-456.(in Chinese)
Li Guoping and Xu Qi,2005:Effect of dynamic pumping in the boundary layer on the Tibetan Plateau vortices.Chinese J.Atmos.Sci.,29,965-972.(in Chinese)
Li Guoping,Luo Xiping,Chen Ting,et al.,2011:Preliminary theoretical study of cyclonic waves in the Tibetan Plateau vortex.Plateau Meteor.,30,553-558.(in Chinese)
Li Guoping,Zhao Fuhu,Huang Chuhui,et al.,2014:Analysis of 30-year climatology of the Tibetan Plateau vortex in summer with NCEP reanalysis data.Chinese J.Atmos.Sci.,38,756-769.(in Chinese)
Li Lun,Zhang Renhe,and Wen Min,2011:Diagnostic analysis of the evolution mechanism for a vortex over the Tibetan Plateau in June 2008.Adv.Atmos.Sci.,28,797-808.
Lin Zhiqiang,2015:Objective identify method and climatic characteristics of Southern Branch Trough. Plateau Meteor.,34,684-689.(in chinese)
Lin Zhiqiang,Zhou Zhenbo,and Jia La,2013:Objective identifying method of Qinghai-Xizang Plateau vortex using NCEP/NCAR reanalysis dataset.Plateau Meteor.,32,1580-1588.(in Chinese)
Lin Zhiqiang,De Qing,Wen Shengjun,et al.,2014a:Spatio-temporal distribution and general circulation of heavy rainfall in rainy season over Tibetan Plateau.Torrential Rain and Disasters,33,73-79.(in Chinese)
Lin Zhiqiang,Jia La,Xue Gaiping,et al.,2014b:Spatialtemporal distribution and general circulation of heavy snow over Tibetan Plateau in 1980-2010. Plateau Meteor.,33,900-906.(in Chinese)
Liu Fuming and Fu Meijuan,1986:A study on the moving eastward lows over Qinghai-Xizang Plateau. Plateau Meteor.,5,125-134.(in Chinese)
Luo Siwei,1992:Research of Several Synoptic Systems over Tibetan Plateau and Nearby Areas.China Meteorological Press,Beijing,7-13.(in Chinese)
Luo Siwei,He Meilan,and Liu Xiaodong,1993:Research on the Tibetan Plateau vortex.Sci.China(Ser. B),23,778-784.(in Chinese)
Mesquita,M.S.,D.E.Atkinson,and K.I.Hodges,2010:Characteristics and variability of storm tracks in the North Pacific,Bering Sea,and Alaska.J.Climate,23,294-311.
Simmonds,I.,2000:Size changes over the life of sea level cyclones in the NCEP reanalysis.Mon.Wea.Rev.,128,4118-4125.
Sinclair,R.M.,1997:Objective identification of cyclones and their circulation intensity,and climatology.Wea.Forecasting,12,595-612.
Tu Nini and He Guangbi,2010:Case analysis on two low vortexes induced by Tibetan Plateau shear line. Plateau Meteor.,29,90-98.(in Chinese)
Wang Xin,Li Yueqing,Yu Shuhua,et al.,2009:Statistical study on the plateau low vortex activities. Plateau Meteor.,28,64-71.(in Chinese)
Wang Xinmin,Zhai Panmao,and Wang Cuicui,2009:Variations in extratropical cyclone activity in northern East Asia.Adv.Atmos.Sci.,26,471-479.
Wernli,H.,and C.Schwierz,2006:Surface cyclones in the ERA40 dataset(1958-2001).Part I:Novel identification method and global climatology.J.Atmos. Sci.,63,2486-2507.
Wu Yongsen,1964:A preliminary study on the plateau vortex of 500 hPa in summer.Papers of Qinghai Provincial Meteorological Conference,18-19. (in Chinese)
Ye Duzheng and Gao Youxi,1979:The Qinghai-Xizang Plateau Meteorology.Science Press,Beijing,112-134.(in Chinese)
Yu Shuhua,2008:New research advances of the Tibetan Plateau vortex in summer.Torrential Rain and Disasters,27,367-372.(in Chinese)
Yu Shuhua and Gao Wenliang,2006:Observational analysis on the movement of vortices before/after moving out the Tibetan Plateau.Acta Meteor.Sinica,64,392-399.(in Chinese)
Yu Shuhua,Xiao Yuhua,and Gao Wenliang,2007:Cold air influence on the Tibetan Plateau vortex moving out of the plateau.Chinese J.Appl.Meteor.Sci.,18,737-747.(in Chinese)
Yu Shuhua,Gao Wenliang,and Xiao Yuhua,2008:Analysis for the influence of cold air mass on two cases of plateau vortex moving out of the Tibetan Plateau. Plateau Meteor.,27,96-103.(in Chinese)
Yu Shuhua,Gao Wenliang,and Peng Jun,2012:Statistical analysis on influence of Qinghai-Xizang Plateau vortex activity on precipitation in China.Plateau Meteor.,31,592-604.(in Chinese)
Yu Shuhua,Gao Wenliang,Peng Jun,et al.,2014:Observational facts of sustained departure plateau vortexes.J.Meteor.Res.,28,296-307,doi:10.1007/ s13351-014-3023-9.
Zhang Pengfei,Li Guoping,Wang Minyan,et al.,2010:Preliminary study on the relationship between clustering activity of Tibetan Plateau vortex and 10-30 day low-frequency oscillations.Plateau Meteor.,29,1102-1110.(in Chinese)
Zhou Chunhua,Gu Qingyuan,and He Guangbi,2009:Diagnostic analysis of vorticity in a heavy rain event under interaction of plateau vortex and southwest vortex.Meteor.Sci.Technol.,37,538-544.(in Chinese)
Lin Zhiqiang,2015:Analysis of Tibetan Plateau vortex activities using ERA-Interim data for the period 1979-2013.J.Meteor.Res.,29(5),720-734,
10.1007/s13351-015-4273-x.
Supported by the China Meteorological Administration Special Public Welfare Research Fund(GYHY201106005)and Arid Climate Science Research Fund(AM201310).
∗Corresponding author:linzq82@gmail.com.
©The Chinese Meteorological Society and Springer-Verlag Berlin Heidelberg 2015
猜你喜欢
杂志排行
Journal of Meteorological Research的其它文章
- Characterization of Drought and Its Assessment over Sindh,Pakistan During 1951-2010
- Validation of the Modified Becker's Split-Window Approach for Retrieving Land Surface Temperature from AVHRR
- Modification of Cumulus Convection and Planetary Boundary Layer Schemes in the GRAPES Global Model
- Dust Aerosol Effects on Cirrus and Altocumulus Clouds in Northwest China
- Cloud Radiative Forcing Induced by Layered Clouds and Associated Impact on the Atmospheric Heating Rate
- A New Evaporation Duct Climatology over the South China Sea