Cloud Radiative Forcing Induced by Layered Clouds and Associated Impact on the Atmospheric Heating Rate
2015-11-21LUQiaoyi吕巧谊LIJiming李积明WANGTianhe王天河andHUANGJianping黄建平
LU¨ Qiaoyi(吕巧谊),LI Jiming(李积明),WANG Tianhe(王天河),and HUANG Jianping(黄建平)
Department of Atmospheric Sciences,Lanzhou University,Lanzhou 730000
Cloud Radiative Forcing Induced by Layered Clouds and Associated Impact on the Atmospheric Heating Rate
LU¨ Qiaoyi(吕巧谊),LI Jiming(李积明),WANG Tianhe(王天河),and HUANG Jianping∗(黄建平)
Department of Atmospheric Sciences,Lanzhou University,Lanzhou 730000
A quantitative analysis of cloud fraction,cloud radiative forcing,and cloud radiative heating rate(CRH)of the single-layered cloud(SLC)and the multi-layered cloud(MLC),and their differences is presented,based on the 2B-CLDCLASS-LIDAR and 2B-FLXHR-LIDAR products on the global scale.The CRH at a given atmospheric level is defined as the cloudy minus clear-sky radiative heating rate.The statistical results show that the globally averaged cloud fraction of the MLC(24.9%),which is primarily prevalent in equatorial regions,is smaller than that of the SLC(46.6%).The globally averaged net radiative forcings(NET CRFs)induced by the SLC(MLC)at the top and bottom of the atmosphere(TOA and BOA)and in the atmosphere(ATM)are-60.8(-40.9),-67.5(-49.6),and 6.6(8.7)W m-2,respectively,where the MLC contributes approximately 40.2%,42.4%,and 57%to the NET CRF at the TOA,BOA,and in the ATM,respectively.The MLC exhibits distinct differences to the SLC in terms of CRH.The shortwave CRH of the SLC(MLC)reaches a heating peak at 9.75(7.5)km,with a value of 0.35(0.60)K day-1,and the differences between SLC and MLC transform from positive to negative with increasing altitude.However,the longwave CRH of the SLC(MLC)reaches a cooling peak at 2(8)km,with a value of-0.45(-0.42)K day-1,and the differences transform from negative to positive with increasing altitude.In general,the NET CRH differences between SLC and MLC are negative below 7.5 km.These results provide an observational basis for the assessment and improvement of the cloud parameterization schemes in global models.
single-layered cloud,multi-layered cloud,cloud fraction,cloud radiative forcing,cloud radiative heating rate
1.Introduction
As an important modulator of the global radiation energy budget,clouds change the atmospheric heating rate via their various macro-and micro-characteristics,and thus further affect atmospheric circulation and the water cycle(Hartmann et al.,1992;Wang and Zhao,1994;Zhao and Wang,1994;Wang et al.,2007).Cloud radiative effects and climate feedbacks have been a research topic of significant interest.A large number of studies demonstrated that cloud property discrepancies among various climate model simulations would produce significantly contrasting results.Indeed,clouds are one of the largest sources of uncertainty in climate change projections(Cess et al.,1989;Wang and Ding,2005;Zhang and Jing,2010;Zhang et al.,2010).
Previous studies have revealed that variations in radiative effects of different cloud types are significant. Optically thin and high clouds exhibit greenhouse effects,whereas low clouds exhibit cooling effects(Chen et al.,2000).Due to observational data and radiative transfer model limitations,most studies simply focused on the single-layered cloud(SLC)and neglected uncertainties introduced by the presence of the multilayered cloud (MLC),which isdefined as two or more cloud layers in the same atmospheric column. However,an increasing number of researchers haveindicated that the MLC cannot be ignored.For example,ground,aircraft,and satellite observations suggest that the MLC is so ubiquitous that it accounts for 40% of the total clouds(Tian and Curry,1989;Huang et al.,2005,2006b;Wang and Dessler,2006;Wang and Min,2008;Li et al.,2009;Wang and Huang,2009;Wang et al.,2011;Peng et al.,2013).Li et al.(2009)utilized the CALIPSO satellite data and found that the MLC occurrence frequency reaches 43.6%during summer in East Asia.Based on two decades of ground-based observations,Wang et al.(2000)concluded that the occurrence frequency of two-layered clouds can account for 42%of the total clouds.Moreover,the interactions among cloud layers of the MLC can change the radiation fluxes at the top and bottom of the atmosphere(TOA and BOA).These interactions also affect the atmospheric heating rate,causing strengthened or weakened regional atmospheric circulation(Chen and Cotton,1987;Liang and Wu,2005;Huang et al.,2006a;Zhang et al.,2013).Morcrette and Jakob(2000)found that the simulated emitted longwave radiation fluxes based on different cloud overlap schemes would lead to large contrast of up to 40 W m-2.In addition,Li et al.(2011)quantified cloud radiative forcing induced by the SLC and the MLC in overcast conditions and confirmed their distinct impacts on the radiation balance at the TOA and BOA by combining active and passive remote data.Moreover,in a recent study performed by Christensen et al.(2013),the MLC led to complex vertical radiation distributions in the atmosphere.For example,the infrared radiative heating induced by the base of high clouds can weaken the infrared cooling effect at the top of low clouds in an MLC composed of both high and low clouds.
Supported by the National(Key)Basic Research and Development(973)Program of China(2012CB955301),Key Program of the National Natural Science Foundation of China(41430425 and 41205015),and China 111 Project(B13045).
∗Corresponding author:hjp@lzu.edu.cn.
©The Chinese Meteorological Society and Springer-Verlag Berlin Heidelberg 2015
Due to sparse ground observations and limitations in spaceborne passive remote sensing methods,it is difficult to determine the vertical distribution of clouds on the global scale(Chen et al.,2006).Consequently,studies associated with the MLC halted(Minnis et al.,2007;Chen et al.,2008;Min et al.,2008;Wang et al.,2010;Haynes et al.,2011;Zhang et al.,2015).Fortunately,NASA and the French Space Agency(CNES)jointly launched the CALIPSO and CloudSat satellites in 2006.These satellites eventually enabled the initiation of MLC research and provided valuable observations for in-depth studies of global cloud overlap and associated radiative effects.The polarization lidar(CALIOP)aboard CALIPSO can detect optically thin clouds with a high sensitivity while its signals are attenuated upon penetrating thick clouds.By contrast,cloud radar(CPR)mounted on CloudSat is capable of penetrating thick clouds and is more sensitive at detecting large particles.However,CPR fails to detect optically thin clouds and can be significantly affected by ground clutter.Because the two satellites can converge on the same location within approximately 15 s,it is possible to combine complementary measurements from CALIOP and CPR.Overall,a more accurate vertical structure of cloud characteristics can be obtained,which is also used as input for radiative transfer models to calculate more reliable radiation fluxes induced by clouds.
The paper presents a detailed global investigation of cloud fraction,cloud radiative forcing(CRF),and cloud radiative heating rate(CRH)of the SLC and MLC,as well as their differences,by applying the 2B-CLDCLASS-LIDAR and 2B-FLXHR-LIDAR products on the global scale.Detailed definitions of CRF and CRH will be introduced in the subsequent sections.In general,the quantitative results from this study will provide an observational basis for assessment and improvement of the cloud parameterization schemes in global climate models,and also a necessary research base for understanding the global cloud radiative feedback mechanism.
2.Data
The study uses the latest 2B-CLDCLASS-LIDAR and 2B-FLXHR-LIDAR products(2007-2010),which include the combined measurements from CALIPSO and CloudSat,to provide statistical analysis of the SLC and MLC cloud fractions,as well as their CRFs and CRHs on the global scale.Note that only the instantaneous daytime data are employed and the time when satellites pass cross the equator is approximately 1330 LT(local time).All the data used in this study were acquired through the CloudSat Data ProcessingCenter at http://www.cloudsat.cira.colostate.edu.
According to the cloud top pressure and cloud optical depth,the International Satellite Cloud Climatology Project(ISCCP)classifies clouds into varied cloud types.The algorithm proposed by Wang and Sassen(2007),based on 2B-CLDCLASS-LIDAR products,divides clouds into eight categories,i.e.,high clouds,altostratus,altocumulus,stratus,stratocumulus,cumulus,nimbostratus,and deep convective clouds.The algorithm employs the threshold method and the theory of fuzzy classification together when processing data to acquire more representative cloud types.Moreover,2B-CLDCLASS-LIDAR has the advantage of combining CPR and CALIOP measurements for optical thin clouds,which are undetected by the CloudSat,and optical thick clouds,which are undetected by the CALIPSO.Therefore,each cloud type can be simultaneously detected.A complete and accurate vertical cloud structure can be obtained with a high resolution of 240 m.CALIPSO is unaffected by ground clutter,thus the bias introduced by low cloud bases near the surface via CloudSat is avoided.Mace et al.(2007)demonstrated that the accuracy of cloud layer detection via the complementary measurements of CALIPSO and CloudSat can reach 90%on the global scale.2B-CLDCLASS-LIDAR has been utilized to conduct a series of studies,including those focused on cloud macro-and micro-property distributions.They further confirmed the applicability of the product on the local and global scales(Hu et al.,2010;Ding et al.,2012;Fu,2014;Liu et al.,2014).In this paper,we utilize several 2B-CLDCLASS-LIDAR parameters,including the number of cloud layers and cloud fraction.We define the scenario as clear sky when cloud layer number is zero.We define the SLC(MLC)when cloud layer number and cloud fraction values are 1(≥2)and 100%,respectively.
The2B-FLXHR-LIDAR productemploysa broadband,two-stream radiative transfer model to calculate the atmospheric radiation flux and heating rate at each discrete atmospheric level in the algorithm. First,input data needed for the radiative transfer model include the ECMWF reanalysis data and the CloudSat products such as 2B-LWC,2B-IWC, 2C-Precip-Cloumn,and surface albedos obtained from seasonally varying surface reflectance maps.The general framework and detailed parameterizations in the algorithm have been described by Ritter and Geleyn(1992)and Stephens et al.(2001).Moreover,L'Ecuyer et al.(2008)utilized Cloud and Earth Radiance Energy System(CERES)data to estimate 2B-FLXHR product uncertainties.They concluded that outgoing longwave radiative fluxes are better represented than shortwave fluxes,but both exhibit good agreement with CERES on scales longer than 5 days and larger than the grid resolution of 5°.However,uncertainties linked to thin cirrus and low clouds,which are obscured by ground clutter,must be addressed. As a consequence,incorporating CALIPSO cloud observations that are undetected by the CloudSat 2BFLXHR-LIDAR product significantly improve the 2BFLXHR product.Henderson et al.(2013)suggested that the 2B-FLXHR-LIDAR product correlated well with CERES radiative fluxes,based on monthly averages on a 5°×5°grid,with biases of 4 and 5 W m-2and root mean square errors of 16 and 6 W m-2,for shortwave and longwave radiative flux respectively. In addition,the product provides high-resolution atmospheric heating rate profiles,which have been used by L'Ecuyer(2007).Haynes et al.(2013)demonstrated that this high-resolution dataset outperforms the passive,low-resolution sensor data,and reduces the errors introduced by cloud base height ambiguities and the presence of the MLC.In addition,it is suggested that further study be conducted regarding the impact of the MLC on atmospheric heating rates. In the present study,the product variables,including the radiative heating profile(QR)and cloud radiative forcing at the TOA and BOA(TOACRE,BOACRE),are utilized to assess the different radiative impacts of the SLC and MLC on the earth-atmosphere system radiation budget.
3.Global distribution of cloud fraction
The relationship between the earth radiation budget or surface radiation budget and total cloud fraction has been studied for decades(Fung et al.,1984;Hart-mann et al.,1986;Rossow and Lacis,1990).Hartmann et al.(1992)demonstrated that the net radiative effect of low clouds changed by-0.63 W m-2if the cloud fraction increased by 1%.Moreover,a low cloud fraction increase of 4%or stratus cloud droplet effective radius decrease from 20 to 16µm can offset the warming effect caused by doubling the carbon dioxide concentration(Randall et al.,1984;Slingo,1990). Thus,in this section,the SLC and MLC cloud fractions were statistically analyzed in detail firstly.
Figure 1 shows the global distributions of SLC and MLC cloud fractions,as well as their difference. Different colors correspond to various levels of cloudiness.Based on the definition of Li et al.(2011),all samples were first averaged on a 2°×2°grid.Then,the cloud fraction was defined as the number of SLC(MLC)cloudy profiles divided by the total number of sample profiles collected in a given grid box.The global cloud fraction distributions of the SLC,MLC,and their difference are then mapped.
Figure 1a illustrates that the SLC cloud fraction is greatest over the Tibetan Plateau as well as the west coasts of America,southern Africa,and Australia,where the smallest MLC cloud fraction is present. Yuan and Oreopoulos(2013)concluded that the MLC,which is composed of low and high clouds,occurs more frequently in the tropics than in the subtropics(subsidence areas),and the overlap rate is negatively correlated with subsidence rate.Similarly,Fig. 1b illustrates that the MLC cloud fraction is greatest over tropical and subtropical regions,such as northern South America,central Indian,and the warm pool of western Pacific,where the value can reach 50%. Moreover,the tropical sea surface temperature and the storm tracks in mid-high latitudes can be key factors affecting MLC formation(Behrangi et al.,2012).Consequently,over the midlatitude storm tracks,the MLC cloud fraction ranges from 20%to 40%.The MLC cloud fraction is smallest in arid,semi-arid,and subsidence regions near 30°N and 30°S,which are dominated by the sinking branch of the Hadley circulation. In addition,the MLC cloud fraction barely occurs over Greenland and the South Pole.In the tropics,the MLC cloud fraction is larger than the SLC,reaching a difference of 20%in the western Pacific,central Africa,and northern South America(Fig.1c).However,in subsidence areas,the MLC cloud fraction is less than the SLC cloud fraction.Although the MLC cloud fraction ranges from 20%to 40%in mid-high latitudes,the cloud fraction difference between MLC and SLC remains distinct because of a total cloud fraction above 80%,as demonstrated by previous studies(Chen et al.,2000;Haynes et al.,2011;Li et al.,2011).In the present study,the globally averaged cloud fractions of SLC and MLC can reach 46.6%and 24.9%,respectively,which are in accordance with the results of Li et al.(2011).
4.Global distribution of CRF
Differences in cloud fraction and cloud vertical distribution between the SLC and MLC inevitably influence their radiative fluxes at the TOA,BOA,and in the ATM.In addition,they may further modify the atmospheric circulation and water vapor transport(Huang et al.,2006c;Su et al.,2008). Based on the definition of Li et al. (2015),the SLC(MLC)CRF is defined as cloud fraction multiplied by the overcast cloud radiative forcing on a 2°×2°grid when considering the impacts of cloudfraction differences between the SLC and MLC.The overcast cloud radiative forcing is averaged from the selected profiles of which the cloud fraction equals 100%at the fixed grid.Note that the CRF in the ATM is defined as the difference between the CRF at the TOA and BOA.The positive(negative)values of CRF indicate the heating effect(cooling effect)on the atmosphere induced by clouds.
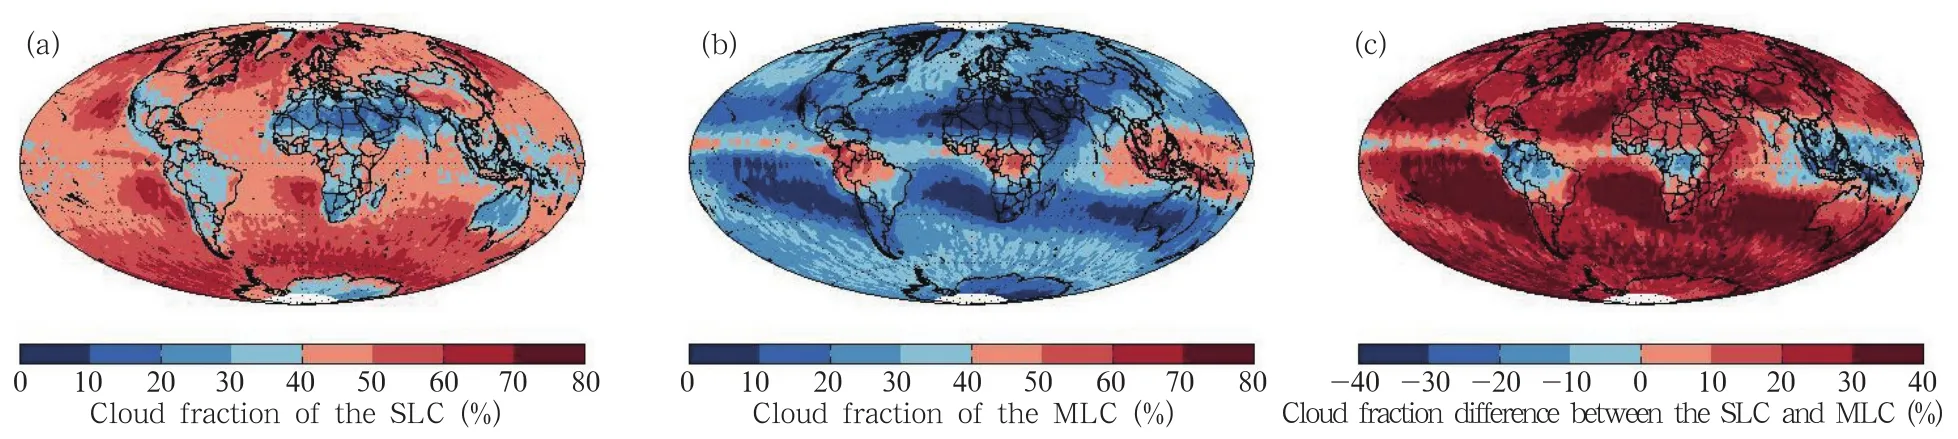
Fig.1.Cloud fractions of the(a)SLC,(b)MLC,as well as(c)their difference.
The global distributions of CRF induced by the SLC and the difference with that of the MLC at the TOA are shown in Fig.2.From left to right,each column represents different flux bands,including shortwave(SW),longwave(LW),and net(NET)CRF.
The positive correlation between the SW CRF and the cloud fraction can be seen in Figs.1a and 2a.Moreover,the SLC SW CRF is negative everywhere,and in some areas,such as the western coasts of multiple continents,they are less than-120 W m-2. In these regions,the SLC is mainly composed of low clouds with high albedos.The CRF differences between the SLC and MLC indicate their relative regional importance(Fig.2d).This is particularly true in tropic areas,where the difference is positive and with the largest of more than 40 W m-2,indicating a stronger cooling effect induced by the MLC than the SLC.Similarly,in areas where the SLC frequently occurs,the difference is negative and largest.Utilizing the datasets from CMIP3,Trenberth and Fasullo(2010)concluded that the outputs of 24 coupled models exhibit significantly different SW CRF zonal patterns,which are partially due to the assumption of single layer clouds.Our results confirm that the CRF differences between SLC and MLC underline the significance of the MLC in the tropical area,which exhibits a larger impact on the regional radiation balance.Figure 2d can be used to improve the cloud overlapping schemes of the regional models.
Cloud height is the decisive factor in the LW CRF difference as illustrated in Fig.2e.This is confirmed by the data shown in Fig.2b,where over the western coasts of the continents,low clouds are prevalent,exhibiting SLC LW CRF of less than 10 W m-2.This is because low clouds fail to prevent LW radiation emitted by the earth out of space.Moreover,the LW CRF difference shows that the MLC can regionally trap more infrared radiative energy than the SLC in the tropical regions,whereas the situation is reversed in mid-high latitudes.The NET CRF,which is defined as the sum of the SW CRF and LW CRF,with its contrasting images shown in Figs.2c and 2f,are not discussed in detail here due to their similarity to the SW CRF.
Figure 3 presents global CRF distributions at the BOA.Similarities between the global SW CRF at the TOA(Figs.2a and 2d)and BOA(Figs.3a and 3d)are in accordance with the results of Chen et al.(2000).Based on the LW CRF in Fig.3b,the SLC exhibits warming effects over midlatitudes,the Tibetan Plateau,and western coasts of multiple continents.In these regions,the SLC LW CRF is typically larger than that of the MLC,and their maximum difference can reach approximately 30 W m-2(Fig.3e).Conversely,in some regions near the equator,such as the eastern Indian Ocean and the warm pool of western Pacific,the MLC LW CRF is significantly larger,and the difference is within 10 W m-2.Moreover,the NET CRF global distributions(Figs.3c and 3f)are similar to those of the SW CRF because the SW CRF has a larger magnitude than the LW CRF.Consequently,the MLC exhibits stronger surface cooling effects in the regions around the equator(maximum difference is 50 W m-2);whereas the situation is reversed in other regions(maximum difference is 150 W m-2).Note that only instantaneous daytime data were used in the study based on A-Train satellites across the equator at 1330 LT.Therefore,the strong incident solar radiation at that time potentially causes the larger,more negative SW CRF.However,we should know that the daily averaged LW CRF at the TOA and BOA is as important as the SW CRF.
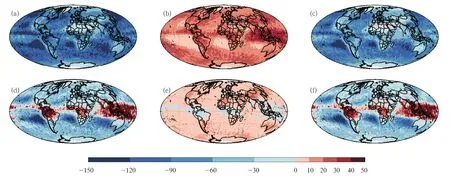
Fig.2.Global distributions of CRF induced by the SLC and difference with that of the MLC at the TOA.(a)SW CRF of the SLC(W m-2),(b)LW CRF of the SLC(W m-2),(c)NET CRF of the SLC(W m-2),(d)SW CRF difference(W m-2),(e)LW CRF difference(W m-2),and(f)NET CRF difference(W m-2).
The SLC and MLC affect the atmospheric transmission of radiative energy in different ways based on their different cloud structures.Figure 4 illustrates their radiative difference in the ATM.Clouds can exert three different effects on shortwave atmospheric absorption:1)higher cloud albedo increases the total reflected solar radiation,consequently increasing the solar radiation absorbed by the atmosphere above the clouds;2)cloud droplets in the cloud layer can increase the average photon path via scattering,which absorbs more solar radiation than water vapor;and 3)clouds attenuate the atmospheric absorption below them (Chen et al.,2000).For low clouds,the first two effects surpass the third,causing increased atmospheric shortwave absorption.For high-level clouds,the third effect surpasses the first two,causing decreased atmospheric shortwave absorption(the three effects nearly offset for middle clouds). Therefore,in the areas where low clouds frequently occur,such as western continental coasts,the SLC SW CRF in the ATM is significantly larger.In the tropics,where the MLC cloud fraction is greatest,the MLC induces stronger atmospheric solar radiation absorption(Figs. 4a and 4d).Both the SLC and MLC trap more atmospheric solar radiation with CRF values over the range of 10-20 W m-2.
Moreover,two opposite effects are shown associated with cloud impacts on the atmospheric infrared radiation energy.First,clouds can trap more longwave radiation energy by decreasing the effective atmospheric emitted temperature.Second,clouds can increase atmospheric longwave cooling by increasing the effective emissivity of the atmosphere in the water vapor window(Chen et al.,2000).The competition between these two effects causes the SLC LW CRF to produce positive and negative regional values.Thesufficient water vapor and vertical upward motion around the equator favor high clouds.Therefore,the SLC exhibits a warming effect(the maximum value of LW CRF reaches 40 W m-2).However,in high latitudes,the second effect surpasses the first by significantly increasing the water vapor.Therefore,the SLC exhibits an enhanced infrared cooling effect(the LW CRF ranges from-10 to-30 W m-2).The LW CRF difference displayed in Fig.4e is so distinct that in some regions,such as the western coasts of South and North America,southern Africa,Australia,and other high-latitude areas,the SLC reveals a stronger infrared cooling effect than the MLC,which is mostly due to the cloud fraction difference(the contrast ranges from -10 to-30 W m-2).The global distribution of NET CRF is similar to that of LW CRF rather than the SW CRF,indicating the dominant role of LW CRF in the ATM.
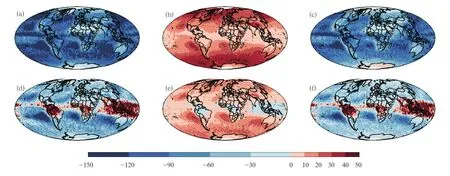
Fig.3.As in Fig.2,but for the CRF at the BOA.
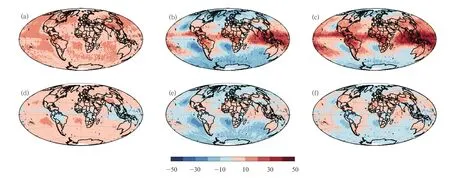
Fig.4.As in Fig.2,but for the CRF in the ATM.
5.Zonal pattern and global average of CRF
Following the discussion of the global distributions of SLC and MLC radiative effects,this section intends to further analyze their zonal patterns(2°averaged in latitudes)and global averages.The zonal distributions of the CRF and radiative contribution ratio(RCR)at a certain latitude induced by the SLC and MLC,as well as their difference at the TOA and BOA,are given in Figs.5a and 5b,respectively.For the SW CRF,the SLC and MLC both exhibit some peaks at 50°N,north of the equator,20°S,and 50°S. Other than the areas around the equator,the SLC with the largest peak of-120 W m-2is always larger than the MLC.Moreover,at the TOA,the LW CRF zonal trend peaks at the equator.At the BOA,the largest peaks occur in mid-high latitudes.In addition,the NET CRF variations are all similar to those of the SW CRF due to the latter's larger magnitude.
To provide further detail regarding the contribution made by the SLC(MLC)at each latitude,we introduce the RCR.This parameter is defined as the CRF induced by the SLC(MLC)divided by the total CRF induced by sum of the SLC and MLC.In Figs. 5c and 5d,the MLC RCR at the TOA peaks at 40°N,40°S,and near the equator,where the maximum SW RCR can reach 55%.The RCR of the MLC is more stable in mid-high latitudes of the Northern Hemisphere than the corresponding areas in the Southern Hemisphere.Moreover,in regions from the equator to 10°S,the MLC exhibits larger LW RCR than the SW and NET RCR.In addition,the MLC SW RCR exhibits a similar magnitude to the NET RCR at the BOA,whereas LW RCR is smallest from 40°S to 40°N. The RCR difference is further defined as the contrast in RCR between the SLC and MLC to display their zonal difference(Figs.5e and 5f).The positive(negative)value indicates a larger SLC(MLC)RCR.The SW and NET RCR differences exhibit similar variations and magnitudes at both the TOA and BOA. They are stable within a 24%range from 30°to 60°N,and then sharply decrease to-10%near the equator. In addition,the zonal RCR differences reveal distinct hemispheric asymmetry,as Southern Hemisphere values are higher than Northern Hemisphere values.Positive RCR differences only appear around the equator,indicating the importance to regionally strengthening MLC research there.Note that the South Pole peaks unreasonably occur at the BOA for the SW and NET(Figs.5d and 5f).This is because the opposite signs of the SLC and MLC CRF lead to a total RCR exceeding 100%.
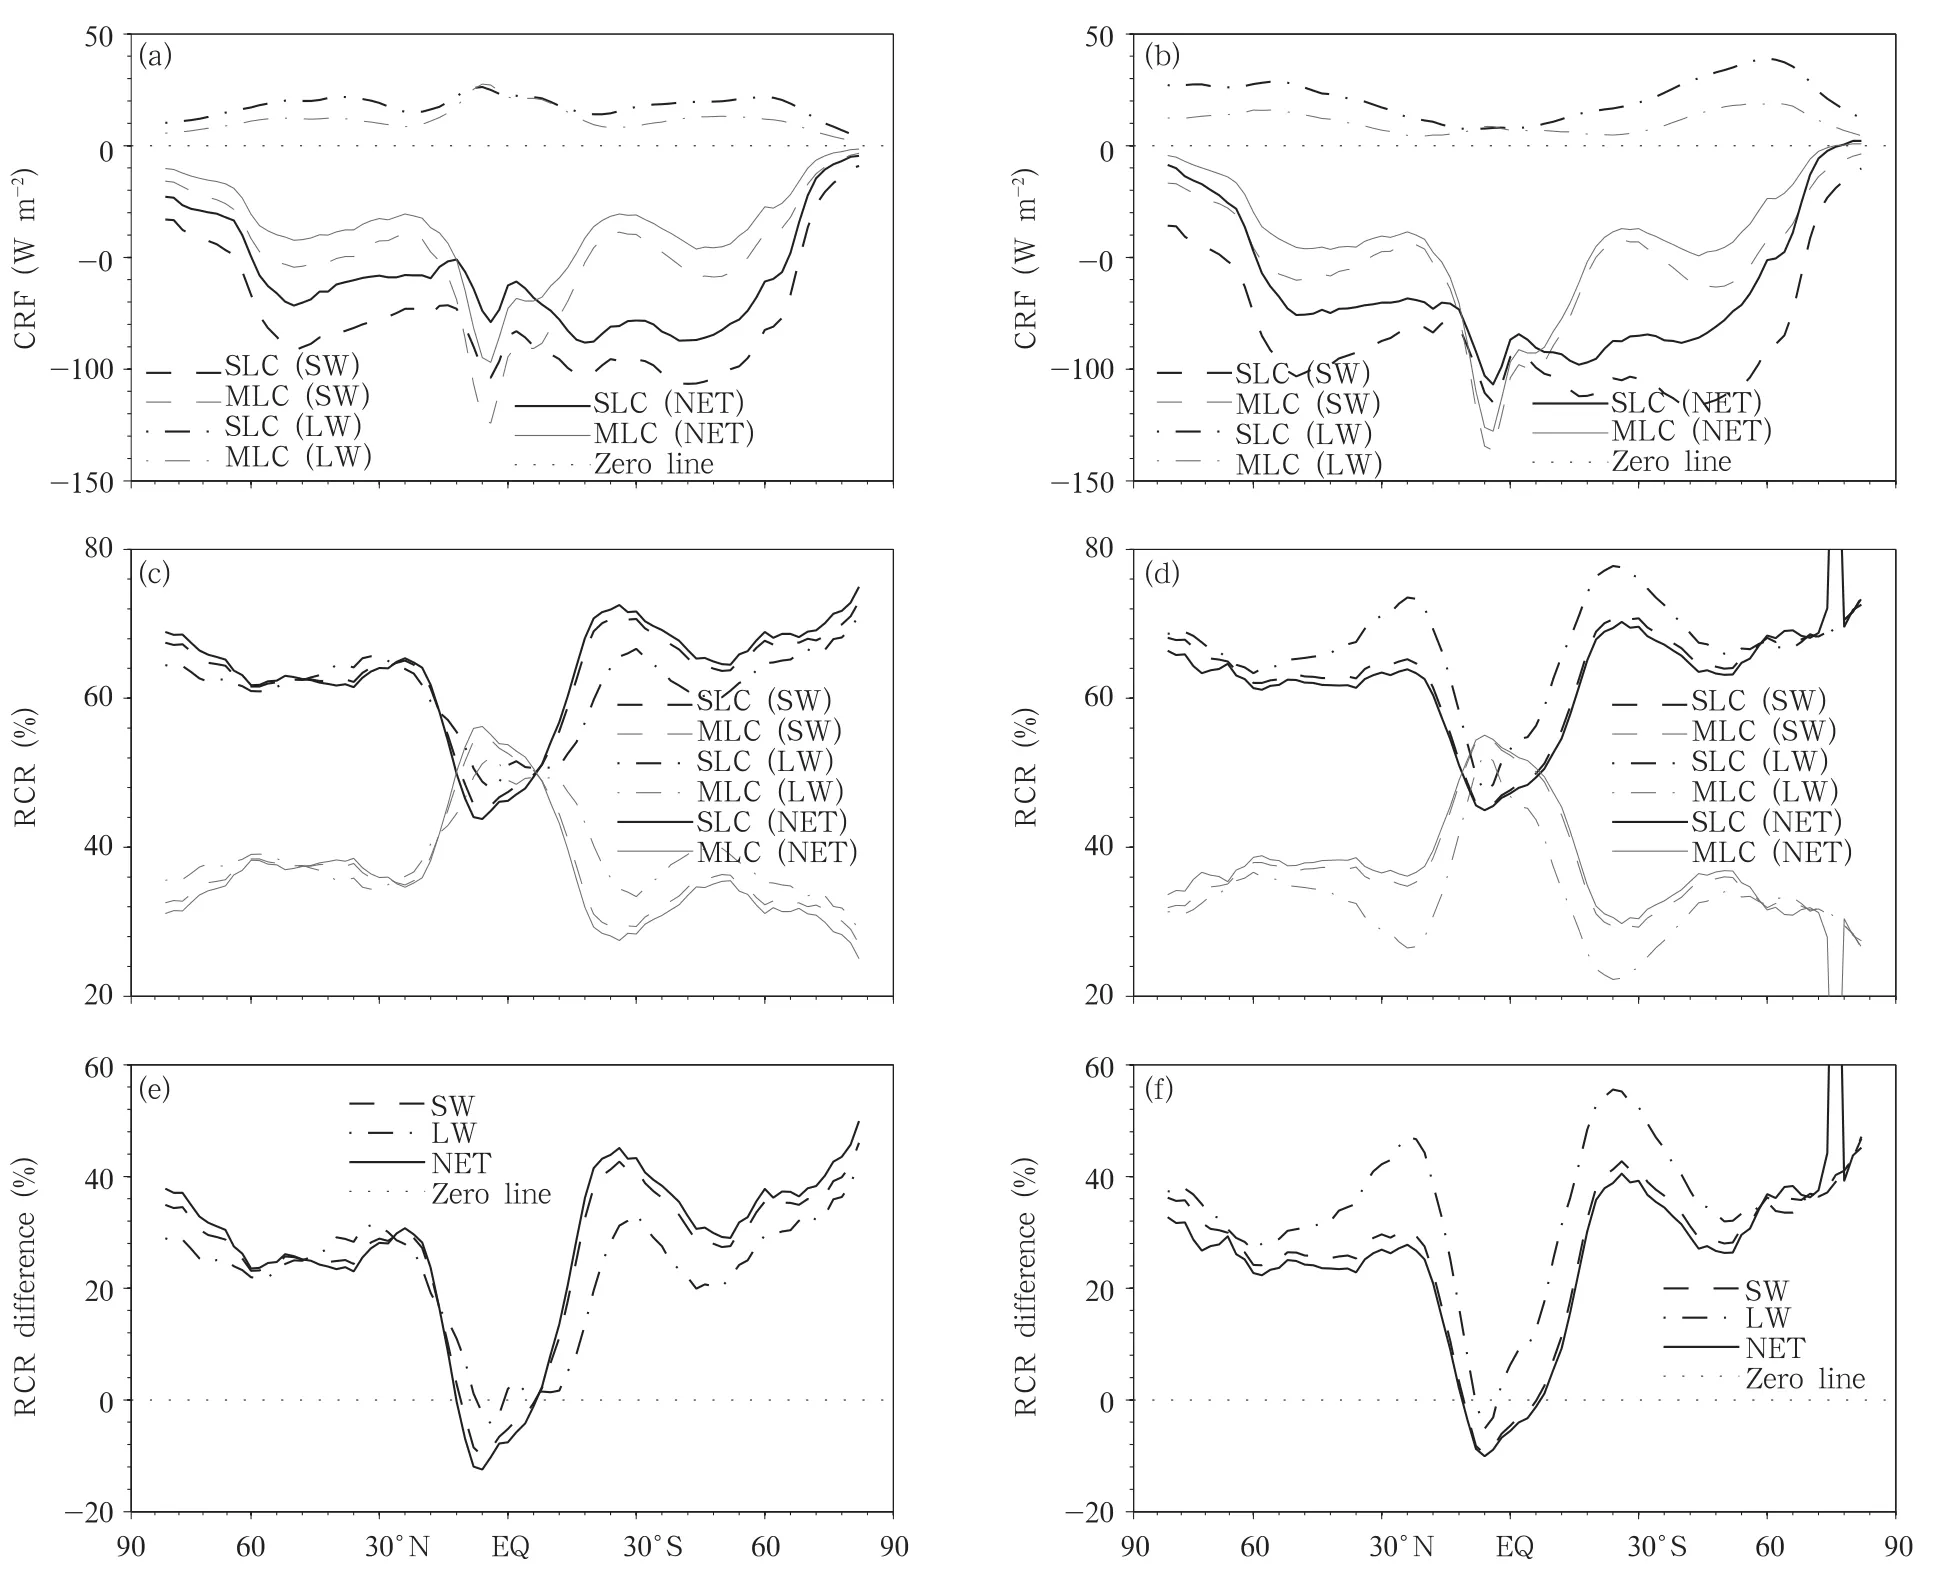
Fig.5.Zonal distributions of the CRF,the RCR induced by the SLC and MLC,and their RCR difference.
The zonal CRF patterns in the ATM are presented in Fig.6.Starting from the equator the atmospheric NET heating effect with a maximum value of 30 W m-2caused by the SLC gradually transfers to an NET cooling effect with a minimum value of -15 W m-2at around 60°N and 40°S.Moreover,the varied zonal radiative differences between the SLC and MLC are distinct.In the regions between the equator and 40°S,the MLC exhibits a stronger NET heating effect than the SLC(the NET CRF differences range from-5 to 0 W m-2).In the south of 40°S,the NET cooling effects caused by the MLC are obviously weaker because of their positive LW CRF differences. However,in the Northern Hemisphere,the MLC exhibits either a weaker NET cooling effect(north of 60°N)or NET warming effect(south of 60°N)than the SLC.In addition,the zonal NET CRF difference reveals a significant hemispheric asymmetry,which may be potentially linked to asymmetric cloud structure and requires further study(Li et al.,2011).
In the present study,the globally averaged SW,LW,and NET CRF at the TOA,BOA,and in the ATM for both the SLC and MLC are shown in Table 1.The globally averaged SLC and MLC NET CRF(RCR)at the TOA are-60.8(59.8%)and-40.9(40.2%)W m-2,respectively.At the BOA,the associated values are-67.5(57.6%)and-49.6(42.4%)W m-2,respectively.The globally averaged SLC SW CRF in the ATM(8.3 W m-2)is larger than the MLC(5.2 W m-2).However,for the LW in the ATM,the MLC exhibits a warming effect(3.5 W m-2),whereas the SLC exhibits a cooling effect(-1.7 W m-2).As a consequence,the globally averaged NET CRF of the MLC(8.7 W m-2)is greater than that of the SLC(6.6 W m-2)by 2.1 W m-2.In addition,the total MLC heating contribution to the atmosphere can reach 57%,further indicating the important role of the MLC in the atmospheric radiative balance.
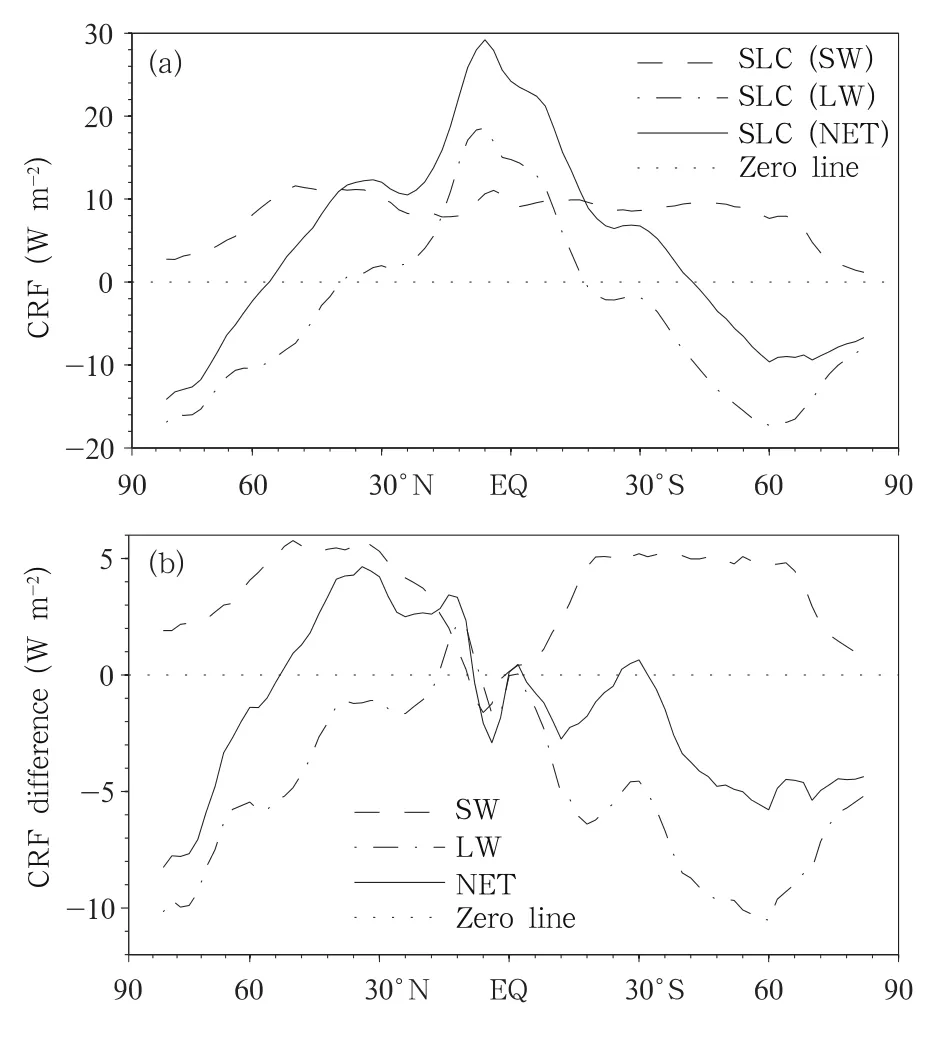
Fig.6.(a)Zonal CRF distributions induced by the SLC and(b)the differences between SLC and MLC in the ATM.
6.Zonal pattern and global average of CRH
The MLC exhibits a stronger warming effect in the ATM than the SLC,although its cloud fraction is relatively small.Indeed,this indicates the significance of the MLC in affecting the atmospheric radiative balance.However,the CRF in the ATM fails to describe the vertical radiation energy distribution. Therefore,we utilize high-resolution atmospheric heating profiles to study how the SLC and MLC influence vertical redistribution of radiative energy in this section.In the past,high-resolution atmospheric heating rate profiles have proved difficult to obtain on the global scale.However,CloudSat and CALIPSO now provide such high-resolution data.We hope that our results can improve understanding of the role that the MLC has played in affecting the vertical distribution of radiative energy and provide an observational basis for cloud parameterizations in global models.
We define the CRH based on the definition of Haynes et al.(2013),which is the difference in the atmospheric heating rate profiles between cloudy and clear skies.Thus,the defined parameter can clearly describe the vertical redistribution of radiative energy by clouds.The zonal distributions of CRH induced by the SLC,and its difference compared with that of the MLC,are illustrated in Fig.7.
In tropical regions,clouds vigorously develop up to the higher tropopause.Clouds not only enhance the absorption of solar radiation in the cloud layer but also in the atmosphere above the clouds.Therefore,the enhanced heating areas above 5 km,near 30°N and 30°S,and at higher altitudes in the tropics are caused by the prevalent low and high clouds,respectively(Fig.7a). Moreover,the negative SW CRH induced by the SLC along the boundary is due to solar radiation attenuation by clouds.Regarding the SW CRH difference,the MLC reveals a boundary cooling rate larger than the SLC,whereas in the mid-high atmosphere,the MLC reveals an enhanced heating rate over more extensive areas(Fig.7d).
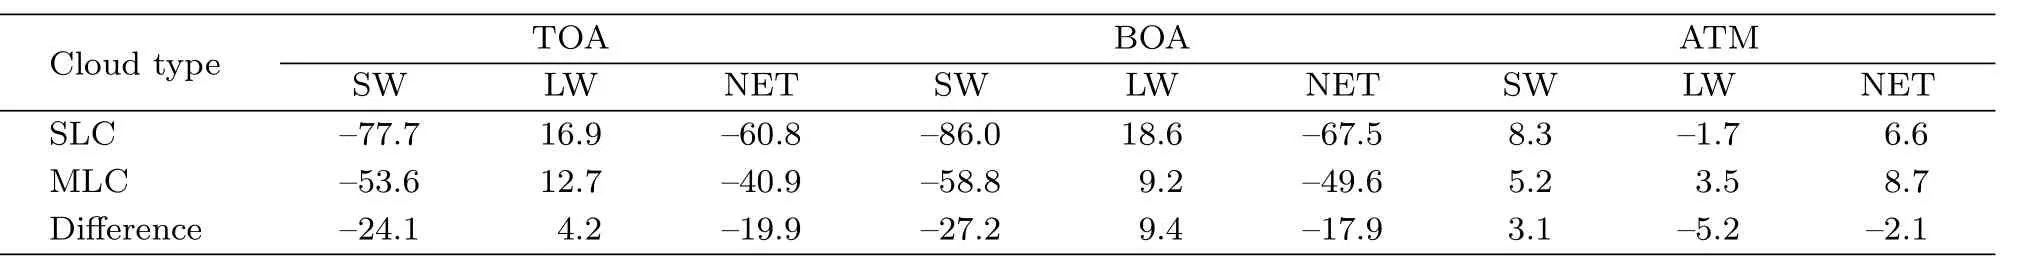
Table 1.Global averages of CRF induced by the SLC and MLC at the TOA,BOA,in the ATM,and their differences(W m-2)
Previous studies have shown enhanced infrared cooling at the top of clouds and reduced infrared heating at the bottom of clouds(Liou and Zheng,1984;Wang and Zhao,1994),which is confirmed in Fig.7b. The positive and negative LW CRH alternately occurs with increasing altitude.The areas in which LW CRH is less than-0.1 K day-1can reach approximately 15-km altitude in the tropics,which is due to the presence of high clouds there.Note that the enhanced infrared cooling areas induced by the SLC appear significantly in the boundary layer from 20°to 60°S.This is due to the prevalence of low clouds and their enhanced cloud top infrared radiative cooling.Similarly,over there the SLC exhibits a stronger infrared cooling effect than the MLC,as the infrared heating rate of SLC at the bottom of the upper cloud layer has offset the infrared cooling rate at the top of the lower cloud layer(see Fig.7e),as confirmed by Christensen et al.(2013).
In addition,the NET CRH is defined as the sum of the SW and LW CRH and is positive at mid-high atmospheric levels from 60°S to 60°N.In these regions,they are contributed largely by the SW CRH,except in the boundary layer where the LW CRH dominates(Fig.7c).In high latitudes,the NET CRH at midhigh atmospheric levels is negatively dominated by the LW CRH.The NET CRH differences are predominantly negative,with a maximum value of-0.45 K day-1,and partially positive,in the range of 0-0.25 K day-1(Fig.7f)after LW and SW CRH differences cancel each other for their opposite signs.
Figure 8 illustrates the globally averaged CRH induced by the SLC and MLC,as well as their difference. The CRH difference is represented by the positive areas,indicating larger CRH of the SLC,and negative areas vice versa.The SW CRH of the SLC and MLC gradually increases with raising altitude.They then transfer from negative to positive at 1.5 and 2.5 km,respectively(Fig.8a).In the mid-high troposphere,the SLC and MLC SW CRH displays unimodal distributions,with peaks occurring at 9.75 km(0.35 K day-1)and 7.5 km(0.60 K day-1),respectively.Moreover,compared with the SLC,the presence of the MLC reduces more SW absorption at low levels while traps more solar radiation energy in the mid and high troposphere.Consequently,for the SW CRH difference,the positive and negative areas alternate.As shown in Fig.8b,the LW CRH of both the SLC and MLC exhibits heating peaks at 1 km,with values of 0.66 and1.12 K day-1,respectively.Their cooling peaks appear at 2 km (-0.45 K day-1)and 8 km (-0.42 K day-1),respectively.Conversely,the MLC LW CRH exhibits a weaker heating effect than the SLC at the mid-high levels,whereas the opposite is true in the lower troposphere.In Fig.8c,significant negative differences below 7.5 km highlight the impacts of the MLC on the atmospheric radiative balance,consequently further confirming the obtained result that the MLC has larger global averaged NET CRF than the SLC.In summary,the negative NET CRH difference in the troposphere and the opposing relationship between the globally averaged SW CRH and LW CRH differences can provide an observational basis for improving the cloud parameterization schemes in global models.
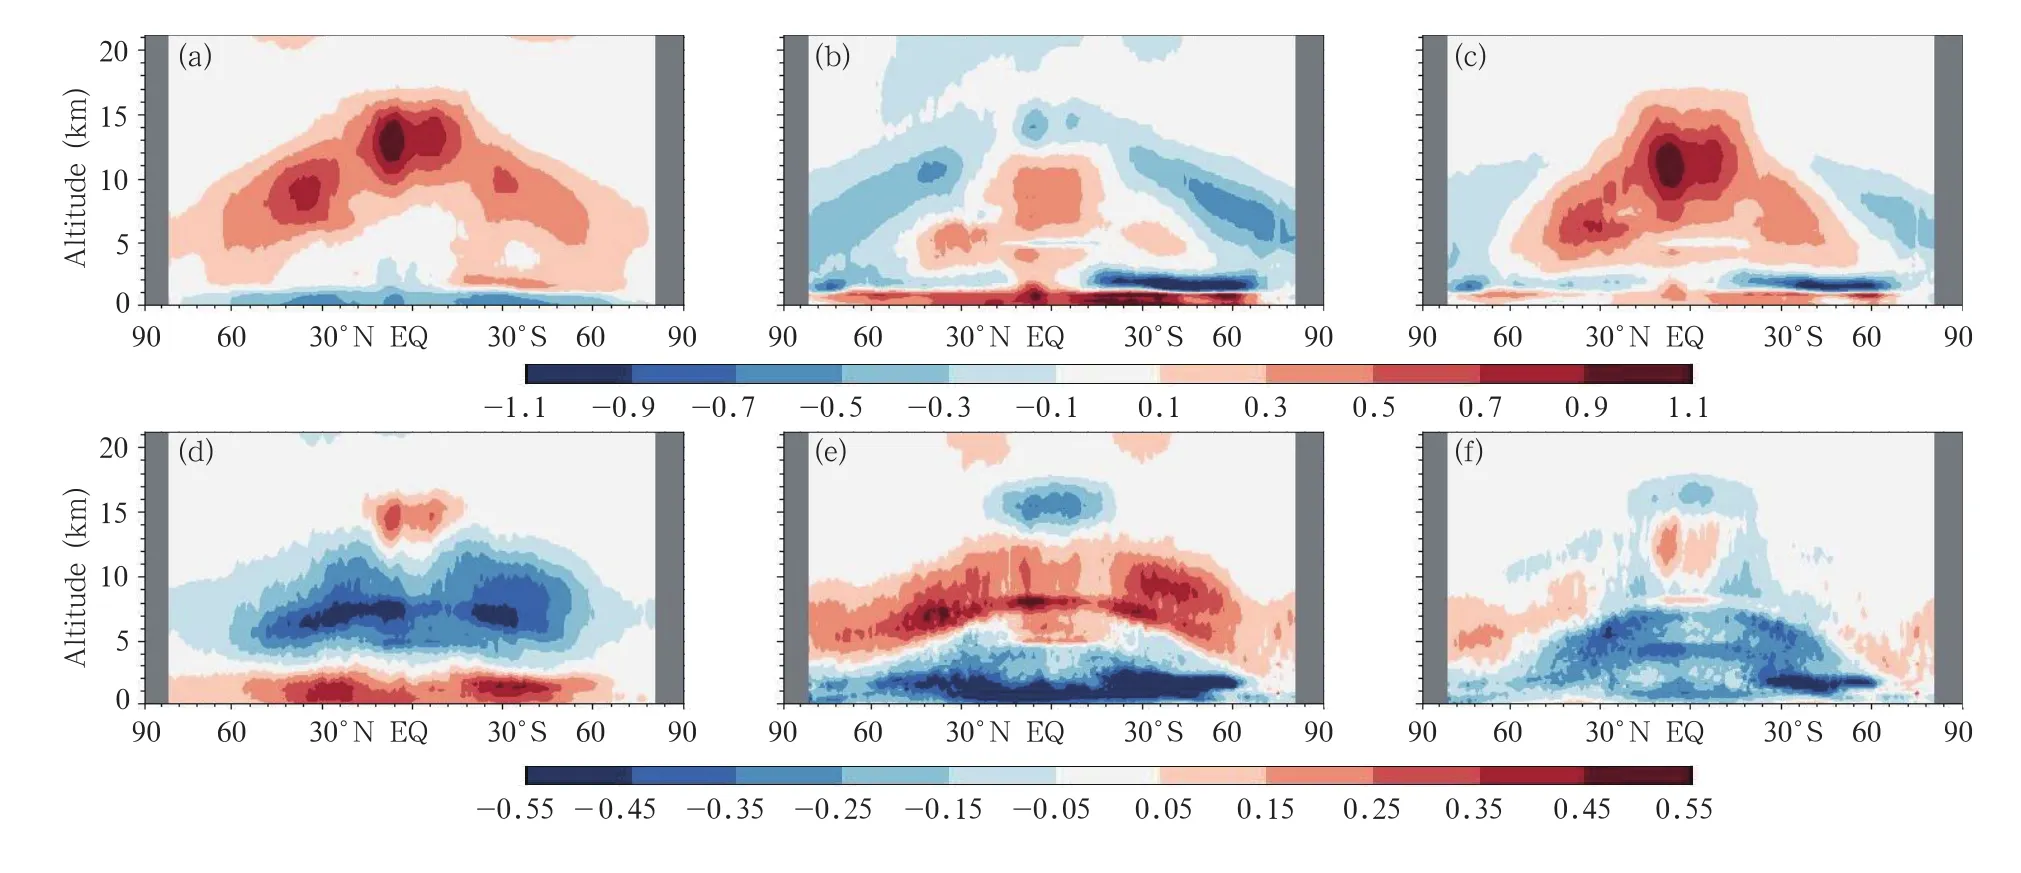
Fig.7.Zonal distributions of CRH induced by the SLC and its difference compared with that of the MLC.(a)SW CRH of the SLC(K day-1),(b)LW CRH of the SLC(K day-1),(c)NET CRH of the SLC(K day-1),(d)SW CRH difference(K day-1),(e)LW CRH difference(K day-1),and(f)NET CRH difference(K day-1).
7.Summary and discussion
As a modulator of climate and climate change,varied cloud types have different radiative impacts on the earth-atmosphere system,thus affecting atmospheric water cycle and large-scale circulation in different ways.Therefore,the SLC and MLC,which exhibit contrasting cloud structures,can alter the radiative fluxes at the TOA,BOA,and in the ATM,and the atmospheric heating rates.We first quantified the cloud fractions of the SLC and MLC and discussed their CRF at the TOA,BOA and in the ATM,and their CRH.Our conclusions are as follows.
The SLC cloud fraction is greatest over the Tibetan Plateau and the western coasts of the continents including Americas,southern Africa,and Australia,whereas the MLC cloud fraction is greatest over the tropical and subtropical regions,particularly near northern South America,central Africa,the eastern Indian Ocean,and the warm pool of western Pacific,where cloud fraction can reach more than 50%.In these regions,the MLC cloud fraction is higher than that of the SLC,with the difference ranging from 0 to 20%.Moreover,the MLC cloud fraction is least in the Hadley circulation subsidence areas at 30°N and 30°S,which are significantly lower than the SLC cloud fraction.Although the MLC cloud fraction ranges from 20%to 40%in mid-high latitudes,the larger SLC cloud fraction magnitude creates a large contrast between the values.In summary,the globally averaged SLC and MLC cloud fractions are 46.6%and 24.9%,respectively.
The globally averaged SW CRF values at the TOA(BOA)of the SLC and MLC are-77.7(-86.0)and-53.6(-58.8)W m-2,respectively,implying their cooling effects on the global radiation energy budget. Moreover,the globally averaged SLC and MLC LW CRF values at the TOA(BOA)are 16.9(18.6)and 12.7(9.2)W m-2,revealing their infrared warmingeffects.Although the globally averaged SLC cloud fraction is greater than that of the MLC,the MLC contributes to the total NET CRF at the TOA(BOA)with a value of 40.2%(42.4%).In the ATM,the SLC and MLC SW CRF values are 8.3 and 5.2 W m-2respectively,whereas their LW CRF values are-1.7 and 3.5 W m-2.For the globally averaged NET CRF in the ATM,the MLC(8.7 W m-2)is larger than the SLC(6.6 W m-2)by 2.1 W m-2.The MLC contributes to 57%of the total heating effect on the atmosphere,indicating its important role in the atmospheric radiation balance.
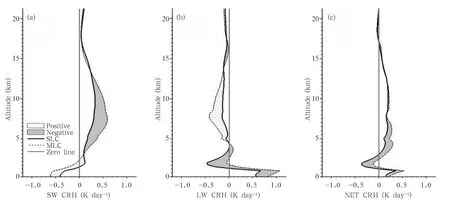
Fig.8.Global averages of CRH induced by the SLC and MLC as well as their difference.
The globally averaged SLC and MLC SW CRH tends to change from negative to positive at 1.5-and 2.5-km height,respectively.In addition,in the midhigh troposphere,they display unimodal distributions,with peaks at 9.75-km (0.35 K day-1)and 7.5-km(0.60 K day-1)altitudes.Moreover,for the SW CRH difference,positive and negative areas alternatively occur with increasing altitude. Similarly,the SLC and MLC LW CRF values both reach heating peaks(0.66 and 1.12 K day-1)at 1 km,whereas their cooling peaks(-0.45 and-0.42 K day-1)appear at 2 and 8 km,respectively.In addition,the LW CRH difference exhibits a negative area first,followed by positive areas,with increasing altitude.This result is opposite to the SW CRH difference.The NET CRH difference is always negative below 7.5-km altitude.In conclusion,the negative NET CRH difference and the opposing relationship between the globally averaged LW CRH difference and SW CRH difference in the troposphere can provide an observational basis for understanding and improving the cloud parameterization schemes.
The SLC can be further divided into several cloud types,including high,middle,and low clouds,whereas the MLC can be high clouds overlapping low clouds,high clouds overlapping middle clouds,and middle clouds overlapping low clouds,etc.These cloud types also exhibit different radiative characteristics because of their distinguished cloud properties,thus affecting the radiative differences between the SLC and MLC. Further studies are needed to better understand the impacts that specific cloud types have on the global radiation budget,particularly on atmospheric heating profiles.
Acknowledgments.We would like to thank the CALIPSO and CloudSat science teams for providing excellent and accessible data products that made this study possible.
Behrangi,A.,T.Kubar,and B.H.Lambrigtsen,2012:Phenomenological description of tropical clouds using CloudSat cloud classification.Mon.Wea.Rev.,140,3235-3249.
Cess,R.D.,G.L.Potter,J.P.Blanchet,et al.,1989:Interpretation of cloud-climate feedback as produced by 14 atmospheric general circulation models.Science,245,513-516.
Chen,C.,and W.R.Cotton,1987:The physics of the marine stratocumulus-capped mixed layer.J.Atmos.Sci.,44,2951-2977.
Chen,T.,W.B.Rossow,and Y.C.Zhang,2000:Radiative effects of cloud-type variations.J.Climate,13,264-286.
Christensen,M.W.,G.Carri´o,G.L.Stephens,et al.,2013:Radiative impacts of free-tropospheric clouds on the properties of marine stratocumulus.J.Atmos.Sci.,70,3102-3118.
Chen Yonghang,Huang Jianping,Ge Jinming,et al.,2006:Cloud properties and its relation to precipitation over Northwest China.Acta Meteor.Sinica,20,23-30.
Chen Yonghang,Bai Hongtao,Huang Jianping,et al.,2008:Comparison of cloud radiative forcing on the earth-atmosphere system over northwestern China with respect to typical geo-topography regions. China Environ.Sci.,28,97-101.(in Chinese)
Ding Xiaodong,Huang Jianping,Li Jiming,et al.,2012:Study on cloud vertical structure feature over Northwest China based on active satellite remote sensing and its influence on precipitation enhancement.J. Arid Meteor.,30,529-538.(in Chinese)
Fu Yunfei,2014:Cloud parameters retrieved by the bispectral reflectance algorithm and associated applications.J.Meteor.Res.,28,965-982.
Fung,I.Y.,D.E.Harrison,and A.A.Lacis,1984:On the variability of the net longwave radiation at the ocean surface.Rev.Geophys.,22,177-193.
Hartmann,D.L.,V.Ramanathan,A.Berroir,et al.,1986:Earth radiation budget data and climate research.Rev.Geophys.,24,439-468.
Hartmann,D.L.,M.E.Ockert-Bell,and M.L.Michelsen,1992:The effect of cloud type on earth's energy balance:Global analysis.J.Climate,5,1281-1304.
Haynes,J.M.,C.Jakob,W.B.Rossow,et al.,2011:Major characteristics of southern ocean cloud regimes and their effects on the energy budget.J.Atmos. Sci.,24,5061-5080.
Haynes,J.M.,T.H.V.Haar,T.L'Ecuyer,et al.,2013:Radiative heating characteristics of earth's cloudy atmosphere from vertically resolved active sensors. Geophys.Res.Lett.,40,624-630.
Henderson,D.,T.L'Ecuyer,G.Stephens,et al.,2013:A multisensor perspective on the radiative impacts of clouds and aerosols.J.Appl.Meteor.Climatol.,52,853-871.
Huang,J.P.,P.Minnis,B.Lin,et al.,2005:Advanced retrievals of multilayered cloud properties using multispectral measurements.J.Geophys.Res.,110,1275-1287.
Huang,J.P.,B.Lin,P.Minnis,etal.,2006a:Satellite-based assessment of possible dust aerosols semi-direct effect on cloud water path over East Asia. Geophys. Res. Lett.,33,L19802,doi:10.1029/2006GL026561.
Huang,J.P.,P.Minnis,B.Lin,et al.,2006b:Determination of ice water path in ice-over-water cloud systems using combined MODIS and AMSR-E measurements.Geophys.Res.Lett.,33,1522-1534.
Huang,J.P.,P.Minnis,B.Lin,et al.,2006c:Possible influences of Asian dust aerosols on cloud properties and radiative forcing observed from MODIS and CERES.Geophys.Res.Lett.,33,L06824,doi:10.1029/2005GL024724.
Hu,Y.X.,S.Rodier,K.M.Xu,et al.,2010:Occurrence,liquid water content,and fraction of supercooled water clouds from combined CALIOP/IIR/MODIS measurements.J.Geophys.Res.,115,D00H34,doi:10.1029/2009JD012384.
L'Ecuyer,T.S.,2007: Level2fluxesand heating ratesproductprocessdescription and interface control document,ver. 5.1,CloudSat Data Processing Center,Fort Collins,Colorado,http://www.cloudsat.cira.colostate.edu/ICD/2BFLXHR/flxhr2b-icd-v5.pdf.
L'Ecuyer,T.S.,N.B.Wood,T.Haladay,et al.,2008:Impacts of clouds on atmospheric heating based on the R04 CloudSat fluxes and heating rates data set.J.Geophys.Res.,113,D00A15,doi:10.1029/2008JD009951.
Li,J.M.,Y.H.Yi,P.Minnis,et al.,2011:Radiative effect differences between multi-layered and singlelayer clouds derived from CERES,CALIPSO,and CloudSat data.J.Quant.Spectrosc.Radiat.Transfer,112,361-375.
Li,J.M.,J.P.Huang,K.Stamnes,et al.,2015:A global survey of cloud overlap based on CALIPSO and CloudSat measurements.Atmos.Chem.Phys.,15,519-536.
Li Jiming,Huang Jianping,Yi Yuhong,et al.,2009:Analysis of vertical distribution of cloud in East Asia by space-based lidar data.Chinese J.Atmos. Sci.,33,698-707.(in Chinese)
Liang,X.Z.,and X.Q.Wu,2005:Evaluation of a GCM subgrid cloud-radiation interaction parameterization using cloud-resolving model simulations.Geophys. Res.Lett.,32,347-354.
Liou,K.N.,and Q.L.Zheng,1984:A numerical experiment on the interactions of radiation,clouds and dynamic processes in a general circulation model.J. Atmos.Sci.,41,1513-1536.
Liu Jingjing,Chen Bin,and Huang Jianping,2014:Discrimination and validation of clouds and dust aerosol layers over the Sahara desert with combined CALIOP and IIR measurements.J.Meteor.Res.,28,185-198.
Mace,G.G.,D.Vane,G.Stephens,et al.,2007:Level 2 radar-lidar GEOPROF product version 1.0 process description and interface control document.JPL,Pasadena,USA,1-20.
Min,Q.L.,T.H.Wang,C.N.Long,et al.,2008:Estimating fractional sky cover from spectral measurements.J.Geophys.Res.,113,D20208,doi:10.1029/2008JD010278.
Minnis,P.,J.P.Huang,B.Lin,et al.,2007:Ice cloud properties in ice-over-water cloud systems using Tropical Rainfall Measuring Mission(TRMM)visible and infrared scanner and TRMM Microwave Imager data.J.Geophys.Res.,112,541-553.
Morcrette,J.J.,and C.Jakob,2000:The response of the ECMWF model to changes in the cloud overlap assumption.Mon.Wea.Rev.,128,1707-1732.
Peng Jie,Zhang Hua,and Shen Xinyong,2013:Analysis of vertical structure of clouds in East Asia with CloudSat data.Chinese J.Atmos.Sci.,37,91-100.(in Chinese)
Randall,D.A.,J.A.Coakley Jr.,D.H.Lenschow,et al.,1984:Outlook for research on subtropical marine stratification clouds.Bull.Amer.Meteor.Soc.,65,1290-1301.
Ritter,B.,and J.F.Geleyn,1992:A comprehensive radiation scheme for numerical weather prediction models with potential applications in climate simulations.Mon.Wea.Rev.,120,303-325.
Rossow,W.B.,and A.A.Lacis,1990:Global,seasonal cloud variations from satellite radiance measurements.Part II:Cloud properties and radiative effects.J.Climate,3,1204-1253.
Slingo,A.,1990:Sensitivity of the earth's radiation budget to changes in low clouds.Nature,343,49-51.
Stephens,G.L.,P.M.Gabriel,and P.T.Partain,2001:Parameterization of atmospheric radiative transfer. Part I:Validity of simple models.J.Atmos.Sci.,58,3391-3409.
Su,J.,J.P.Huang,Q.Fu,et al.,2008:Estimation of Asian dust aerosol effect on cloud radiation forcing using Fu-Liou radiative model and CERES measurements.Atmos.Chem.Phys.,8,2763-2771.
Tian,L.,and J.A.Curry,1989:Cloud overlap statistics. J.Geophys.Res.,94,9925-9935.
Trenberth,K.E.,and J.T.Fasullo,2010:Simulation of present-day and twenty-first-century energy budgets of the southern oceans.J.Climate,23,440-454.
Wang Fang and Ding Yihui,2005:An evaluation of cloud radiative feedback mechanism in climate models. Adv.Earth Sci.,20,207-215.(in Chinese)
Wang Fang,Ding Yihui,and Xu Ying,2007:Cloud and radiation processes simulated by a coupled atmosphere-ocean model. Acta Meteor. Sinica,21,397-408.
Wang Hongqi and Zhao Gaoxiang,1994:Cloud and radiation(I):Cloud climatology and radiative effects of clouds.Scientia Atmospheric Sinica,18,910-921.(in Chinese)
Wang,J.H.,W.B.Rossow,and Y.C.Zhang,2000:Cloud vertical structure and its variations from a 20-yr global rawinsonde dataset.J.Climate,13,3041-3056.
Wang,L.K.,and A.E.Dessler,2006:Instantaneous cloud overlap statistics in the tropical area revealed by ICESat/GLAS data.Geophys.Res.Lett.,33,292-306.
Wang Shuaihui,Han Zhigang,Yao Zhigang,et al.,2011:Analysis of vertical structure of clouds in China and the surrounding with CloudSat data.Plateau Meteorology,30,38-52.(in Chinese)
Wang,T.H.,and Q.L.Min,2008:Retrieving optical depths of optically thin and mixed-phase clouds from MFRSR measurements.J.Geophys.Res.,113,D19203,doi:10.1029/2008JD009958.
Wang Tianhe and Huang Jianping,2009:A method for estimating optical properties of dusty cloud.Chinese Optics Letters,7,368-372.
Wang,W.C.,J.P.Huang,P.Minnis,et al.,2010:Dusty cloud properties and radiative forcing over dust source and downwind regions derived from A-Train dataduringthePacificDustExperiment. J.Geophys. Res.,115,D00H35,doi:10.1029/2010JD014109.
Wang,Z.,and K.Sassen,2007:Level 2 cloud scenario classification product process description and interface control document,Ver. 5.0,CloudSat Data Processing Center,Fort Collins,Colorado,50 pp,http://www.cloudsat.cira.colostate.edu/.
Yuan,T.L.,and L.Oreopoulos,2013:On the global character of overlap between low and high clouds. Geophys.Res.Lett.,40,5320-5326.
Zhang Hua and Jing Xianwen,2010:Effect of cloud overlap assumptions in climate models on modeled earth-atmosphere radiative field.Chinese J.Atmos. Sci.,34,520-532.(in Chinese)
Zhang Hua,Ma Jinghui,and Zheng Youfei,2010:Modeling study of the global distribution of radiative forcing by dust aerosol.Acta Meteor.Sinica,24,558-570.
Zhang Hua,Peng Jie,Jing Xianwen,et al.,2013:The features of cloud overlapping in eastern Asia and their effect on cloud radiative forcing.Sci.China(Earth Science),56,737-747.(in Chinese)
Zhang Hua,Yang Bingyun,Peng Jie,et al.,2015:The characteristics of cloud microphysical properties in East Asia with the CloudSat dataset.Chinese J. Atmos.Sci.,39,235-248.(in Chinese)
Zhao Gaoxiang and Wang Hongqi,1994:Cloud and radiation(II):Cloud and cloud radiation parameterizations in general circulation models.Chinese J. Atmos.Sci.,18,933-958.(in Chinese)
L¨u Qiaoyi,Li Jiming,Wang Tianhe,et al.,2015:Cloud radiative forcing induced by layered clouds and associated impact on the atmospheric heating rate.J.Meteor.Res.,29(5),779-792,
10.1007/s13351-015-5078-7.
(Received April 30,2015;in final form July 31,2015)
猜你喜欢
杂志排行

Journal of Meteorological Research的其它文章
- Interannual Variability of the Wintertime Northern Branch High Ridge in the Subtropical Westerlies and Its Relationship with Winter Climate in China
- Analysis of Tibetan Plateau Vortex Activities Using ERA-Interim Data for the Period 1979-2013
- A Piecewise Modeling Approach for Climate Sensitivity Studies:Tests with a Shallow-Water Model
- Characteristics and Mechanisms of the Sudden Warming Events in the Nocturnal Atmospheric Boundary Layer:A Case Study Using WRF
- A New Evaporation Duct Climatology over the South China Sea
- Dust Aerosol Effects on Cirrus and Altocumulus Clouds in Northwest China