Relation between Economic Development Level and Resource and Environment Carrying Capacity of Central Area of Yunnan Province Based on Decoupling Analysis
2015-11-08ChaoCHENGShaoyuTONGHaiyingPENGShaokaiYANLingLlU
Chao CHENG,Shaoyu TONG,Haiying PENG,Shaokai YAN,Ling LlU
Institute of Land&Resources and Sustainable Development,Yunnan University of Finance and Economics,Kunming 650221,China
Relation between Economic Development Level and Resource and Environment Carrying Capacity of Central Area of Yunnan Province Based on Decoupling Analysis
Chao CHENG,Shaoyu TONG*,Haiying PENG,Shaokai YAN,Ling LlU
Institute of Land&Resources and Sustainable Development,Yunnan University of Finance and Economics,Kunming 650221,China
Based on the decoupling theory and method,an indicator system was built for the relation between economic development level and resource and environment carrying capacity.And the study was carried out on decoupling degree and temporal changes of economic development level and resource and environment carrying capacity in the central area of Yunnan Province.Results indicated that(i)the economic development level and resource and environment carrying capacity in the central area of Yunnan Province mainly experienced strong decoupling,weak decoupling,and expansive negative coupling,and in general it was strong decoupling,and it took on reverse"N"in temporal changes.(ii)Change rate of economic development level in the central area of Yunnan Province was greater than zero,but the amplitude of change was not large,while the change rate of resource and environment carrying capacity was negative in 2007-2008,and it was positive in the rest years;from 2007,it took on gradual expansion trend,and scissors difference gradually increased after experiencing reverse"V"change.(iii)The strong decoupling was the main situation and it reached the peak value in T5 period and T6 period.
The central area of Yunnan Province;Economic development level;Resource and environment carrying capacity;Decoupling analysis;Scissors difference
S ince the reform and openingup,China’s economic development level has been improving rapidly.However,with deepening of reform and opening-up,both resource and environment are facing serious challenges of resource consumption,ecological disruption,carrying pressure,and environmental pollution generated from economic growth.Therefore,properly treating the relation between stabilizing economic development and raising environment carrying capacity directly determines stability and health of the three systems,society,economy and ecology.
In recent years,some domestic scholars applied the decoupling index calculation model proposed by OECD[1]and criteria of decoupling elastic put forward by Tapio et al.[2]in the quantitative evaluation of the relation between economic growth and resource and environment.Gai Mei et al.[3]made decoupling analysis on environmental pressure and economic development of the Yangtze River Delta by decoupling theory and improved decoupling criteria.Zhao Xingguo et al.[4],based on Outlook of Scientific Development,established decoupling criteria,and made a quantitative analysis on decoupling degree of economic growth from resource and environment pressure in Yunnan Province in 1998-2008.At present,there are many similar researches,but there are still drawbacks.(1)Using single indicator like GDP to characterize economic development situation is difficult to comprehensively reflect the relationbetween economic development level and environment carrying capacity,thus,it is necessary to establish a better indicator system.(2)There are insufficient researches in temporal changes and spatial pattern changes ofdecoupling analysis;especially,there are few researches about the relation between the economic development level and environment carrying capacity.
In view of these,we introduced the decoupling theory and criteria for decoupling degree.Taking the central area of Yunnan Province of 2006-2013 as research object,we established an indicator system to comprehensively reflect the relation between economic system and resource and environment carrying capacity,and analyzed the temporal changes of decoupling through calculating change rate and scissors difference of economic development level and environment carrying capacity,in order to prevent theoretical reference for realizing ecological,economic,and environmental protection legislation in the central area of Yunnan Province.
Research Method and lndicator System
Decoupling analysis model of economic development level and environment carrying capacity
Based on decoupling theory and method[5-6],the calculation formula for decoupling of economic development and resource and environment carrying capacity is as follows:
whereθis decoupling index;Δu1andΔu2signify economic development level and elastic value of resource and environment carrying capacity respectively;u1startandu1enddenote overall indicator of economic development level in the start year and end year of the i-th period;u2startandu2enddenote overall indicator of resource and environment carrying capacity in the start year and end year of the i-th period.
Considering changes in economic development level and resource and environment carrying capacity,according to studies of Gai Mei[3],we took 0.25 and 0.75 as division criterion of decoupling degree.
Establishing the evaluation indicator system
lndicator selection With reference to relevant research findings,on the scientific,overall and operable principles,we established an indicator system including 5 criteria indicators and 16 individual indicators.The indicator system consists of two evaluation hierarchies,economic development level and resource and environment carrying capacity.The economic development level evaluation hierarchy includes economic structure,economic scale,and economic benefit criterion hierarchies.The economic structure indicator hierarchy includes the percentage of primary industry and percentage of industry in gross output value of industry and agriculture;economic scale includes per capita GDP,economic density,fixed assets investment of state-owned economy;economic benefitincludes percapita added value of agriculture,forestry,animal husbandry and fishery,total retail sales of consumer goods,and average gross industrial output value of land.The resource and environment carrying capacity evaluation hierarchy includes resource carrying and environment carrying criterion hierarchies. Specifically,the resource carrying includes population density,per capita grain yield,average water producing capacity of land,and per capita resource carrying capacity;environment carrying capacity includes atmospheric environment capacity,water environment capacity,green coverage area,and environment capacity abundance index.
Determination of indicator weight
Reasonable allocation of weight is a key factor for quantifying the indicator system.To improve the objectiveness and accuracy of weight,we firstly established judgment matrix by analytic hierarchy process (AHP),calculated weightαwof each indicator[16],made entropy correction,and calculated the overall weight.
Decoupling change trend and analysis model of economic development level and environment carrying capacity
Analysis of change rate Based on data of time series,we simulated change trend of economic development level and resource environment carrying capacity through fitting polynomial regression curve,to reflect change trend and speed of economic development level and resource and environmentcarrying capacity with time.The formula is as follows[9]:
Using the tangential slope to characterize the change rate of economic development level and resource and environment carrying capacity change curve in a certain time(t),namely,the partial differential y′u1(t)and y′u2(t)of yu1and yu2in time t.
Analysis of scissors difference
We used the scissors difference model to reflect change trend and difference of economic development level and resource and environmentcarrying capacity, and studies temporal changes in decoupling of economic development level and resource and environment carrying capacity.The formula is as follows[9]:
whereαdenotes the scissors difference between changes in economic development level and resource and environment carrying capacity,y′u1(t)and y′u2(t)are changes rate of them in time t.
Results and Analyses
Decoupling degree and temporal changes of economic development level and resource and environment carrying capacity in the central area of Yunnan Province
Calculating relevant data as per formula(1)through formula(4),we obtained the table for decoupling degree of economic development level and resource and environment carrying capacity in the central area of Yunnan Province,as listed in Table 1.From the table,we are known that there is great difference in decoupling degree of economic development level and resource and environment carrying capacity in the central area of Yunnan Province.It mainly takes on threetrends:strong decoupling,weak decoupling,and expansive negative coupling.In general,it was strong decoupling and characterized as economic development level is constantly rising,while resource and environment carrying capacity is constantly declining. This indicates that the central area of Yunnan Province still realizes rapid economic development at the sacrifice of resource and environment.As to the change trend of decoupling index,the decoupling index generally takes on inclined reverse"N".On the whole,it shows three fluctuation stages:T1 to T3,T4 to T5,and T6 to T7.In T1 to T3 period,it remained strong decoupling,showing economy was constantly growing,while resource and environment carrying capacity suffered negative growth,which is not ideal state in economic development;in T3 to T5 period,both the economy and resource and environment carrying capacity showed growth,decoupling index was obviously rising and reached the peak value in T5 period,indicating thatthe centralarea ofYunnan Province was stepping the track of transforming economic development mode;in T6 to T7 period,the decoupling index declined and resource and environmentcarrying capacity has slight increase,but the conflict between economic growth and resource and environment carrying capacity still should not be neglected.
Decoupling changes of economic developmentleveland resource and environment carrying capacity in the centralarea ofYunnan Province
Taking comprehensive indicator values of economic development level and resource and environment carrying capacity in the central area of Yunnan Province in 2006-2013 in Table 1 as samples,we fitted change trends in economic development level and resource and environment carrying capacity in the central area of Yunnan Province using formula(5)and formula(6).The degree of fitting is 0.9876 and 0.8333 respectively.Also,we calculated change rate and scissors difference of economic development level and resource and environment carrying capacity in the central area of Yunnan Province.In 2006-2013,change rate of economic development level in the central area of Yunnan Province was positive but the amplitude of change was not big,indicating that economic level in the central area of Yunnan Province constantly grew butthe growth rate slowed down;change rate of resource and environment carrying capacity took on reverse v,and it was negative in 2007-2008,but positive in rest years,it reached the lowest value(-0.079 7)in 2007,and it gradually expanded from 2007, indicating change trend and speed of resource and environment carrying capacity in the central area of Yunnan Province were accelerating and rising with the elapse of time.The scissors difference took on reverse V change in 2006-2009,but kept constant growth from 2009,and the tangent slope of economic development level was obviously higher than the economic development level and took on expansion trend,indicating that the difference of change trend in economic development level and resource and environment carrying capacity will be further expanded.The above analysis indicated that the economic development level in the centralarea ofYunnan Province was rising on the whole in 2006-2013,showing excellent economic development situation.However,from the change trend of resource and environment carrying capacity and scissors difference,the pressure of economicdevelopmenton resource and environment gets alleviated,but the impact is still very high.
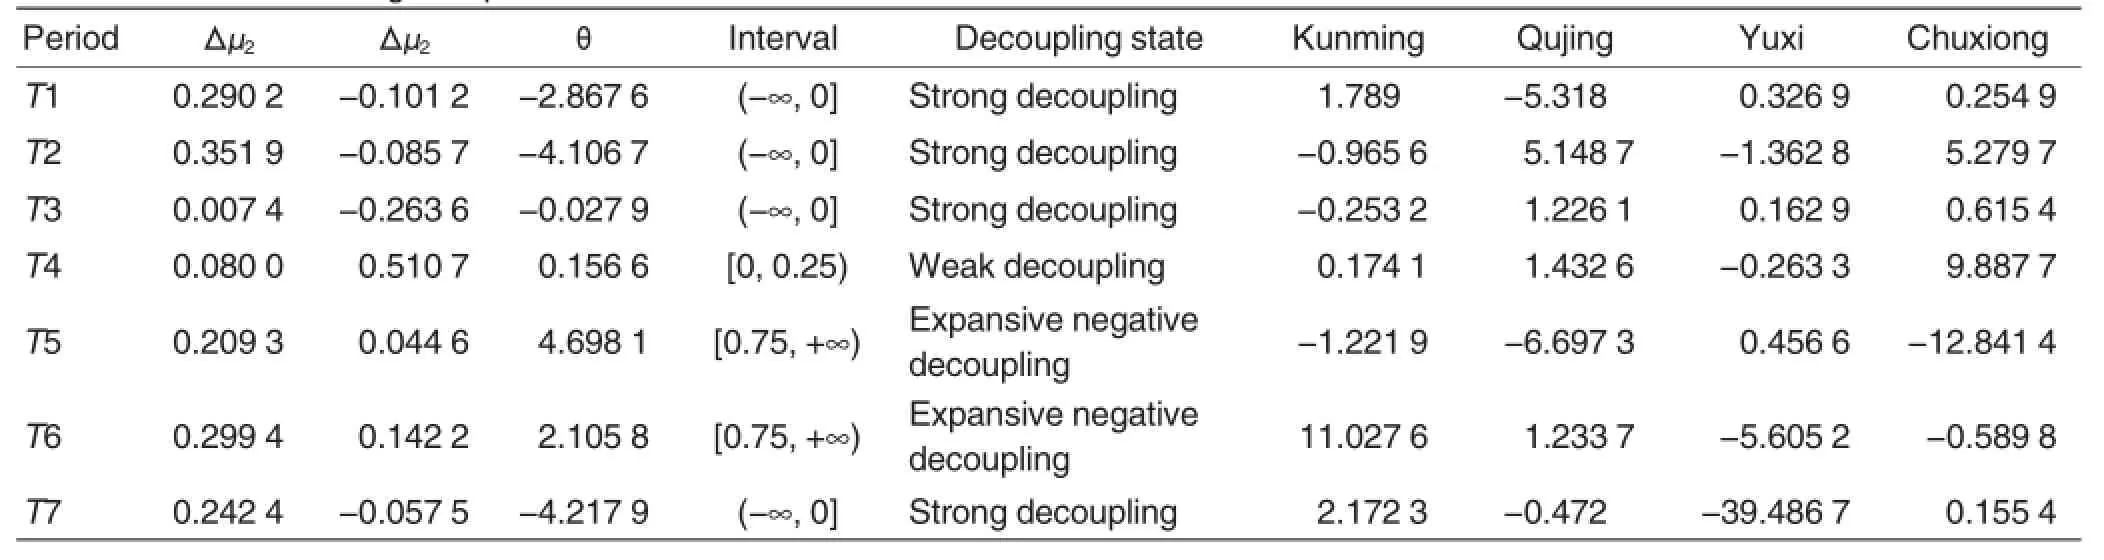
Table 1 Decoupling index of economic development level and resource and environment carrying capacity in the central area of Yunnan Province and regional prefectures and cities
Decoupling degree and temporal changes of economic development level and resource and environment carrying capacity in prefecture and cities in the central area of Yunnan Province
From Table 1,it can be known that four prefectures and cities in the central area of Yunnan Province remained in T1 to T7 period,strong decoupling accounted for 46.43%of the entire research period;all experienced strong decoupling state and it took on fluctuation on the whole,showing the economic development level was constantly growing in the recent 8 years,while resource and environment carrying capacity declined;the expansive negative decoupling accounted for 21.43%in the entire period,indicating both economic development level and resource and environmentcarrying capacity were growing and the economic growing speed was obviously higher than that of resource and environmentcarrying capacity on the whole.Through fitting the decoupling index curve of four prefectures and cities in the central area of Yunnan Province,the decoupling index took on fluctuation,rising and decline,but all reached the peak value in T5 period or T6 period,indicating that the impact of economic development level of four prefectures and cities was the greatest on resource and environment carrying capacity in 2005-2007.
The decoupling state of economicdevelopment level and resource and environment carrying capacity of Kunming City in recent 8 years took on W fluctuation trend and experienced dynamic changes from expansive negative decoupling,strong decoupling,expansive coupling,to recessive decoupling.In T1 to T7 period,strong decoupling accounted for 42.86%of the research period,indicating rise of economic development level of Kunming City had impact on resource and environment carrying capacity all the time,it grew firstly by a small margin and declined,and then grew by a large margin.Qujing City basically experienced M shape dynamic change from expansive negative decoupling,strong decoupling,weak decoupling,and recessive decoupling in T1 to T7 period. Except T1 to T2 period and T6 to T7 period,it took on decline trend,firstly by a large margin,and then by a small margin.With 2008 as the critical point,the elastic of economic development level dropped from 1.319 0 in T2 period to-0.169 2 in T3 period.The decoupling index change of Yuxi City was steady,from expansive coupling,weak negative decoupling to strong decoupling.The decoupling index was in the range of-1.362 8 to 0.162 9 in T1 to T5 period;in T6 to T7 period,it dropped rapidly and the lowest value was-39.486 7;except T1 period and T5 period,the elastic of resource and environmentcarrying capacity was negative and it took on decline trend on the whole.The change trend of decoupling index of Chuxiong Prefecture was obvious.Except in T5 and T6 period,it was positive and large on the whole;it reached the peak value 9.887 7 in T4 period,and reached the valley value-12.841 4 in T5 period.As a typical city with large area but slow economic development in Yunnan Province,Chuxiong Prefecture had elastic of economic development level in the range of-0.245 6 to 0.689 9.It experienced expansive coupling,expansive negative decoupling,recessive coupling,and strong decoupling,showing alternate change of decoupling of economic development level and resource and environment carrying capacity in this period.
Conclusions and Discussions
Conclusions
(1)As to overall situation of the region,the economic development level and resource and environment carrying capacity in the central area of Yunnan Province mainly experienced strong decoupling,weak decoupling,and expansive negative coupling,and in general it was strong decoupling,and it took on reverse“N”in temporal changes in T1 to T3 period,T4 to T5 period,and T6 to T7 period.(2)As to temporal change trend of decoupling,change rate of economic development level in the central area of Yunnan Province was greater than zero,but the amplitude of change was not large,while the change rate of resource and environmentcarrying capacitywas negative in 2007-2008,and it was positive in the rest years;from 2007,it took on gradual expansion trend,and scissors difference gradually increased after experiencing reverse V change in 2006-2009.(3)The strong decoupling was the main situation(accounting for 46.43%of the whole research period)and it reached the peak value in T5 period and T6 period.
Discussions
Firstly,due to limitation of data availability and continuity,we lack long-term panel data in this study.As a result,it is difficult to characterize development situation of the study region.Thus,it is necessary to make further long time series analysis and prediction study.Secondly,in the building and selection of indicator system,considering the wide application of future economic development to difference indicators of natural environment,it is recommended to establish an indicator system that comprehensively depicts the connotation of economic development level and resource and environment carrying capacity.Thirdly,criteria for decoupling degree lack dynamic and relative features.Especially,the base value is different in economic development level and resource and environment carrying capacity of all regions.Withoutreasonable division combining regionalrealities,itwill greatly influence the determination of decoupling relation between economic development level and resource and environment carrying capacity.
[1]OECD.Decoupling:A conceptual overview[R].Paris:OECD,2001.
[2]Taio Petri.Toward a theory of coupling: Degrees of decoupling in the EU and the ease of road traffic in Finland between 1970 and 2001[J].Journal of transport policy,2005(12):137-151.
[3]GAI M(盖美),HU HA(胡杭爱),KE LN(柯丽娜).Decoupling analysis between economic development and resources and environmental of the Yangtze River Delta(长江三角洲地区资源环境与经济增长脱钩分析)[J].Journal of Natural Resources(自然资源学报).2013,28(2):185-198.
[4]ZHAO XG(赵兴国),PAN YJ(潘玉君),ZHAO QY (赵庆由),et al.Decoupling analysis between regionaleconomic growth and resources and environmental pressure based on view of scientific development:A case study of Yunnan Province(科学发展视角下区域经济增长与资源环境压力的脱钩分析——以云南省为例)[J].Economic Geography(经济地理).2011,31(7):1196-1201.
[5]YANG K(杨克),CHEN BM (陈百明),SONG W (宋伟).Decoupling analysis between arable land occupation and GDP growth in Hebei Province(河北省耕地占用与GDP增长的脱钩分析)[J]. Resources Science (资源科学).2009,31(11):1940-1946.
[6]SONG W (宋伟),CHEN BM (陈百明),CHEN XW(陈曦炜).Decoupling evaluation between cultivated land occupation and economic growth in Changshu City(常熟市耕地占用与经济增长的脱钩 评 价 )[J].Journal of Natural Resources(自然资源学报),2009,24(9): 1532-1540.
[7]XU JH(徐建华).Mathematical Methods in Contemporary Geography(现代地理学中的数学方法)[M].Beijing:China Higher Education Press(高等教育出版社),2002.
[8]SHANG ZY(尚正永).Evaluation on spatial differentia of sustainable use of land resources in arid and semiarid regions-A case of Gansu Province(干旱地区土地资源可持续利用空间差异的评价:以甘肃省为例)[J].AridZoneResearch(干旱区研究),2006,23(1):149-154.
[9]FU HY(符海月),LI MC(李满春),MAO L(毛亮),et al.Quantitative analysis of ecological effects of general land use planning based on ecological footprint: A case study in Langfang City(基于生态足迹的土地利用规划生态成效定量分析——以河北省廊坊市为例).[J]Journal of Natural Resources(自然资源学报),2007,22(2):225-235.
Responsible editor:Huadong GUO
Responsible proofreader:Xiaoyan WU
基于脱钩分析的云南省滇中地区经济发展水平与资源环境承载力的关系研究
程 超,童绍玉*,彭海英,闫少凯,刘玲 (云南财经大学国土资源与持续发展研究所,云南昆明 650221)
基于脱钩理论和方法,构建经济发展水平与资源环境承载力关联的指标体系,对2006~2013年滇中地区经济发展水平和环境承载力的脱钩程度、时序变化进行研究。结果表明:(1)滇中地区整体的经济发展水平与资源环境承载力主要经历强脱钩、弱脱钩以及扩张负脱钩,总体上处于强脱钩,时序上呈现反向"N"型变化;(2)滇中地区经济发展水平变化率均大于零,但变化幅度不大,而资源环境承载力变化率2007~2008年间为负值,其余年份均为正值,并从2007年呈逐渐扩大趋势,剪刀差经历倒"V"型变化后逐渐增长;(3)各州市经济发展水平与资源环境承载力脱钩程度及时序呈现波动变化,强脱钩状态居多,且均在T5或T6时期达到最高值。
滇中地区;经济发展水平;资源环境承载力;脱钩分析;剪刀差
云南省教育厅科学研究基金项目(2015J088)。
程超(1992-),男,安徽芜湖人,硕士研究生,研究方向:土地资源与土地利用规划,E-mail:chengchao19921105@126.com。*通讯作者,E-mail:tongsy@cxtc.cdu.cn。
2015-10-21
Supported by Scientific Research Foundation of Yunnan Provincial Department of Education(2015J088).
*Corresponding author.E-mail:tongsy@cxtc.cdu.cn
Received:October 21,2015 Accepted:November 25,2015
修回日期 2015-11-25
猜你喜欢
杂志排行
Agricultural Science & Technology的其它文章
- An lnnovative Strategy for Reciprocal Distant Hybridization between Spartina alterniflora and Rice
- Study on Absorptive Capacity to Formaldehyde and Physiological and Biochemical Changes of Scindapsus aureus Based on the Regulation of LaCl3
- Dynamic Variation in Sugar,Acid,and ASA Contents of‘Ganmi 6’Kiwifruit(Actinidia eriantha Benth)Fruits
- Construction and Development of GMS Agricultural lnformation Network Based on Stakeholder Analysis
- Effects of Different Decolorants on Retention Rate of Total Triterpenes in Fruit and Rattan Stems of Schisandra chinensis(Turcz.)Baill
- Determination of Heavy Metals inDendrobium candidiumWall.ex Lindl.by lCP-MS