食用香精相对密度不确定度评估的研究
2015-10-21荆学铭王春花乌燕郑晓钰
荆学铭,王春花,乌燕,郑晓钰
(内蒙古蒙牛乳业包头有限责任公司检验处,内蒙古包头014030)
食用香精相对密度不确定度评估的研究
荆学铭,王春花,乌燕,郑晓钰
(内蒙古蒙牛乳业包头有限责任公司检验处,内蒙古包头014030)
通过建立采用香料相对密度的测定GB/T 11540-2008中的检验方法测定的不确定度评定的模型,对检测过程中可能引入的不确定度来源进行了分类和量化,较为全面的评定了各个不确定度分量,并提出了应用该方法检测的不确定度评定结果。分析了香料相对密度的不确定度的分量及其来源,并通过计算各分量的不确定度得出检测结果的合成标准不确定度。香精的相对密度为1.043 6,扩展不确定度U=0.003 6,置信水平P=95%,k=2。不确定度的主要来源为仪器本身偏差的影响、比重瓶的示值误差、重复性测量的影响、方法复现性的影响,保证检测过程其它干扰因素,保证检测过程中的准确性。
香料;相对密度;不确定度
1实验部分
1.1 依据[1]
检测香料相对密度依据GB/T 11540-2008《香料相对密度的测定》。
1.2 方法原理[1]
在一定温度(t℃)下先后称量密度瓶内同体积的香料和水的质量。
1.3 仪器设备
50 mL附温比重瓶厂家:上海市崇明建设玻璃仪器厂。
2方法概要[1]
取干净干燥的比重瓶,当天平室的温度与比重瓶的温度达到一致时称取比重瓶的质量m0,将比重瓶注满水,将比重瓶放入水浴中使温度达到测定样品所需的温度,用滤纸擦干外壁,当天平室温度与比重瓶温度达到平衡时,称取瓶加水的质量m1,将比重瓶倒空清洗干燥,用试样代替蒸馏水按照上述方法检测比重瓶加试样的质量m2。
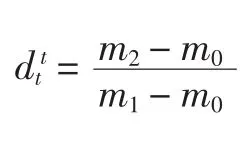
3数学模型[1]

式中:m0为比重瓶质量,g;m1为瓶加水的质量,g;m2为瓶加试样的质量,g。
4仪器设备[1]
1)天平,(0~210)g,线性±0.3 mg;
2)A级比重瓶,25 mL,示值误差△=±0.1 mL。
5测量结果
测量10次的平均数值作为结果:1.043 6。
6不确定度分量的识别、分析、量化[2-3]
6.1 因果图

6.2 总重复性u(r)[2-3]
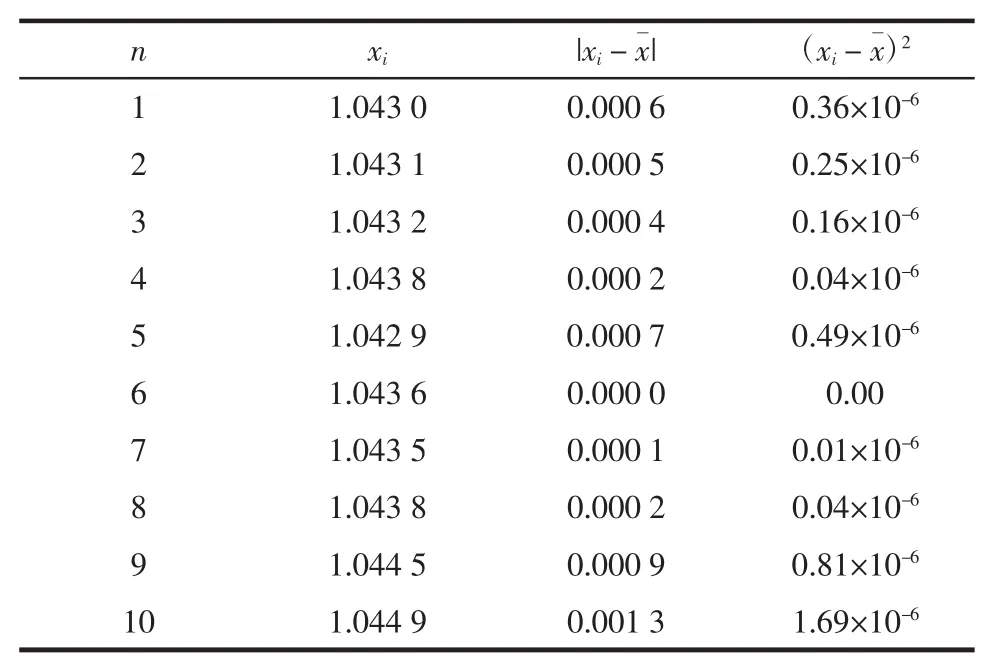
6.2.1 样品测量10次得到下列数据

表1 重复性测量的不确定度测量结果Table 1Repeatability measurement uncertainty of measurement results
6.3 仪器的示值误差u(x)[2-3]
校准证书给出天平线性误差为±0.3 mg,表示实际质量与读数的最大差值。假定为矩形分布,
6.4 容体积的标准不确定度u(p)[2-3]
包括校准u1(p)(8.3.1)温度影响u2(p)(8.3.2)。
6.4.1校准u1(p)
证书提供25 mL A级容量瓶的示值误差△= ±0.1 mL,三角分布分布
6.4.2 温度影响u2(p)
定容及溶液的温度与校准温度(20℃)不同。实验室全年温度控制在27℃,矩形分布,水的膨胀系数为2.1×10⁻⁴/℃,标准不确定度。

6.4.3 相对标准不确定度

7合成标准不确定度uc(y)[2-3]

8扩展不确定度U[2-3]
取包含因子k=2,置信概率为95%。U=k×uc(y)= 2×0.001 8=0.003 6
9检测结果报告
香精的相对密度为1.043 6,扩展不确定度U= 0.003 6,K=2。
10结论
对外出具报告的准确性尤为重要,检验室必须正确地全面地分析并评定测量不确定度,保证其出具结果准确可靠。
[1]中华人民共和国国家质量监督检验检疫总局及中国国家标准化管理委员会GB/T 11540-2008《香料相对密度的测定》[S].北京:中国标准出版社,2008
[2]国家质量监督检验检疫总局发布JJF1059.1-2012测量不确定度的评定与表示[S].北京:中国标准出版社,2013
[3]国家质量技术监督局发布JJF1135-2005化学分析测量不确定度评定[S].北京:中国标准出版社,2005
Study on the Flavor of Relative Density of Uncertainty Evaluation
JING Xue-ming,WANG Chun-hua,WU Yan,ZHENG Xiao-yu
(Inspection Department of Inner Mongolia Mengniu Dairy Baotou Co.,Ltd.,Baotou 014030,Inner Mongolia,China)
Through the evaluation of uncertainty in determination of spice model of determination of relative density of GB/T in 11540-2008 test methods established for the possibility of introducing the detection process,the sources of the uncertainty were classified and quantified,comprehensive evaluation of each component of uncertainty,and the uncertainty evaluation of detection results of applying this method the.The experimental analysis of the uncertainty components and sources of spices,relative density,and by calculating the components of the uncertainty of the results obtained combined standard uncertainty.The relative density of essence was 1.043 6,the expanded uncertainty of the confidence level of U=0.003 6,P=95%,k=2.The main sources of uncertainty for the instrument itself bias,pycnometer indication error.The measurement repeatability,reproducibility of methods of other interference factors,ensure the detection process,to ensure the accuracy of detection process.
spices;relative density;uncertainty
10.3969/j.issn.1005-6521.2015.09.007
2014-07-30
荆学铭(1985—),女(汉),助理工程师,学士,主要研究方向:食品检测与管理。
