Radiolig and saturation binding for quantitative analysis of ligand-receptor interactions
2015-08-08ChengyanDongZhaofeiLiuFanWangInterdisciplinaryLaboratoryInstituteofBiophysicsChineseAcademyofSciencesBeijing000China
Chengyan Dong,Zhaofei Liu,Fan Wang,✉Interdisciplinary Laboratory,Institute of Biophysics,Chinese Academy of Sciences,Beijing 000,China
2Medical Isotopes Research Center and Department of Radiation Medicine,School of Basic Medical Sciences,Peking University,Beijing 100191,China
PROTOCOL
Radiolig and saturation binding for quantitative analysis of ligand-receptor interactions
Chengyan Dong1,Zhaofei Liu2,Fan Wang1,2✉1Interdisciplinary Laboratory,Institute of Biophysics,Chinese Academy of Sciences,Beijing 100101,China
2Medical Isotopes Research Center and Department of Radiation Medicine,School of Basic Medical Sciences,Peking University,Beijing 100191,China
Received:10 November 2015/Accepted:20 December 2015/Published online:14 February 2016
The reversible combination of a ligand with specifc sites on the surface of a receptor is one of the most important processes in biochemistry.A classic equation with a useful simple graphical method was introduced to obtain the equilibrium constant,Kd,and the maximum density of receptors,Bmax.The entire125I-labeled ligand binding experiment includes three parts:the radiolabeling,cell saturation binding assays and the data analysis.The assay format described here is quick,simple,inexpensive,and effective,and provides a gold standard for the quantifcation of ligand-receptor interactions.Although the binding assays and quantitative analysis have not changed dramatically compared to the original methods,we integrate all the parts to calculate the parameters in one concise protocol and adjust many details according to our experience.In every step,several optional methods are provided to accommodate different experimental conditions.All these refnements make the whole protocol more understandable and user-friendly.In general,the experiment takes one person less than 8 h to complete,and the data analysis could be accomplished within 2 h.
Equilibrium constant,Maximum density of receptors,Saturation binding assays,I-125 labeling, Radioligand
INTRODUCTION
Research on receptors has developed very quickly in the past few decades.The interactions between ligands and receptors generate and enhance signals for recognition, feedback and crosstalk in cells(Klotz 1985;Wilkinson 2004).Receptors are divided into two groups by their location:in the membrane or the nucleus.Hormones and transmitters can selectively recognize and bind to receptors to accomplish a biological process.Many drugs are designed and improved based on utilizing the ligand-receptor interaction.
Radioligand binding is widely used to defne receptor function at the molecular level.The frst radiolabeled binding assay was developed during the 1960s(Maguire et al.2012).This radiolig and binding assay(RBA) remains the most sensitive quantitative approach to measuring binding parameters in vitro,even in low receptor-expression cells(Rovati 1993;Keen 1995). Since the 1970s,the application of RBA has developed rapidly,with better receptor preparations,more radiolabeled ligands and higher radioactivity.Currently, appropriate ligands radiolabeled with tritium or iodine are available for the study of many receptors,including adrenergic,cholinergic,dopaminergic,serotonergic,and opiate receptors(Tallarida et al.1988).This widespread availability has led to a rapid growth in the use of radiolig and binding assays to characterize novel receptors and receptor subtypes and determine their anatomical distribution,and these assays play a vital role in the development of drugs by the pharmaceutical industry (Bylund and Toews 1993;Carpenter et al.2002).
Unlabeled ligands require a radioactive isotope to be incorporated into the molecule.It is occasionally necessary to modify the structure of the ligands to provide a suitable site for radiolabeling.However,it is imperative that the selectivity and specifcity of the ligand be retained after the modifcation and radiolabeling.Two basic parameters of this binding site can be studied by kinetic and saturation analysis:the affnity of the ligand for its recognition site,the Kd,and an estimate of the number of binding sites in a given tissue,the Bmax(Williams and Jacobson 1990).The Kdis the equilibrium dissociation constant,which is the concentration of ligand that will occupy 50% of the receptors.The generally accepted standard is that a ligand-receptor binding with a Kdof 1 nmol/L or less has a high affnity,whereas ligands binding with a Kdof 1 μmol/L or more have low affnity(Davenport and Russell 1996).Bmaxsignifes the maximum density of receptors.This value is unique to a particular tissue in the binding assay,and it is usually corrected using the amount of protein or cells present.
MECHANISM OF ACTION
Analysis of radioligand binding experiments is based on a simple model;the law of mass action that describes the interaction between one molecule of ligand and one receptor molecule.For example,a neurotransmitter binds to the synaptic receptor to initiate the neurobiological process,or an antibody binds to an antigen to initiate the immunological response.In the simplest and most common case,this is a bimolecular reaction between a ligand and a receptor.This model assumes that binding is reversible (Anderson 1994).

where[R]is the concentration of free receptor,[L]is the concentration of free ligand,[RL]is the concentration of the complex,k1is the association rate constant,and k2is the dissociation rate constant,

The density of unbound receptors[R]and ligands[L] cannot be determined but could be given:

Hence,Eq.2 could be rearranged to:

For further analysis,[SB]could represent the concentration of ligand bound to the receptor,[F]represents the concentration of unbound ligand or‘‘free’’ligand,and Bmaxrepresents the greatest attainable concentration of bound ligand:
Thus,a plot of fractional[SB]/[F]vs.[RL]will give the basic information of the ligand-receptor interactions,known as a‘‘Scatchard plot’’.An alternative is the Woolf plot,a plot of fractional[F]/[SB]vs.[L]:

APPLICATIONS AND LIMITATIONS
Radioligand-binding techniques are applicable to any receptor of interest,provided it has a relative ligand that could selectively bind the receptor and be labeled with radioactive isotopes.Antibodies,proteins and peptides that contain Tyr could easily be labeled with iodine. Radioligands provide precise probes to quantify the initial interaction between ligands and receptors.For example,the kinetics of the association and dissociation of radioligands can be accurately examined from a simple tissue expressing the specifc target receptors.A series of concentrations of unlabeled ligands could inhibit the forces established between radioligands and receptors,which could be used to measure the equilibrium dissociation constants.Radioligand binding also permits a characterization of receptor subtypes with different affnities and provides an estimate of their relative proportions,especially in the study of central nervous system receptors,where the effects of neurotransmitters are complex,and isolated tissue preparations are unfeasible(Tallarida et al.1988).Radioligand binding assays can also be used to monitor the changes in receptor density,perhaps resulting from the pathologicalconditions of pharmacological intervention.Furthermore, the Scatchard plot is a useful diagnostictool to determine whether more than one ligand moleculesbind to a single receptor (Hollemans and Bertina1975; Rovati 1998). A concave upward plot is indicativeof nonspecific binding, negative cooperativity, or multipleclasses of binding sites. A concave downward plotsuggests either positive cooperativity or instability ofthe ligand (Wilkinson 2004).
However,binding parameters could be affected by many factors including the specifc radioactivity,thetype and ionic strength of the buffer,the presence of divalent ions and the temperature.The results are not suffcient to refect the real physiological response mediated by the receptor in this homogenate preparation,such as minimizing degradation of the ligand (Davenport and Russell 1996).In addition,radiolig and binding assays cannot adequately discriminate between full agonists that elicit maximal physiological responses and partial agonists that cannot elicit a maximal response(Tallarida et al.1988).
SUMMARIZED PROCEDURE
1 Dissolve iodogen in chloroform at a concentration of 2 mg/mL,evaporate the chloroform and make the iodogen-coated tube under an N2stream.
2 Dissolve Protein L in 0.2 mol/L phosphate buffer (pH 7.4)at a concentration of~2 mg/mL.
3 Mix 50 μL Protein L,50 μL PB(0.2 mol/L,pH 7.4) and 50-100 μL Na125I (>40 MBq) in an iodegen-coated tube.Incubate for 7-8 min at room temperature.
4 Remove the reaction mixture from the iodogen tube and purify the radiolabeled protein by size exclusion chromatography using a PD MidiTrap G-25 column.
5 Count the activity in the fnal recovered tube and calculate the specifc activity.
6 Wash two 96-well plates with pre-cooled cellbinding buffer for three times(100 μL each well) and use the vacuum manifold to remove the buffer. Place two 96-well plates for specifc binding and non-specifc binding respectively.
7 From a stock of two million receptorover expressed cells per mL of cell-binding buffer (total volume> 1.5 mL),add 1×10⁵cells (50 μL)each well in the 96-well plate.
8 Prepare three stock solutions of different concentration125I-Protein L(e.g.,0.1,1 and 10 μg/mL)in cell-binding buffer.
9 Add the cells and125I labeled ligand into the plates according to calculation of fnal concentration for each well(N=4),and adjust the total volume to 200 μL per well with cell-binding buffer and incubate for 2 h at 4°C.
10 Use the vacuum manifold to remove the incubation buffer from the plates and wash 5-10 times with cell-binding buffer(100 μL/well).
11 Heat-dry the plates in the dry bath incubator,and collect the membrane from each well into polystyrene culture test tubes.
12 Add 4-7 tubes of standard samples to measure. Then measure the radioactivity on each membrane with a γ-counter.
13 For each experimental measurement,subtract the cpm values of groups.Added activities[TA],total binding activities[TB]and non-specifc binding activities[NSB]could be measured and calculated by the activities on the membranes of plates.
14 Calculate[SB],[LT],[RL],[L]and[F]using these corrected values.
15 Kdvalue and Bmaxcould be calculated by Scatchard Plot,Woolf Plot or the software.
PROCEDURE
Radiolabeled protein preparation [TIMING]~1 h
1 There are two options for labeling the proteins.
(A)OptionA:Chloramine-Tmethod(Hunter
1970;Opresko et al.1980).
i.Dissolve Protein L(see‘‘Reagent setup’’section)in 0.2 mol/L phosphate buffer(pH 7.4) at a concentration of 2 mg/mL.
ii. Mix the following reagents:50 μL Protein L, 50-100 μL Na125I(>40 MBq)and 100 μg Chloramine-T(1 mg/mL in 100 μL 0.2 mol/L PB,pH 7.4).Incubate for 40 s at room temperature.
[CRITICAL STEP]It is highly recommended to limit the reaction time in 1-3 min.
iii.Add 100 μL Na2S2O5(200 μg in ddH2O)and 100 μL 1%KI(1 mg in ddH2O)to the mixture.
(B)Option B:Iodogen method(Bailey 1996).
i.Dissolve Protein L(see‘‘Reagent setup’’section)in 0.2 mol/L phosphate buffer(pH 7.4) at a concentration of~2 mg/mL.
ii. Dissolve iodogen in chloroform at a concentration of 2 mg/mL.Transfer aliquots of 25 μL(50 μg)to a glass-bottomed screw cap vial.Evaporate the chloroform to dryness under an N2stream,leaving a thin coating of iodogen in the tube.Store the desiccated iodogen-coated tubes at -20°C until required for iodination.
iii. Mix 50 μL Protein L,50 μL PB(0.2 mol/L,pH 7.4)and 50-100 μL Na125I(>40 MBq)in an iodogen-coated tube.Incubate for 7-8 min at room temperature.
[CRITICAL STEP]It is highly recommended to maintain the duration of the reaction between 5-10 min.
iv. Remove the reaction mixture from the iodogen tube and apply to purifying.
[CAUTION!]It is imperative to obtain appropriate training from the institutional radiation safety offce before experimenting with radioactivity.Abide by all relevant regulatory rules and use appropriate protection when handling radioactivity.Dispose of the125I-containing radioactive waste according to the institutional radioactive waste disposal guidelines.
2 Purifcation:Purify the radiolabeled protein by size exclusion chromatography using a PD MidiTrap G-25 column.
(A) Preparation and equilibration:Remove the caps and the storage solution.Fill the column with PBS and discard thefow-through. Repeat this procedure twice(three times in total).
(B) Sampleapplication:Add amaximum of 1.0 mL of sample to the column.Apply the sample slowly in the middle of the packed bed and discard the fow through.
(C) Elution:Place a clean tube for sample collection under the column.Elute with 1.5 mL PBS and collect the products.
3 Count the activity in the fnal recovered tube.The specifc activity is calculated as the quotient between the recovered activity and the total amount of protein.This calculation assumes that 100%of the protein added to the iodination was recovered, which is not typical.(Analytical Techniques,T.P. Mommson)

[CRITICAL STEP]To obtain an optimal result,it is suffcient to utilize radioligands with high specifc activity(>20 Ci/mmol).
Saturation binding [TIMING]5-7 h
4 Wash two 96-well plates with pre-cooled cellbinding buffer three times(100 μL each well)and use the vacuum manifold to remove the buffer. One 96-well plate(Plate A)will be used for specifc binding and the other one(Plate B)will be used for non-specifc binding(Cai and Chen 2008).
5 From a stock of two million receptoroverexpressedcells per mL of cell-binding buffer(total volume>1.5 mL),add 1×10⁵cells(50 μL)to each well in the 96-well plate.
6 Prepare three stock solutions of different concentrationsof125I-ProteinL(e.g.,0.1,1and10 μg/mL) in cell-binding buffer.Typically a series of concentrations between 1 ng/200 μL and 1 μg/200 μL will be needed per well.
[CAUTION!]It is imperative to obtain the appropriate preparatory training and abide by all regulatory rules when handling radioactivity.
[?TROUBLESHOOTING]
7 Add the cells and125I-labeled ligand into Plate A following Table 1,and adjust the total volume to 200 μL per well with cell-binding buffer and incubate for 2 h at 4°C.More than four samples are recommended for each concentration.
[?TROUBLESHOOTING]
8 Add the cells,125I-labeled ligands and excess cold Protein L into Plate B following Table 2,and adjust the total volume to 200 μL per well with cellbinding buffer and incubate for 2 h at 4°C as the last step.More than four samples are recommended for each concentration.
[?TROUBLESHOOTING]
9 Use the vacuum manifold to remove the incubation buffer from the 96-well plate and wash 5-10 times with cell-binding buffer(100 μL per well).
10 Heat-dry the 96-well plates in a dry bath incubator until all flter membranes are dry.This usually takes approximately 15 min.

Table 1 Sample addingstrategy in the typical 96-well plate for the specifc binding assay

Table 2 Sample adding strategy in the typical 96-well plate for the non-specifc binding assay
11 Collect the membrane from each well into polystyrene culture test tubes.
12 Add 4-7 tubes of radiolabeled samples(standard samples)to measure.
[PAUSE POINT]The radioactivity on each membrane can be measured later,because125I has a half-life of 60 d.
13 Measure the radioactivity on each membrane with a γ-counter.
Analysis [TIMING]1-2 h
14 For each experimental measurement,subtract the cpm values of the groups.Added activities[TA] could be measured using the standard samples. Total binding activities[TB]and non-specifc binding activities[NSB]could be measured by the activities on the membranes of Plate A and B, respectively.
15 Using Eqs.(5)-(9),calculate [SB],[LT],[RL], [L]and[F]using these corrected values:

16 Kdand Bmaxcould be calculated using a Scatchard plot,Woolf plot or the software.
(A)Option A:Scatchard plot
i. For each point on the concentration,enter [RL]into the X column and the value of [SB]/[F]into the Y column:

ii. All the points are plotted and then linear regression is used to produce the line.
iii. Referring to the Results sheet for the regression analysis,the X-and Y-axis intercepts could be calculated.The X-intercept represents the Bmax,and the Y-intercept represents Bmax/Kd.
(B)Option B:Woolf plot
i. For each point on the concentration,enter [L]into the X column and the value of[F]/ [SB]into the Y column:

ii. All the points are plotted and then linear regression is used to produce the line.
iii. Referring to the Results sheet for theregression analysis, the X- and Y-axis interceptscould be calculated.The X-intercept represents the Kd,and the Y-intercept represents Kd/Bmax.
(C)Option C:Saturation binding curve
i. Create a new project(fle)on Prism(Motulsky 1996).For each point on the saturationbinding curve,enter the concentration of ligand into the X column and[SB]into the Y column.
ii.Select‘‘One site binding’’under the‘‘Nonlinear Regression dialog’’box to analyze the data and produce a binding curve.
iii. Prism displays the best-ft values(Bmaxand Kd)for the binding parameters in the results sheets.
[TIMING]
Step 1-3 Preparation of the125I-Protein L and cold ligands takes approximately 1 h.
Step 4-6 Preparation of the receptor samples takes approximately 1 h.
Step 7-13 The cell-binding assay usually takes 4-6 h,depending on how many samples are used.
Step 13-16 Activity measurements and data analyses take approximately 1-2 h.
[?TROUBLESHOOTING]
Step 6 The presence of certain metal ions(e.g.,Mn2+
and Mg2+)in the cell-binding buffer is
essential for receptor binding.Binding buffer without these ions will result in low counts from the collected membrane.
Step 7 It is necessary to add the cells and buffer with multiple-channel pipettes to reduce the time of this step.It takes practice to become skilled at adding serial concentrations of radioligand and cold ligand.It is important to stay focused and patient.
Step 8 The non-specific binding assay requires a largequantity of the coldligand. Usually the ligands aredifficult to prepare or very expensive. TheScatchard plot and the Woolf plot could becompleted using fewer concentrations and fewerparallel samples. In total, about 20 samples aresufficient for fitting the linear regression.
ANTICIPATED RESULTS
Figures 1 and 2 present typical representative data obtained using the method described here.EGFR overexpressing UM-SCC-22B cells were assayed against the radiolabeled antibody125I-Nimotuzumab.The labeling yield of125I-Nimotuzumab was 97.6%and the radiochemical purity was>98.5%after purifcation(Fig.1). The specifc activity was 24.7 Ci/g.
Figure 2A shows an example of a typical equilibrium saturation curve using the radiolabeled assay with increasing concentrations of125I-Nimotuzumab.Figure 2B shows a typical‘‘Scatchard plot’’.Figure 2C
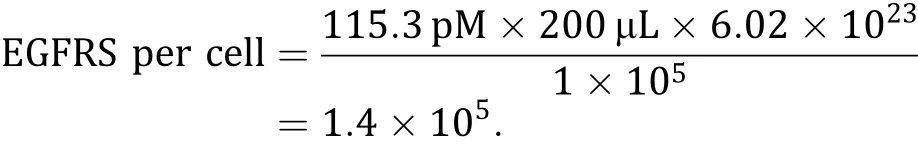
shows a typical‘‘Woolf plot’’.In parallel comparisons from the same data obtained from the binding assays, the Scatchard plot,the Woolf plot and the saturation radioligand-binding curve gave similar estimates of the Kd(7.81,7.935 and 8.095 pL/mol,respectively)and Bmax(113.4,114.5 and 115.3 pmol/L)(Table 3).The average total number of EGF receptors on each UM-SCC-22B cell could be calculated:
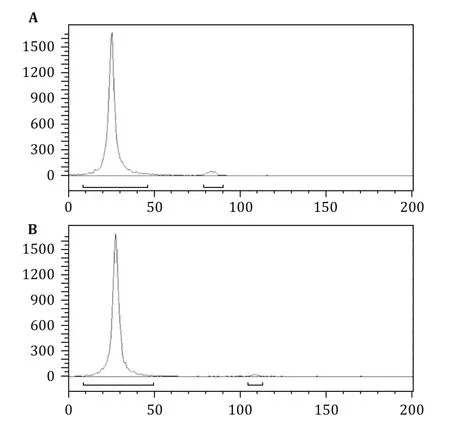
Fig.1 ITLC analysis of125I-labeled Nimotuzumab.The labeling yield of125I-Nimotuzumab was 97.6%,and the radiochemical purity was 98.5%after purifcation
MATERIALS
Reagents
· 0.2 mol/L phosphate buffer,pH 7.4(NaH2PO4·2H2O 0.4063 g,Na2HPO4·12H2O 5.8077 gin 200 mL ddH2O)
· Chloramine-T(100 μg in 0.2 mol/L PB)
· Na2S2O5(200 μg in 100 μL ddH2O)
· KI(1 mg in 100 μL ddH2O)
· Chloroform
· Iodogen(0.5 μg/μL in chloroform)
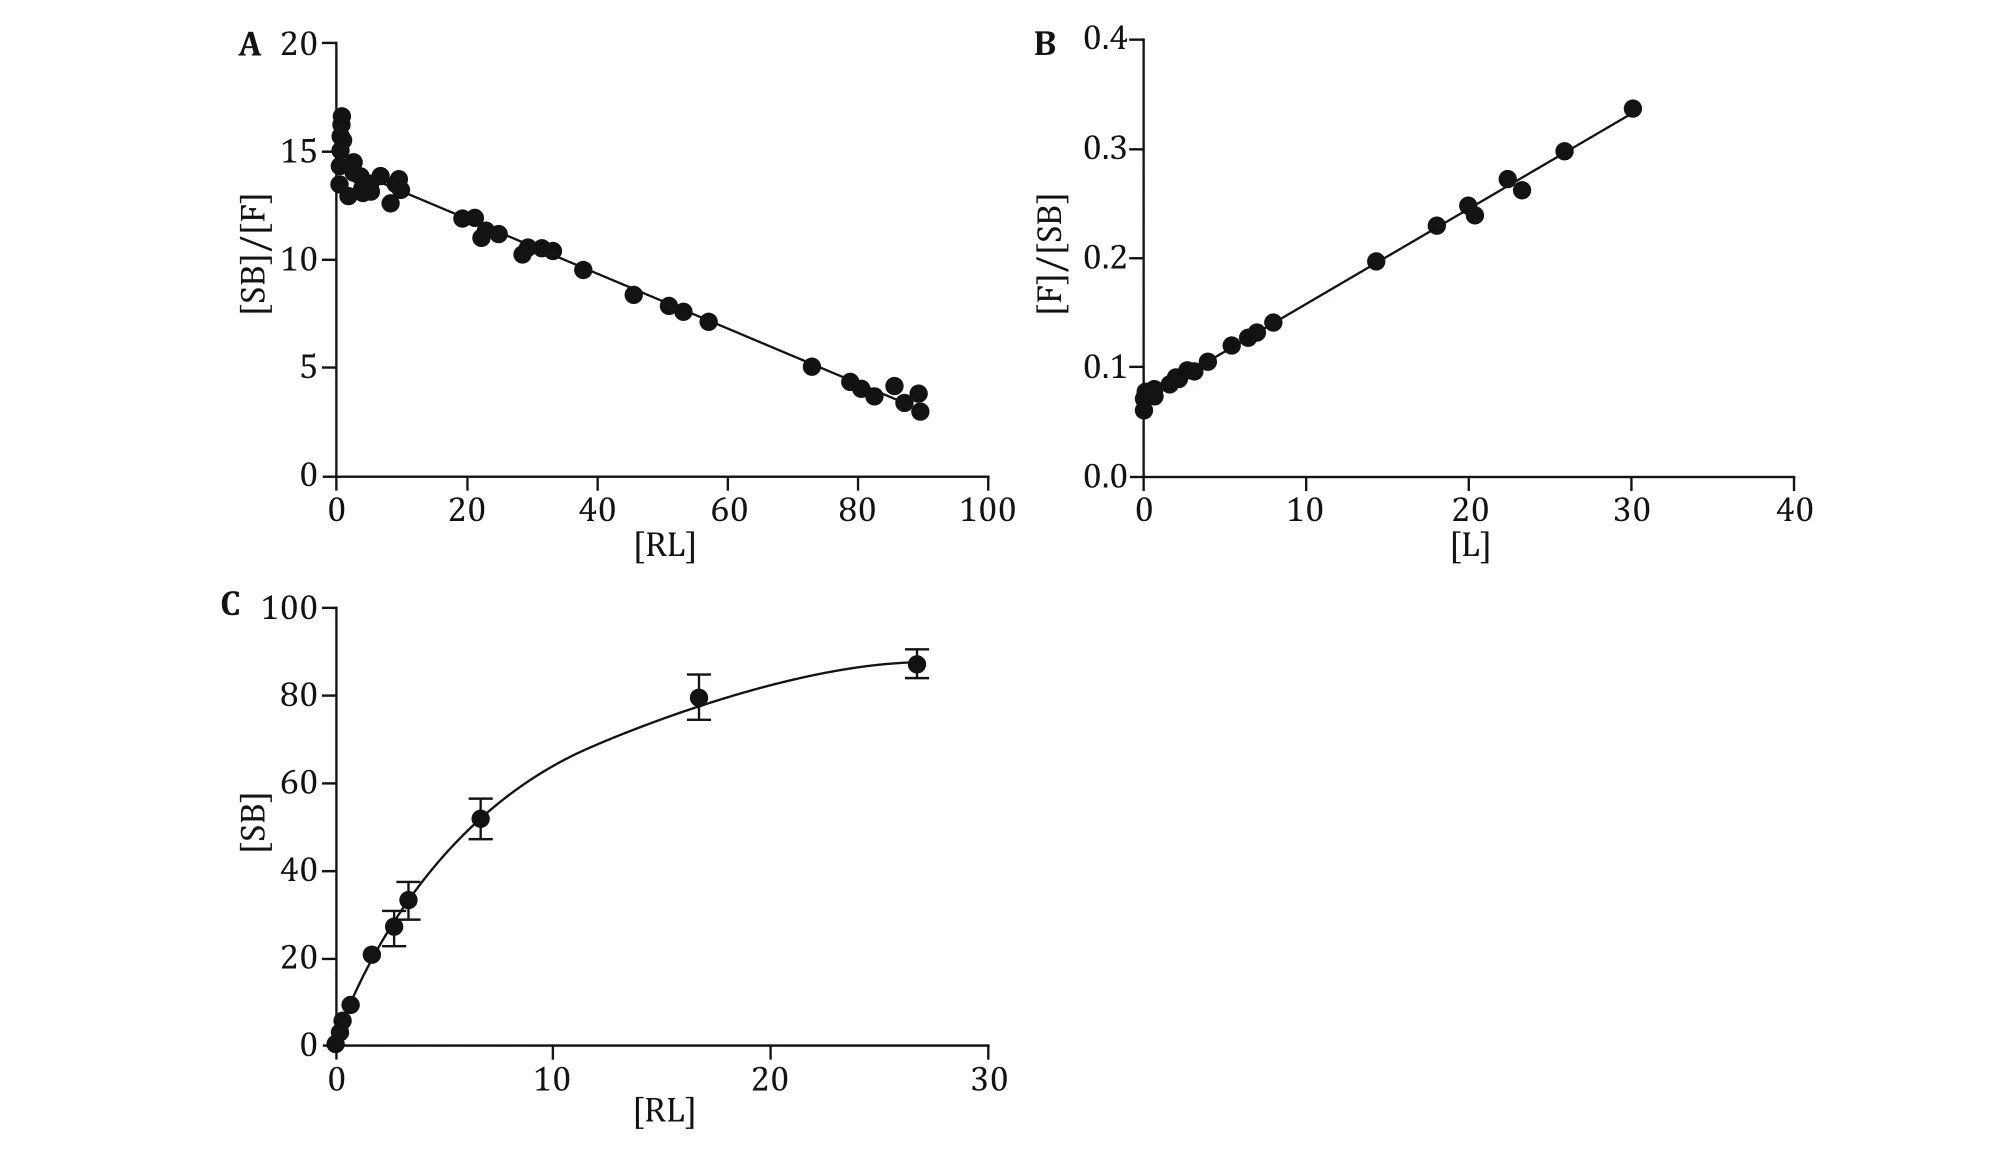
Fig.2 The calculation of Kdand Bmaxby Scatchard plot(A),Woolf plot(B)or the software(C)

Table 3 Comparison of the results obtained by three plots
· Cell-binding buffer(20 mmol/L Tris,150 mmol/L NaCl,2 mmol/L CaCl2,1 mmol/L MnCl2,1 mmol/L MgCl2,1%(wt/vol)bovine serum albumin;pH 7.4)
· PBS buffer(NaH2PO4·2H2O 0.24 g,Na2HPO4·12H2O 2.901 g and NaCl 8.5 g in 1 L ddH2O)
· Receptor-overexpressed cells(see‘‘Reagent setup’’section)
·Medium
· Fetal bovine serum
· Na125I(Perkin Elmer,Waltham,MA,USA)
Equipment
· pH paper(Aladdin Inc.)
· PD MidiTrap G-25 column(GE Healthcare,cat.no. 28-9180-08)
· MultiScreenTMVacuum Manifold 96-well plate(Millipore,cat.no.MAVM0960R)
· Vacuum pump(Zhengzhou Greatwall Inc.,SHB-III)
· Dry bath incubator(Fisher Scientifc,cat.no.11-718-2)
· γ-counter(PerkinElmer,2470 automatic gamma counter)
· Glass-bottomed screw cap vial(Agilent Technologies, cat.no.5182-0715)
· GraphPad Prism(GraphPad Software Inc.)
Reagent setup
Cell sample preparation Culture receptor-over expressed cells in corresponding medium under certain conditions.Collect the cells from the fasks or the plates.At least 105cells are needed for each well.It takes 96 wells to test the binding of one ligand with its receptor.Wash the cell solution with 0.01 mol/L sterile PBS three times.Carefully resuspend the cells in cell binding buffer to a concentration of 2×10⁶cells/mL.
Cold protein L preparation 500 mg of protein L is dissolved in or diluted with 2.5 mL cell binding buffer. However,it takes a large amount of ligand to fnish the experiment.In general,the cold ligands should be 1000 times more concentrated than the radiolabeled ligand to block the receptors.Fewer cold ligands could be used in low concentrations.Moreover,fewer concentrations(forexample,eight concentrations)could conserve many ligands.
Equipment setup
γ-counter E%could be determined by comparison between the detected cpm value and the objective cpm value.
Acknowledgments This work was supported by National Natural Science Foundation of China(81125011,81420108019 and 81427802).
Compliance with Ethical Standards
Confict of Interest Chengyan Dong,Zhaofei Liu and Fan Wang declare that they have no confict of interest.
Human and Animal Rights and Informed ConsentThis article does not contain any studies with human or animal subjects performed by any of the authors.
Open Access This article is distributed under the terms of the Creative Commons Attribution 4.0 International License(http:// creativecommons.org/licenses/by/4.0/),which permitsunrestricted use,distribution,and reproduction in any medium,provided you give appropriate credit to the original author(s)and the source,provide a link to the Creative Commons license,and indicate if changes were made.
Anderson AJ(1994)A simple competitive protein-binding experiment.J Chem Educ 71:994
Bailey GS(1996)The Iodogen method for radiolabeling protein. In:Walker JM(ed)The protein protocols handbook.Humana Press,New York,pp 673-674
Bylund DB,Toews ML(1993)Radioligand binding methods: practical guide and tips.Am J Physiol 265:L421-L429
Cai W,Chen X(2008)Preparation of peptide-conjugated quantum dots for tumor vasculature-targeted imaging.Nat Protoc 3:89-96
Carpenter JW,Laethem C,Hubbard FR,Eckols TK,Baez M,McClure D,Nelson DLG,Johnston PA(2002)Confguring radioligand receptor binding assays for HTS using scintillation proximity assay technology.In:Janzen WP(ed)Methods in molecular biology,vol.190:high throughput screening:methods and protocols.Humana Press,New York,pp 31-49
Hollemans HJ,Bertina RM(1975)Scatchard plot and heterogeneity in binding affnity of labeled and unlabeled ligand.Clin Chem 21:1769-1773
Hunter R(1970)Standardization of the chloramine-T method of protein iodination.In:Proceedings of the society for experimental biology and medicine society for experimental biology and medicine,New York,vol 133,pp 989-992
Keen M(1995)The problems and pitfalls of radioligand binding. In:Davis L(ed)Methods in molecular biology,vol 41. Humana Press Inc,Clifton,pp 1-16
Klotz IM(1985)ligand-receptor interactions:facts and fantasies. Q Rev Biophys 18:227-259
Maguire JJ,Kuc RE,Davenport AP(2012)Radioligand binding assays and their analysis.In:Davis L(ed)Methods in molecular biology,vol 897.Humana Press Inc,Clifton, pp 31-77
Williams M,Jacobson KA(1990)Radioligand binding assays for adenosine receptors.In:Williams M(ed)Adenosine and adenosine receptors,vol 2.Humana Press,New York, pp 17-55
Motulsky H(1996)The GraphPad guide to analyzing radioligand binding data.GraphPad Software,Inc.,San Diego
Opresko L,Wiley HS,Wallace RA(1980)Proteins iodinated by the chloramine-T method appear to be degraded at an abnormally rapid rate after endocytosis.Proc Natl Acad Sci USA 77:1556-1560
Tallarida RJ,Raffa RB,McGonigle P(eds)(1988)Radiolabeled binding.In:Principles in general pharmacology,vol 9. Springer,New York,p 199
Rovati GE(1993)Rational experimental design and data analysis for ligand binding studies:tricks,tips and pitfalls.Pharmacol Res 28:277-299
Rovati GE(1998)Ligand-binding studies:old beliefs and new strategies.Trends Pharmacol Sci 19:365-369
Davenport AP,Russell FD(1996)Radioligand binding assays: theory and practice.In:Mather SJ(ed)Current directions in radiopharmaceutical research and development.Springer, Amsterdam,pp 169-179
Wilkinson KD(2004)Quantitative analysis of protein-protein interactions.In:Fu H(ed)Protein-protein interactions,vol 2. Humana Press,New York,pp 15-31
✉Correspondence:wangfan@bjmu.edu.cn(F.Wang)
杂志排行

Biophysics Reports的其它文章
- Implications for directionality of nanoscale forces in bacterial attachment
- Visualizing the Ensemble Structures of Protein Complexes Using Chemical Cross-Linking Coupled with Mass Spectrometry
- E2-2,a novel immunohistochemical marker for both human and monkey plasmacytoid dendritic cells
- Pseudomonas sp.LZ-Q continuously degrades phenanthrene under hypersaline and hyperalkaline condition in a membrane bioreactor system
- Thermodynamics of GPCR activation