Numerical Simulation of Gas-Solid Two-Phase Flow in Reverse Blow ing Pickup Mouth
2015-08-07XIYuan郗元CHENGKai成凯LOUXitong娄希同CHENGLei程磊DONGChao董超
XIYuan(郗元),CHENG Kai(成凯)*,LOU Xi-tong(娄希同),CHENG Lei(程磊),DONG Chao(董超)
1 School of Mechanical Science and Engineering,Jilin University,Changchun 130022,China
2 XCMG Xuzhou Truck-Mounted Crane Co.,Ltd.,Xuzhou 221007,China
Numerical Simulation of Gas-Solid Two-Phase Flow in Reverse Blow ing Pickup Mouth
XIYuan(郗元)1,CHENG Kai(成凯)1*,LOU Xi-tong(娄希同)1,CHENG Lei(程磊)2,DONG Chao(董超)1
1 School of Mechanical Science and Engineering,Jilin University,Changchun 130022,China
2 XCMG Xuzhou Truck-Mounted Crane Co.,Ltd.,Xuzhou 221007,China
Pickup mouth is a key component for the service performance of a street sweeper.Computational fluid dynam ics (CFD)technology,as an analysis tool in fluid flow simulation,is em p loyed in this work because it can greatly shorten the design period.To obtain higher simulation accuracy,the gas-solid coup ling inside the process cannot be neglected during numerical simulation.Our optim ization procedure considers the influence of structure and operational parameters.It is recommended that the outlet diameter is less than 0.42 of the w idth and the outlet inclination angle is110° for structure parameters.The dust collection efficiency is improved when the reverse flow rate is70%of the total volume,the sweepertraveling speed is 10 km/h,and the pressure drop is 2 400 Pa.Simulation results exhibit well consistency with the physical experimental results.
sweeper;pickup mouth;parameter optimization; computational fluid dynamics(CFD);gas-solid flow
Introduction
Road dust is themain particulate pollution in the city,and it has great effects on particle concentration[1].Sweeper is typically practiced to remove the accumulation of dust,silt and rainwater from road surface,somany local authorities take it as an effective sanitation equipment of controlling pollutant[2-3]. Scholars both atdomestic and overseas have paidmuch attention to the sweeper[4-6].In order to improve the dust collection efficiency of pickup mouth,Chen et al.[7]added front,rear and both sides of baffles by experiments.With the rapid development of the computer technology,the computational fluid dynamics(CFD)has been successfully adopted to study various industrial pneumatic conveying processes[8-10].Zeng et al.[11-12]put forward the improvement by changing the structure of pickup mouth with CFD.Yang et al.[13-14]employed dual-phrase distribution of gas and solid model to verify the suction effects of different diameter particles.Singlesuction pickup mouth has been investigated so much,but there are a few research reports about reverse blow ing pickup mouth. This study aims to investigate the structure and operation parameter of pickup mouth considering the size interference between pickup mouth and sweeper,and an optimal structure and operating condition is obtained.
1 Pneumatic Conveying System
The schematics diagram and airflow route are shown in Figs.1 and 2 respectively.Sweeper uses rotary brushes to sweep the particle to the center of the sweeper.Negative pressure under the pickup mouth creates a vacuum that carries the particle into the hopper.Regulation handle(in Fig.1)can adjust the allocation of flow rate,and amountof the flow rate is reused to loosen debris on the street after subsidence and filter,causing the air to continually flow through a“regenerative loop”.The rest of flow rate is conveyed to the impulse dust filter,and finally the purified air is exhausted into the air.
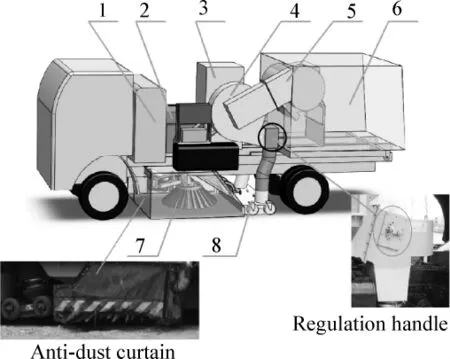
1-water tank;2-auxiliary engine;3-impulse dust filter; 4-centrifugal fans;5-centrifugal cleaner;6-hopper; 7-cylindrical brush;8-reverse blowing pickup mouthFig.1 Schematics diagram of regenerative air system sweeper
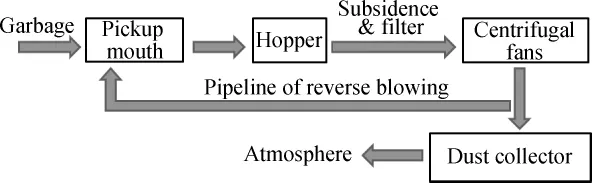
Fig.2 Flow chart of the pneumatic conveying system
Schematics diagram of reverse blow ing pickup mouth is shown in Fig.3.Supporting wheel and hoisting lug guarantee ground clearance when the pickup mouth works.The negative pressure is produced at the outletby a centrifugal fan,and larger particle is sucked in across rubber baffle.The inlet is connected with outlet of centrifugal fans by regulation handle.Air thatenters reverse blow ing cavity is jetted through L-type slots (zoneⅥin Fig.4).Under the action of outlet and inlet,particle on the ground is lifted and conveyed to the hopper across the pipeline.

1-outlet;2-hoisting lug;3-inlet;4-supporting wheel;5-rubber baffleFig.3 Schematics diagram of reverse blow ing pickup mouth
2 Numerical Simulation and Solution Methods
2.1 Physicalmodel and grid generation
As shown in Fig.4,L is the length,B is the w idth,H is the height,βis the outlet inclination angle,D1is the outlet diameter,D2is the inlet diameter,and V is the sweepertraveling speed.And the constants used in thismodel are L= 1 400 mm,B=480 mm and H=130 mm.

Fig.4 Structure dimensions of reverse blow ing pickup mouth
Pro/E was used to establish the whole flow passagemodel of reverse blowing pickup mouth.Particle is sucked at a certain speed by airflow because of ground clearance.While flow rate and pressure,etc.,are unknown,external air domains are employed to simulate the actual situation.
In order to obtain the high accuracy and efficiency of numerical simulation,grid generation is vital.It is necessary to decompose the complex geometry into several portions.Each portion was meshed with structured grids by the integrated computer engineering and manufacturing code(ICEM).The grid independence test was employed to ensure the higher precision of the calculation.Figure 5 shows the mesh for computationalmodel.
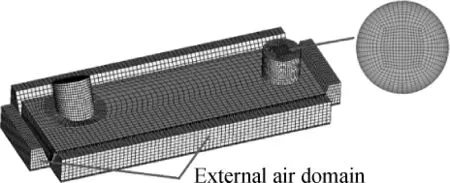
Fig.5 Mesh for computationalmodel
2.2 Discrete phase model(DPM)and boundary conditions
DPM modelwas used to simulate the actual condition and calculate the dust removal efficiency.Road particle model of Wu et al.[14]was employed to calculate dust collection efficiency.Figure 6 shows the cumulative size distribution of sand particle,where Ydis themass fraction and dpis the particle diameter.
The k-εmodel was chosen in the calculation according to flow characteristic[15].The Euler-Lagrange approach was used to simulate gas-solid flow inside pickup mouth[14].The DPM was employed because of the low volume fraction of solid phase.SIMPLE algorithm and the second-order upw ind scheme were used for the sake of high precision solutions.Pressure-inlet boundary condition was imposed at the externalair domain,and atmospheric pressure was specified.The outlet and the inlet were expressed by utilizing the pressure-outlet and velocity-inlet boundary conditions,respectively.At the bottom shell,static wallwas applied,and the moving wall condition was imposed for the remaining shells.Table 1 shows settings of the CFD simulations.
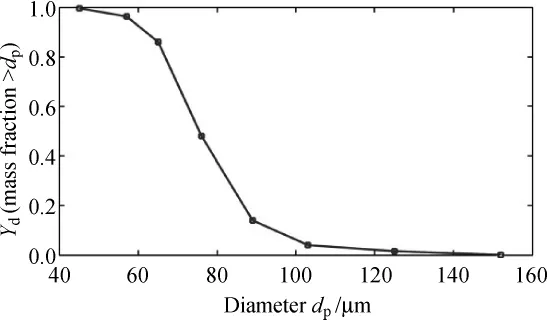
Fig.6 Cumulative size distribution of sand particles
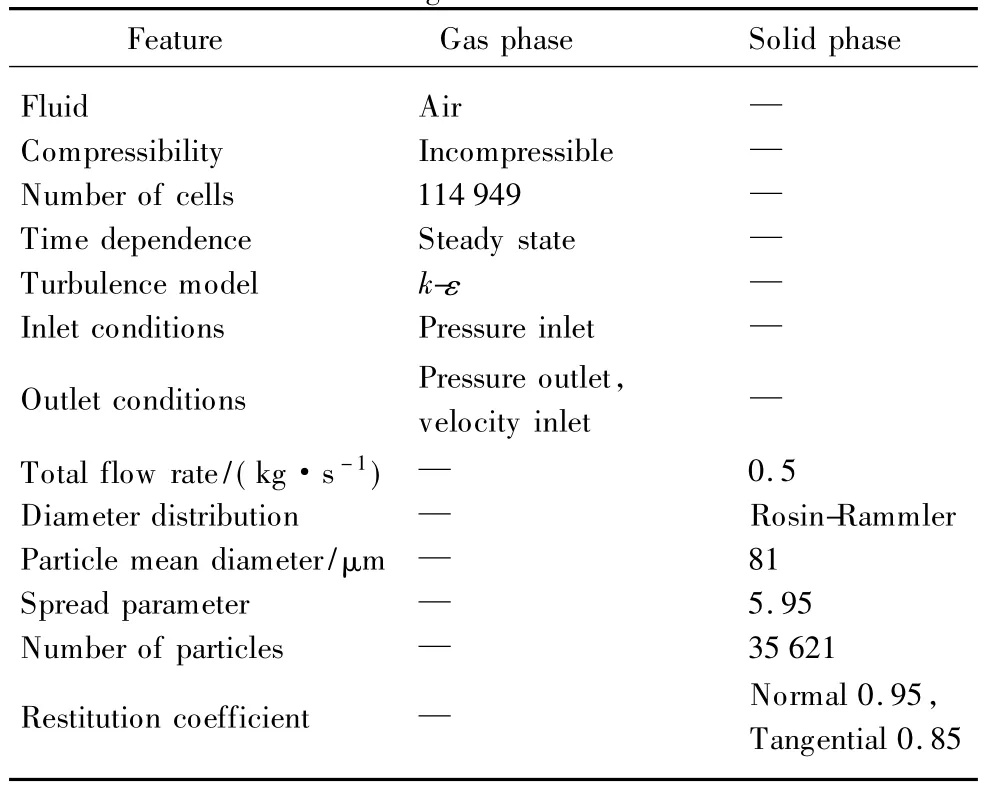
Table 1 Settings of the CFD simulations
To describe the process of particle inhalation,there are several assumptions.(1)No heat exchange exists between inside and outside of the pickup mouth.(2)External air domains are used around the four narrow slots and its pressure is the same as atmosphere.(3)Particles are static before injection and the sweepermoves forward evenly.
The initiation of particlemovement refers to theminimum velocity of particle that startsmoving[16-17],so pickup velocity is a vital parameter.Particle pickup velocity of different sizes is shown in Fig.7 combining with formula of Bagnold[18]and experimental results of Zhu[19],which takes the sand density (1.94 t/m3)as an example.
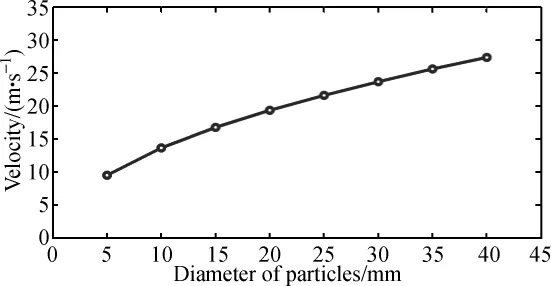
Fig.7 Pickup speed of different sizes of particles
2.3 Flow chart
Flow chart of gas-solid coupling is shown in Fig.8.The whole flow passage model of reverse blow ing pickup mouth is established.Complex model is decomposed into several portions,and each portion is meshed with structured grids by ICEM.This simulation of gas-solid coupling was calculated in the Fluent soft.Continuous phase iterative calculation starts working after setting boundary conditions and initialization.The calculation results whether meet the objective parameters after calculation is converged.Themodelwill be redesigned if results do not meet requirements;on the contrary,disperse phase iterative calculation will start.The overall removal efficiency is calculated by disperse phase,which is compared with the removal efficiency that is no less than 90%in QC/T 51-2006[20].The model will be redesigned if results do notmeet this;conversely,themodelwill be output.

Fig.8 Flow chart of gas-solid coupling
3 Resu lts and Discussion
3.1 Structure parameter analysis
3.1.1 Outlet diameter
The L,B and H were not resized because of the size interference between pickup mouth and sweeper.The pressure outlet(1-outlet in Fig.3)and the velocity inlet(3-inlet in Fig.3)were-2 100 Pa and 19 m/s respectively according to themeasured value,and the ground clearanceδwas 10 mm.
Suppose D2is0.42B.Relation curves of average velocity,pressure and iD1B(the ratio of outlet diameter and w idth)are illustrated in Fig.9.The average velocities of four narrow slots increase with iD1Bincreasing,while the pressure at the inletof 1-outlet(in Fig.3)decreaseswith iD1Bincreasing.Butboth of the two parameters change slightly when iD1B≥0.45 because of the constant pressure at outlet.The larger the diameter is,the higher the dust collection power becomes,whichmakes average velocities increase.The larger diameter causes the reduction of distance between baffle and outlet,whichmakes the friction loss and the pressure decrease simultaneously.The lower pressure causes the increase of airflow velocity,which results in the increase of friction loss.Meanwhile,the increases of friction loss and dust collection power are approximately equalwhen iD1B≥0.45,which makes average velocities and pressure change little.
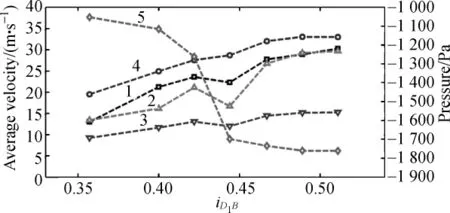
1-average velocity of the front narrow slot; 2-average velocity of the rear narrow slot; 3-average velocity of the left narrow slot; 4-average velocity of the right narrow slot;5-pressure of the entrance of outletFig.9 Relation curves of average velocity,pressure and iD1B
3.1.2 Outlet inclination angle
Suppose D1is 0.42B and D2is 0.42B respectively. Relation curves of average velocity,pressure and outlet inclination angleβare illustrated in Fig.10.The larger the inclination angleβis,the smoother the air flow becomes when β≤105°,which makes energy loss less.The smaller energy loss causes the increase of average velocities and the decrease of pressure values.But the larger the inclination angleβis,the unsmoother the air flow becomes whenβ≥105°,which makes energy loss larger.The larger energy loss causes the decrease of dust collection power.Meanwhile,it makes the average velocities decrease and pressure increases.What's more,the larger inclination angleβmakes the cross-sectional area larger undoubtedly,which leads to smaller effects of the negative pressure at the outlet.Thus,pressure at the inlet increases dramatically.
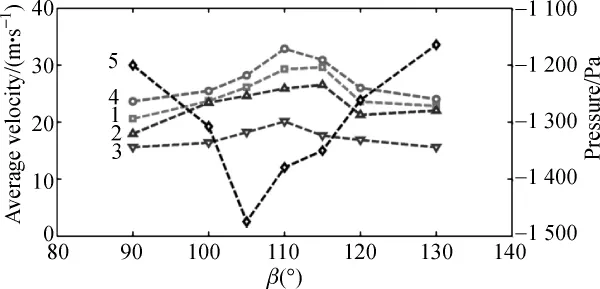
1-average velocity of the front narrow slot; 2-average velocity of the rear narrow slot; 3-average velocity of the left narrow slot; 4-average velocity of the right narrow slot;5-pressure of the entrance of outletFig.10 Relation curves of average velocity,pressure andβ
Based on the analysis of the influence of structure parameter above,β=110°was selected.This optimalmodel was employed in next analysis.
3.2 Operation parameter analysis
3.2.1 Reverse blow ing flow rate
Particle model mentioned in section 2.2 was used to calculate the dust removal efficiency and simulate the actual circumstance.The overall removal efficiency is calculated by releasing a specified number of particles at the injection surfaceand by monitoring the number of particles escaping through the outlet.And the grade efficiency is simultaneously obtained by the samemethod.
Take the maximum effective operation speed 12 km/h as an example.The effect of reverse blowing flow rate on the overall removal efficiency is shown in Fig.11.The overall removal efficiency increases when the flow rate is less than 2 172m3/h,otherw ise the overall removal efficiency decreases significantly.Particle leakage phenomenon appears and it becomes more serious with the increase of flow rate when reverse blow ing flow rate is more than 2 172 m3/h.This is because reverse blow ing flow rate and sweeper-traveling speed make the relative velocity between particle and pickup mouth improve andmost particlesmove ata large impactangle,which leads to particles escape after inhalation.According to QC/T 51-2006,the removal efficiency is no less than 90%[20].It is recommended that the maximum reverse blow ing flow rate is 2 172m3/h,70%of total flow rate of the fan.This method was employed in the follow ing operation parameter calculation.
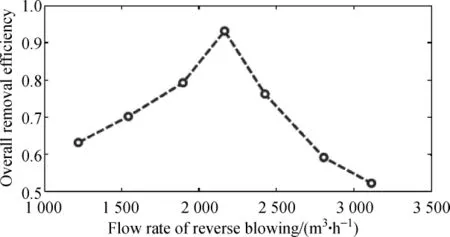
Fig.11 Reverse flow rate and collection efficiency relation curve
3.2.2 Sweeper-traveling speed
Pressure drop and reverse blow ing flow rate were set as 2 200 Pa and 2 172m3/h respectively.Overall removal efficiency and grade are obtained in Fig.12 by changing sweeper-traveling speed.Figure 12(a)shows that the overall removal efficiency decreases with sweeper-traveling speed increasing.The increasing speed leads to the increase of relative velocity,which is between the sweeper and particles.Higher speed makes the particlemass loading ratio larger,and particles get less kinetic energy,which results in the overall removal efficiency decrease.Figure 12(b)shows that the grade efficiency of the smallest particles decreases by 9%with sweeper-traveling speed increasing.While the grade efficiency of the largest particles decreases by 33%.The inertia effects mentioned above can also account for that.It is recommended that themaximum sweeper-traveling speed is10 km/h according to the removal efficiency that is no less than 90%.
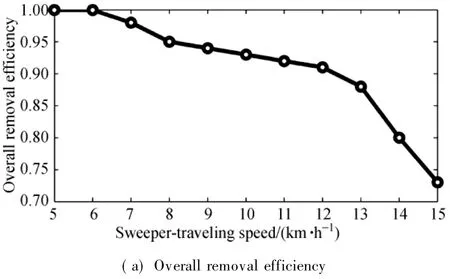

Fig.12 Relation curves of speed and collection efficiency
3.2.3 Pressure drop
Overall removal and grade efficiency are obtained in Fig.13 by changing pressure drop across reverse blow ing pickup mouth at the speed of 10 km/h.The overall dust removal efficiency increases slightly when the pressure drop is from 3 200 to 3 500 Pa.The particles getmore kinetic energy with the pressure drop increasing.Therefore,the overall dust removal efficiency is improved.When the pressure drop ismore than 3200 Pa,the increase of friction loss is approximately equal to the increase of dust collection power,and the overall dust removal efficiency increases slightly.Figure 13(b)shows that the grade efficiency of the smallest particles decreases by 14% with the pressure drop decreasing.While the grade efficiency of the largest particles decreases by 35%.It is recommended that the pressure drop is2 400 Pa according to the removalefficiency that is no less than 90%.

Fig.13 Relation curves of pressure drop and collection efficiency
3.3 Velocity vector
The optimization of the structure and operation parameters are listed in Table 2 based on the analysis above.Figure 14 shows velocity vector section of the improved reverse blow ing pickup mouth under the optimization of operation parameters. From Fig.14(a),there isa low-velocity in the zoneⅠ,but the zoneⅠis at the center and is surrounded by high speed airflow,so dust collection efficiency is affected little.Figure 14(b)shows vector diagram of the section of outlet(Y=200 mm). ZoneⅢis the outlet and its maximum velocity is nearly 62.3 m/s.Even a vortex exists in zoneⅡparticles can be sent into hopper with ease.
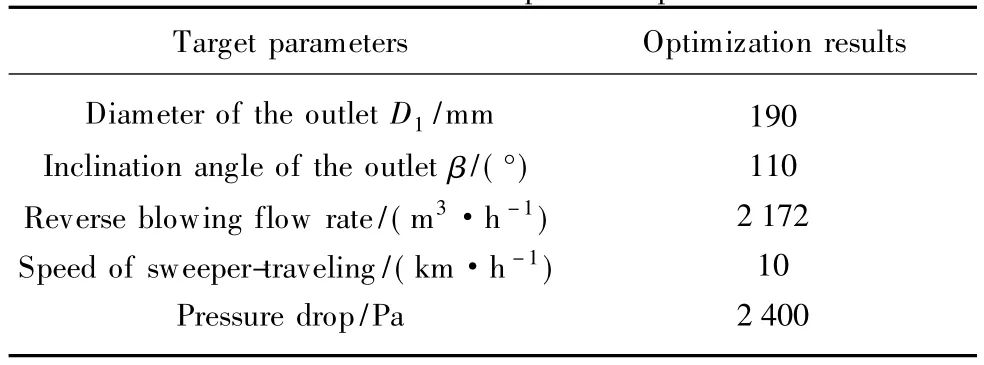
Table 2 Structure and operation optim ization

Fig.14 Velocity vector section of improved reverse blowing pickupmouth
3.4 Model validation
Field experiments were selected in the factory in order to verify the accuracy of simulation analysis.The photos of the sample machine and field experiment are shown in Fig.15. Particles spread evenly in the field experiments,and distribution density is 0.15 kg/m2.Experiments were carried out under the conditions that pressure drop and velocity were 2 400 Pa and 10 km/h respectively.KASDA-KV621 hot-wire anemometerwas used to measure the velocity of airflow.Seven test points were selected along the sweeper-traveling direction at X=10mm in Y=200mm plane.Five periods of timeswere tested,and finally the average speed of each test point was obtained.Comparison results are listed in Table 3,and simulation data are obtained by improved reverse blowing pickup mouth under the operation optimizationmentioned in Table 2.

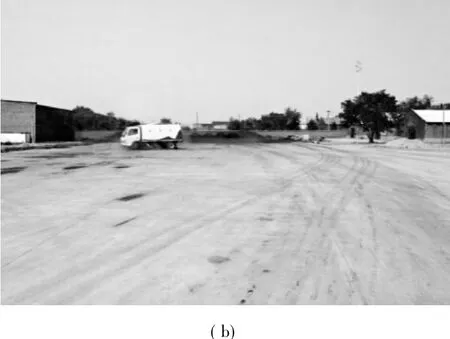
Fig.15 Photos of samplemachine and field experiment

Table 3 Comparison between simulation results and experimental results
Relative error Eq.(1)was quoted to calculate the difference between simulation and test data.Themaximum and theminimum relative errors are 9.8%and 5.29%respectively,and the average relative error is 7.63%.So the error is allowable according to the relative error that is less than 10%[14,19].
whereΔp is the relative error,psimulationis the simulation data,and pexperimentalis the experimental data.
4 Summary and Conclusions
This study firstly optim ized the structure parameters considering the size interference between pickup mouth and sweeper.Dust removal efficiency increased with outlet diameter increasing when iD1Bwas less than 0.42 orβincreasing whenβ was less than 110°.Secondly,operation parameters,such as reverse blow ing flow rate,sweeper-traveling speed and pressure drop,were evaluated.The overall removal efficiency improved with larger reverse flow rate when reverse flow rate was not more than 70%of the total volume.The overall removal and grade efficiency increased with pressure drop increasing,but both of them decreased with speed increasing.
A trade-off is obtained among high quality,high speed,and low energy consumption.It is recommended that reverse blow ing flow rate is less than 70%of the total volume,and an optimal sweeper-traveling speed is 10 km/h under the pressure drop of 2 400 Pa.The improved pickup mouth is easy to install withoutmodifying greatly because it is connected to the hopper by vacuum hose.Simulated values are closelymatched with the measured values by sweeping field experiments,which proved the appropriateness of numerical simulation and practical significance of CFD technology.
References
[1]Khanal R,FurumaiH,Nakajima F.Toxicity Assessmentof Size-Fractionated Urban Road Dust Using Ostracod Heterocypris Incongruens Direct Contact Test[J].Journal of Hazardous Materials,2014,264:53-64.
[2]Tobin G A,Brinkmann R.The Effectiveness of Street Sweepers in Removing Pollutants from Road Surfaces in Florida[J]. Journal of EnvironmentScience and Health,2002,37(9):1687-1700.
[3]Breault R F,Sm ith K P,Sorenson JR.Residential Street-Dirt Accumulation Rates and Chem ical Composition,and Removal Efficiencies by Mechanical-and Vacuum-Type Sweepers,New Bedford,Massachusetts,2003-04[M].Reston,VA:US Department of the Interior,USGeological Survey,2005:11-21.
[4]Walter S,Ulli-Beer S,Wokaun A.Assessing Customer Preferences for Hydrogen-Powered Street Sweepers:a Choice Experiment[J].International Journal of Hydrogen Energy,2012,37(16):12003-12014.
[5]Chang Y M,Chou C M,Su K T,et al.Effectiveness of Street Sweeping and Washing for Controlling Ambient TSP[J]. Atmospheric Environment,2005,39(10):1891-1902.
[6]Jia C,Tai J,Bi Z J,et al.The Requirement Study of Subcompact Street Cleaning Vehicles[J].Environmental Engineering,2013,32(s1):786-788.(in Chinese)
[7]Chen Z J,Wu X Y,Xu G P,et al.Experimental Study on Suction Mouth of Vacuum Sweeper[J].Journal of Tongji University:Science and Technology,2001,29(12):1483-1485. (in Chinese)
[8]Zhou Z Y,Kuang S B,Chu K W,et al.Discrete Particle Simulation of Particle-Fluid Flow:Model Formulations and Their Applicability[J].Journal of Fluid Mechanics,2010,661: 482-510.
[9]He L L,Zhou Y F,Huang Z L,et al.Acoustic Analysis of Particle-Wall Interaction and Detection of Particle Mass Flow Rate in Vertical Pneumatic Conveying[J].Industrial&Engineering Chemistry Research,2014,53(23):9938-9948.
[10]Laín S.Pneumatic Conveying of Solids along a Channel with Different Wall Roughness[J].Chemical Engineering Communications,2014,201(4):437-455.
[11]Zeng G Y,Li X F,Xiao T Y,et al.Simulation for the Design of Dust Suction System of Highway Sweeper[J].Journal of System Simulation,2004,16(12):2770-2773.(in Chinese)
[12]Zhu F L,Zhang G Z,Chen J.Flow Field Analysis and Structure Optim ization of Vacuum Sweeper Suction Mouth[J].Machinery Design&Manufacture,2008(11):50-52.
[13]Yang C Z,Zhang Y C,Ouyang Z J,et al.Parametric Design of Dust Collection Port of Vacuum Sweeper based on Flow Simulation[J].Journal of Central South University:Science and Technology,2012,43(9):3704-3709.(in Chinese)
[14]Wu B F,Men JL,Chen J.Numerical Study on Particle Removal Performance of Pickup Mouth for a Street Vacuum Sweeper[J]. Powder Technology,2010,200(1/2):16-24.
[15]Wang F J.Computational Fluid Dynam ics:Principles and Applications Analysis in CFD Software[M].Beijing:Tsinghua University Press,2004.(in Chinese)
[16]Chuah T G,Gimbun J,Choong T S Y.A CFD Study of the Effect of Cone Dimensions on Sampling Aerocyclones Performance and Hydrodynam ics[J].Powder Technology,2006,162(2):126-132.
[17]Nickling W G.The Initiation of Particle Movement by W ind[J].Sedimentology,1998,35(3):499-511.
[18]Bagnold R A.The Physics of Blown Sand and Desert Dunes[M].New York:william Morrow&Company,1941:167-181.
[19]Zhu F L.The Structure Research and Flow Field Analysis of Dust Collection Port Based on Sucking Performance[D].Shanghai: Shanghai Jiao Tong University,2008:27-28.(in Chinese)
[20]The National Development and Reform Commission of the People's Republic of China.QC/T 51-2006,the National Automotive Industry Standard[S].Beijing:China Coal Industry Publishing House,2006.(in Chinese)
U418.3
A
1672-5220(2015)04-0530-06
date:2015-03-20
National Natural Science Foundation of China(No.51375202)
*Correspondence should be addressed to CHENG Kai,E-mail:chengkai@jlu.edu.cn
杂志排行

Journal of Donghua University(English Edition)的其它文章
- Numerical Reality Method of the M icroburst Model
- Corporate Governance,Government Regulation and Bank Stability
- Cracking Patterns of Shear Walls in Reinforced Concrete Structure due to Strong Earthquake Based on Mohr-Coulomb Criterion
- Cooperative Compressive Spectrum Sensing in Cognitive Underwater Acoustic Communication Networks
- Fuzzy Model Free Adaptive Control for Rotor Blade Full-Scale Static Testing
- Bottleneck Identification and Prediction of Wafer Fabrication Systems in Transient States