Wall Sticking of High Water-Cut, Highly Viscous and High Gel-Point Crude Oil Transported at Low Temperatures
2015-06-22ZhengHaiminHuangQiyuWangChanghuiWangXi
Zheng Haimin; Huang Qiyu; Wang Changhui; Wang Xi
(Beijing Key Laboratory of Urban Oil and Gas Distribution Technology, China University of Petroleum, Beijing 102249)
Wall Sticking of High Water-Cut, Highly Viscous and High Gel-Point Crude Oil Transported at Low Temperatures
Zheng Haimin; Huang Qiyu; Wang Changhui; Wang Xi
(Beijing Key Laboratory of Urban Oil and Gas Distribution Technology, China University of Petroleum, Beijing 102249)
Some crude oils with high water cut have the capability to flow below the oil gel point, while the oil particles adhere to the pipe wall in the form of paste, also called “wall sticking”. Wall sticking is a serious problem during the pipeline transportation, leading to partial or total blockage of the pipeline and energy wastage. In this paper, a series of laboratory flow loop experiments were conducted to observe the wall sticking characteristics of crude oil with high water cut, high viscosity and high gel point at low transportation temperatures. The effects of shear stress and water cut on the wall sticking rate and occurrence temperature were investigated. Experimental results indicated that the wall sticking rate and occurrence temperature were lower under stronger shear stress and higher water cut conditions. A criterion of wall sticking occurrence temperature (WSOT) and a regression model of wall sticking rate were then established. Finally, the software was developed to calculate the pressure drop along the pipelines of crude oils with high water-cut. It was able to predict the wall sticking thickness of gelled oil and then calculate the pressure drop along the pipelines. A typical case study indicated that the prediction results obtained from the software were in agreement with actual measured values.
wall sticking; high viscosity; high water cut; flow loop; regression model
1 Introduction
Some highly viscous crude oils simultaneously have a high gel point, resulting in transportation difficulties. Traditionally, these highly viscous oils are heated while being transported due to their poor capability to flow at ambient temperature. However, the high energy consumption, the narrow variation range of allowable throughput and the risk for oil gelling during the pipeline shutdown can cause potential issues when the pipeline is heated for transportation of crude oil. Moreover, with the extensive use of water flooding for enhancing oil recovery, many oilfields have entered on a high water-cut stage and the produced crude oil forms an oil-in-water inverse emulsion. Finding out a safe and energy efficient transportation method is necessary for oil production.
Research has shown that crude oils with high water cut have the capacity to move at or even below the gelling temperature[1]. Milind Deo[2]also found that a gel formed when flowing in unheated pipes (under cold conditions) is weaker than that formed when flowing under heated conditions with all other conditions remaining constant. These observations have convinced us to investigate the flow properties of high water cut crude oils at around the gel point. The rheological properties of oil-water mixtures, factors that affect stability of oil-water suspension system, and the microstructure of crude oils with a high gel-point and a high viscosity at low temperatures were carefully observed[3-9]. The non-heating oil gathering process may be a feasible solution to decrease energy consumption during transportation of high water-cut, highly viscous and high gel-point crude oil, even though the temperature of crude oil without heating may be at around or below the gel point. The adhesive force of pipe wall working on the oil drops is stronger than the water phase working on them, which can make oil dispersion drops stick on the pipe wall. Herein, we call this phenomenon “wall sticking”. Wall sticking is a common problem when high water cut and highly viscous oil is transported at temperatures close to the gel point. Study of wall stick-ing is still in its initial stage. Research is particularly focused on low-temperature gathering and transferring technology, temperature allowance, the safe returning oil temperature, etc[10-16]. Dmitry Eskin, et al.[17]studied the problem of particles stuck to the wall in depth and Li, et al.[18]researched the effects of shear stress and oscillatory frequency on the structural properties of the gelled Daqing crude oil at various temperatures. Although some of the previous studies can offer valuable guidance, the feasibility of low-temperature gathering and transportation still cannot be determined.
Hereby, a series of experiments were conducted to observe the role of water cut and shear stress on the wall sticking rate and occurrence temperature. Water cut here refers to the stable water volume fraction of crude oil under the condition of flowing oil-water mixture in a dynamic balance. Then a criterion for wall sticking occurrence temperature and a regression model were established to predict the wall sticking rate in order to provide a theoretical guidance for the transportation of high water-cut, highly viscous and high gel-point crude oils at some oilfields.
2 Experimental
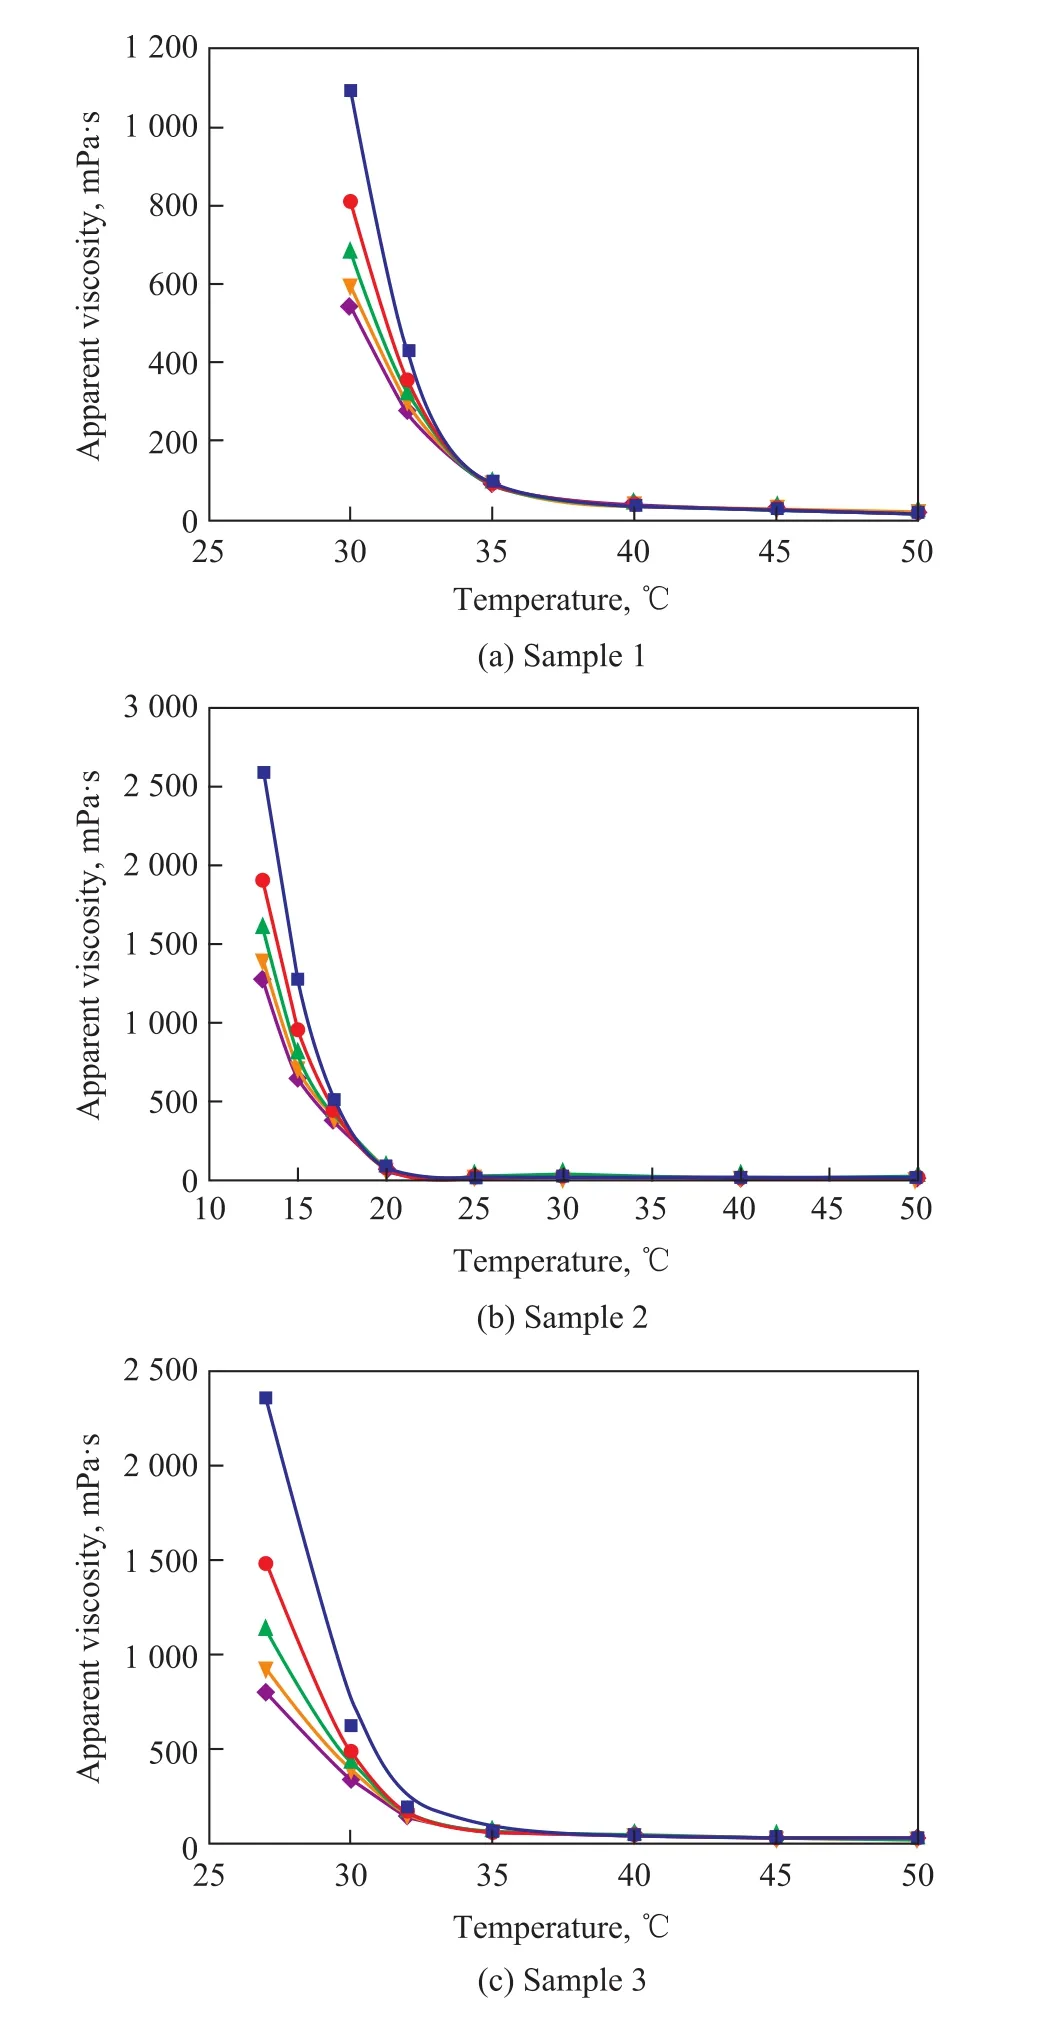
Figure 1 Viscosity-temperature curves of oil samples■—10 s-1;●—20 s-1;▲—30 s-1;▼—40 s-1;◆—50 s-1
2.1 Materials
Oil samples used in this study were collected from three different oil fields in China. Their basic physical properties and viscosity-temperature curves under different shear rates are listed in Table 1 and Figure 1, respectively.
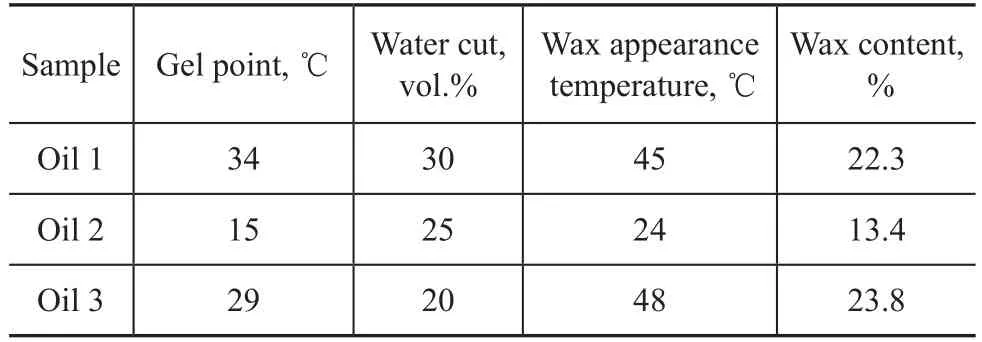
Table 1 Basic physical properties of experimental oil samples
2.2 Experimental apparatus
A small-scale indoor flow loop was used to study the wall sticking of gelled oil, as shown in Figure 2. This experimental apparatus can reflect actual pipeline wall shear rate and temperature gradient conditions.
The experimental apparatus consisted of a pipe system, two thermostatic water baths, a mass flow-meter, a stirred oil tank, a peristaltic pump, and a data acquisition system. The pipe system included the test section and the reference section, which were made of two stainlesssteel pipes that are Φ14×1 mm in wall thickness with a total length of 1.5 m. Both sections were surrounded by a water jacket, Φ30×1 mm in dimension, enclosed with an insulating layer. The wall temperature of both sections was controlled by two thermostatic water baths with a control accuracy of 0.1 ℃ to keep the wall temperaturesteady around the required values. Two differential pressure indicators with a maximum range of 186 kPa and an accuracy of 0.1% were placed over the reference section and the test section. The volume of the tank for feeding the crude oil into the system was equal to 20 L. A stirring paddle was used to agitate the system in order to obtain a homogeneous and stable emulsion. A peristaltic pump was used to drive the fluid through the pipe, which could avoid the crude sample changing during experiments due to the shear effect as the oil samples flowed through the pump. A mass flow-meter with a precision grade of 0.25 and a range of 0—600 kg/h measured the mass flow rate, and the flow could be varied by adjusting the electric motor speed. Further details of the flow loop have been introduced previously in the literature[19].
2.3 Experimental procedures
The experimental emulsion was prepared with a 30%-water cut oil-water and pure water. During the experiments, these two materials were agitated in the tank until it was well mixed. In a typical flow loop run, the fluid in the stirred oil tank was driven by the peristaltic pump through the test section, and then the reference section, and finally was routed back to the oil tank. In the test apparatus, the temperature of the oil tank, at the outlet of the pump, and at the inlet and outlet of the test section and the reference section was monitored by thermocouples. The wall temperature in the test section and the reference section was maintained at below and equal to the gel point, respectively. The last step of the experiment was setting the temperatures of the stirred oil tank, the water jacket of the test section and the reference section at 60 ℃ and keeping the emulsion circulating in the pipe for 30 min to flush the wall of the flow loop. Afterwards, the mixture was drained and the system was cleaned of the remaining oilwater mixture using compressed air.
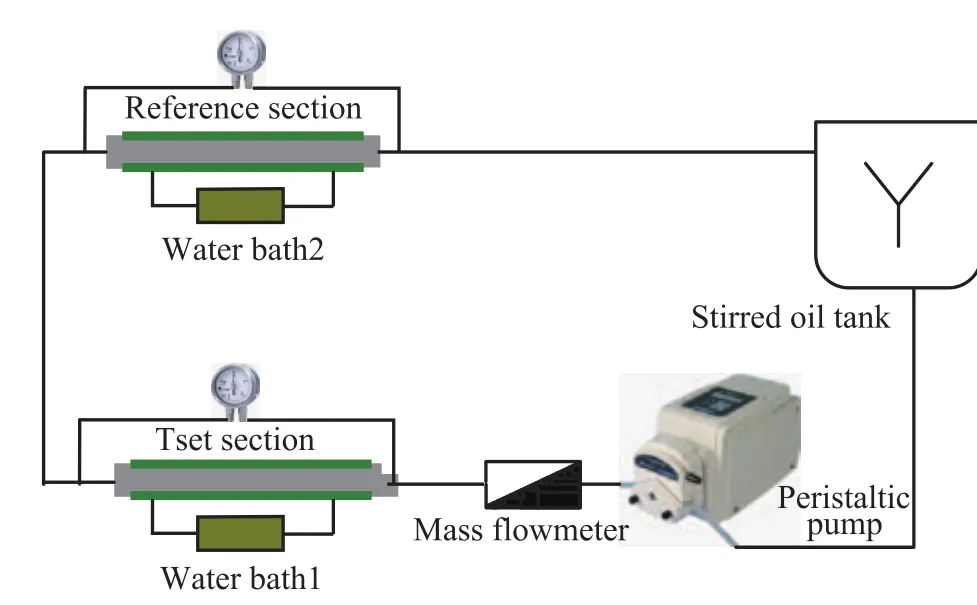
Figure 2 Flow loop configuration
3 Results and Discussion
3.1 Wall sticking occurrence temperature
3.1.1 Definition of wall sticking occurrence temperature
In the flow loop experiment, the wall sticking occurrence temperature (WSOT) was identified by decreasing the temperature at small increments under a fixed flow velocity, which was determined by pressure drop trend versus the temperature. It was defined as the intersection point of two tangents, which meant that the growth rate of the pressure drop appeared to increase rapidly below the temperature point. It can be seen from Figure 3 that the pressure drop of the test section increased with a decreasing temperature and T0was confirmed to be the WSOT. The pigging frequency was much lower when the operation was above the WSOT as compared to the case below that temperature. Therefore the WSOT could be used as a limit to determine the feasibility of oil transportation in pipelines.
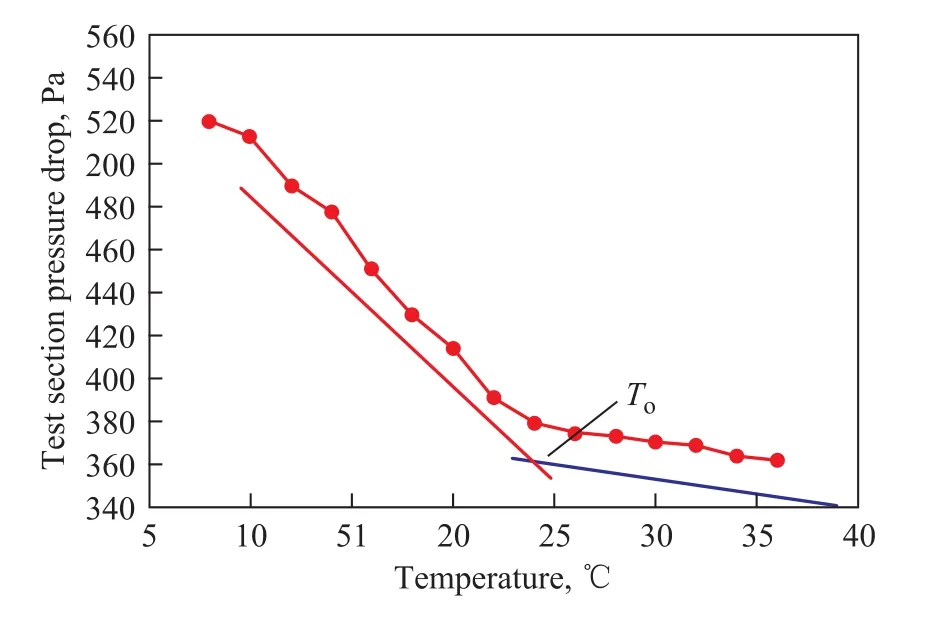
Figure 3 Determination of WSOT
3.1.2 Effect of water-cut on the wall sticking occurrence temperature
The effects of water cut on the WSOT of oil-water emulsion are shown in Figure 4. The gel point was 34 ℃ for sample 1 which had 30% of water cut, and it was 15 ℃for sample 2 which had 25% of water cut, while it was 29 ℃ for sample 3 which had 20% of water cut as shown in Table 1. It can be seen from Figure 4 that the WSOT for oil samples with a high water cut was lower than thatof oil samples having gel point just with 30%, 25%, and 20% of water cut, respectively. The three oil samples showed the same tendency of a decreasing WSOT as the water cut increased. The reason is that as the water cut increased, the volume concentration of the water phase increased also and the volume concentration of the oil phase decreased. Therefore, the distance between the gelled oil particles would increase, which could reduce the probability of oil molecules and gelled oil particles to bombard the pipe wall and stick to it at the same test temperature. The water film surrounding the oil phase might make the coagulation between the oil phases more difficult as the water cut increased. Therefore, the WSOT of a high-watercut oil decreased with an increasing amount of water phase.
3.1.3 Effects of shear stress on the wall sticking occurrence temperature

Figure 4 Relationship between WSOT and water cut of oil samples■—50 kg/h;●—80 kg/h;▲—100 kg/h
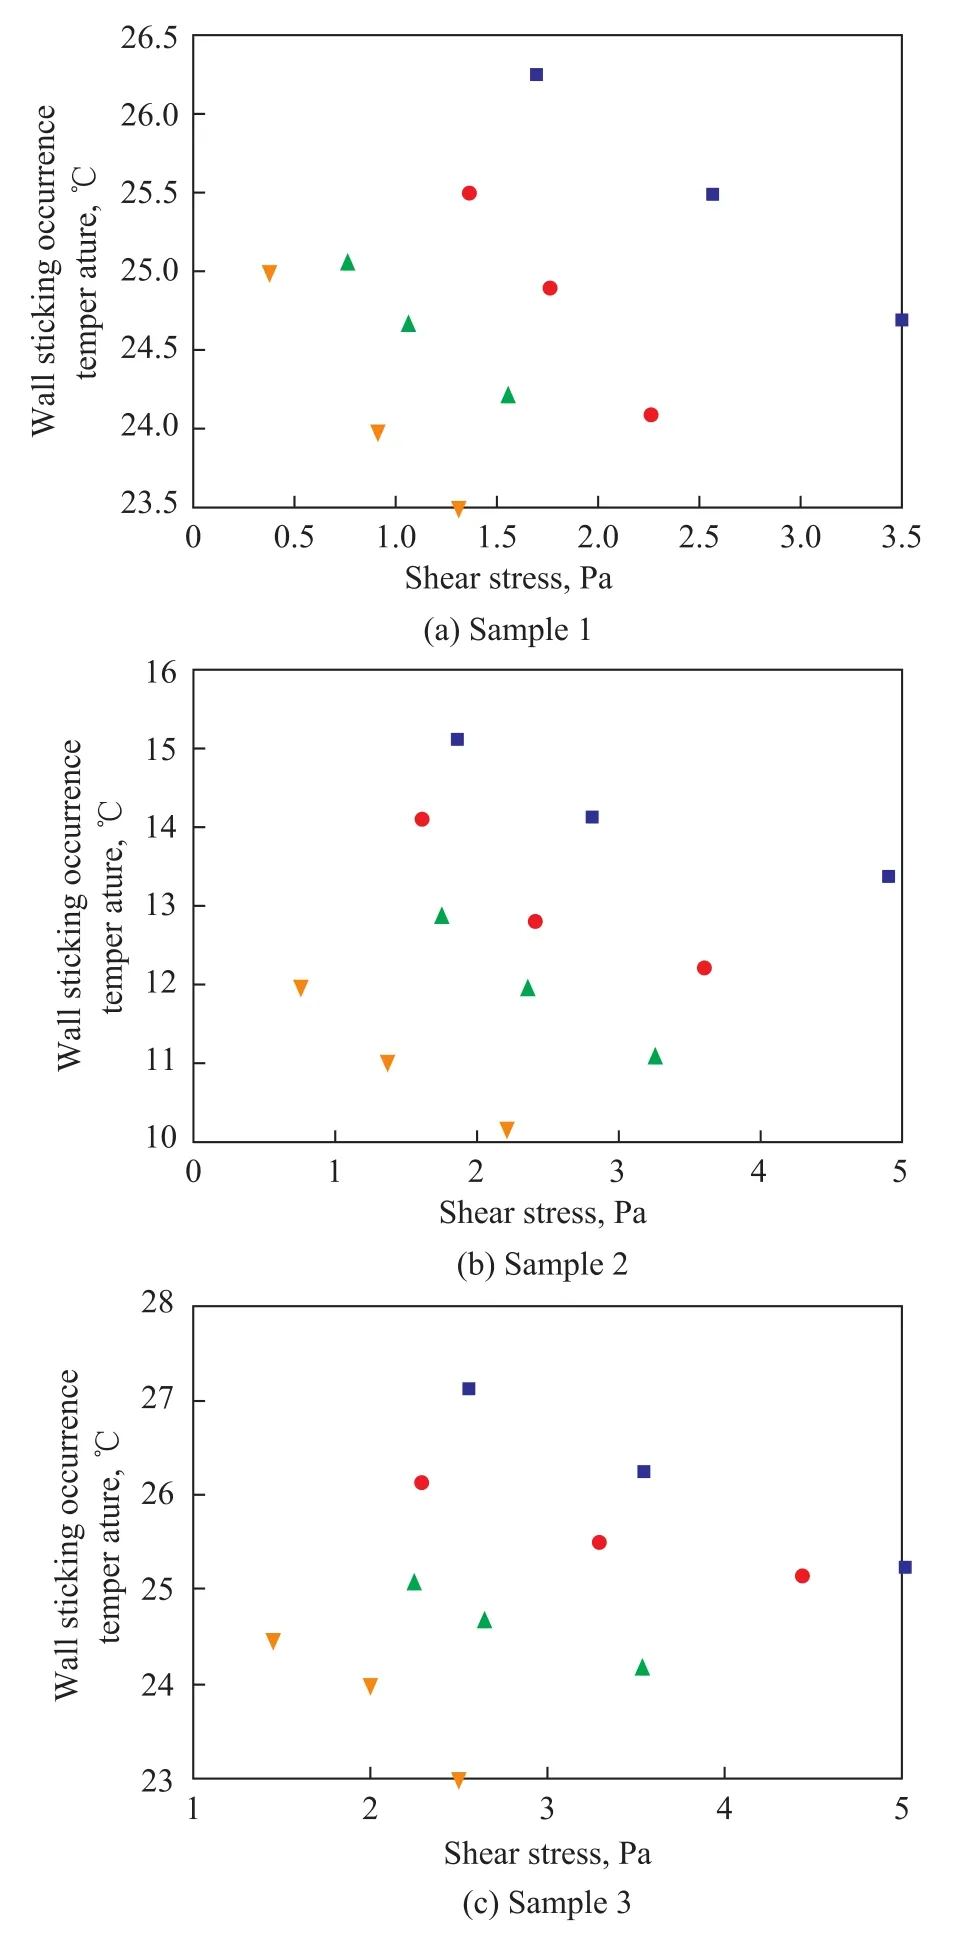
Figure 5 Relationship between WSOT and wall shear stress for oli samples■—Water cut of 80%;●—Water cut of 85%;▲—Water cut of 90%;▼—Water of 95%
The effects of shear stress on the WSOT in gelled oil are shown in Figure 5. As the shear stress increased, the WSOT decreased. Emulsion with various water cut valuesshowed different variation gradients with the same trend, most likely because of their degree of dispersion. During the pipeline transportation of crude oils, the scouring action of the fluid on the pipe wall grows with an increasing shear stress, which makes the gelled oil more difficult to be stuck on the pipe wall. It can be seen from Figure 4 that the occurrence temperature decreased with an increasing mass flow rate, which took place most likely due to the stronger scouring action resulted from stronger shear force under a higher flow velocity condition.
3.2 Wall sticking rate
3.2.1 Determination of the wall sticking thickness
In the flow loop experiment, there was no on-line technique that could enable direct and continuous measurement of the wall sticking thickness during the experiment. Instead of direct measurement, the pressure-drop method was used to determine the wall sticking thickness. The method can be performed online without interrupting the experiment. The test section and reference section of the pipe had the same geometric dimensions and velocity. Assume that the two sections had the same operating conditions while ignoring minor temperature difference.
The pressure drop can be calculated by the Darcy-Weisbach formula as shown by Equation (1):
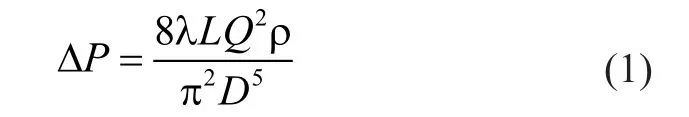
where ΔP is the pressure drop (Pa) across the test (or the reference) section; L is the length (m) of the test (or the reference) section; ρ is the density (kg/m3) of emulsion; Q is the volume flow rate (m3/s); λ is the hydraulic friction coefficient, either under laminar flow λ=64/Re, or turbulent flow λ=0.316 4/Re0.25.
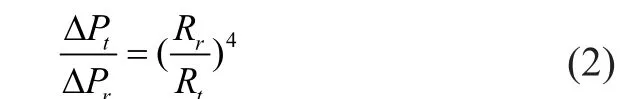
Since the variables of velocity, volume rate of flow Q, density, and length had the same values in the test section and the reference section, the minor viscosity difference could be ignored. The ratio of the test pressure drop and reference drop under laminar flow is expressed as follows:
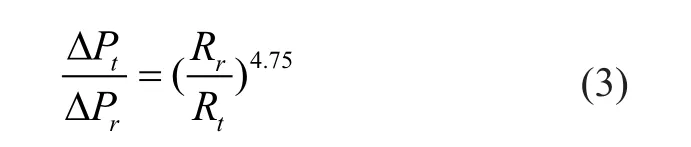
The ratio of test pressure drop and reference drop under turbulent flow is expressed as follows:
The wall temperature of the reference section was kept high enough to prevent wall sticking and its diameter remained unchanged, therefore Rris a constant value.
Finally the wall sticking thickness is calculated as follows:
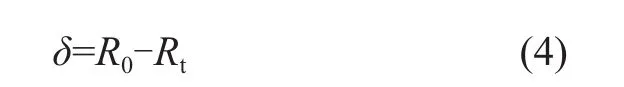
where ΔPtis the pressure drop (Pa) across the test section; ΔPris the pressure drop (Pa) across the reference section; Rtis the pipe radius (m) of the test section; Rris the pipe radius (m) of the reference section; R0is the initial pipe radius (m) of the test section.
3.2.2 The wall sticking thickness growth trend
The measurements of wall sticking thickness of oil sample 1 with a water cut of 80%, 85%, 90%, and 95%, respectively, under various shear stresses were performed with the results presented in Figure 6. At any water cut and shear stress, the thickness initially increased rapidly, followed by a mild increase. It showed the same tendency with Maths’s[20]and Rainer’s[21]wax deposition thickness studies. A relationship between the deposition, pressure drop and surface roughness can be determined from Haaland’s friction correlation[22]:
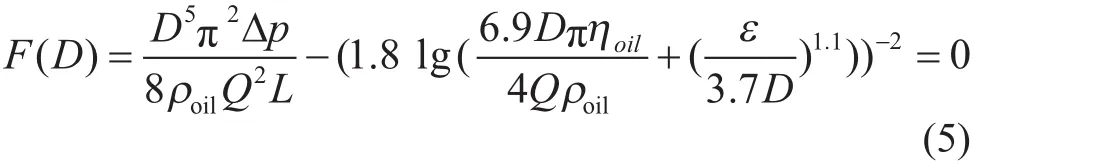
where D is the inner pipe diameter, Δp is the pressure drop, Q is the volumetric flow rate, ρ is the density of oil, L is the length of the differential pressure measurement, η is the viscosity of oil and ε is the surface roughness of the inner wall of pipeline.
Deposition can lead to changes of pipe effective cross sectional area and wall roughness, which also results in change of pressure drop[20]. The initial wall sticking rate is determined by the empty pipe wall roughness and the wall sticking thickness increases (pressure drop) quickly[21]. Then the wall roughness becomes smaller and it results in a gentle increase of wall sticking thickness. Simultaneously, shear stress becomes stronger with an increasing wall sticking thickness (decreasing effectivecross sectional area) and it can also result in a gentle increase of thickness.
3.2.3 Effect of shear stress on the wall sticking rate
The effects of shear stress on the wall sticking rate are shown in Figure 7. Three oil samples had the same overall trend, indicating that the wall sticking rate decreased with an increasing shear stress, and a high enough shear stress could lead to a trivial wall sticking. Reasons might be that the scouring action of the fluid on the pipe wall was enhanced with an increasing shear stress, making pipe wall smoother. Then the gelled oil had difficulty in adhering to the pipe wall and the wall sticking rate was lower. In some practical situations, the influence of the surface roughness on the particle deposition can be significant[17]. Stronger shear stress could scour the pipe wall more effectively and might lead to a smoother pipe wall, therefore reducing the wall sticking rate. A further increase of shear stress could lead to the formation of a highly viscous liquid that would completely destroy the gelled structure. Generally speaking, more gelled oil was able to be transported through the pipe per unit of time with an increasing flow rate and should leave more gelled particles on the pipe wall. But the shear stress would escalate with the increase in flow rate, causing substantial scouring action. As a result, the wall sticking rate was decreased with an increasing flow rate and shear stress.
3.2.4 Effect of water cut on the wall sticking rate
The effects of water cut on the wall sticking rate are shown in Figure 8. The initial wall sticking rate diminished gradually with increasing water cut in every sample. As the water cut increased, the volume concentration of oil drops decreased, making the coalescence between the gelled oil particles more difficult. It would be more likely for gel to be scoured off the pipe surface because of the high water cut. Furthermore, the viscosity became smaller along with the increasing water cut coupled with the weakened gelation network formation. This might be thereason for the decreasing wall sticking rate. Moreover, the initial wall sticking rate decreased with an increasing flow rate because of scouring.
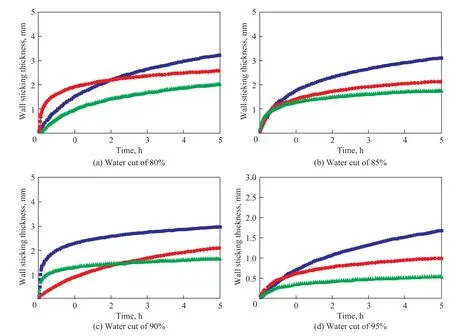
Figure 6 The wall sticking thickness growth trend of oil sample 1 with water cuts at various shear stress■—Average shear stress 2.09 Pa;●—Average shear stress 2.49 Pa;▲—Average shear stress 3.58 Pa
It can be concluded from the above comprehensive investigation that adding more water to the gelled oil is good for high water-cut, highly viscous and high gel-point crude oil transportation. High water cut not only causes the wall sticking occurrence to be less, but also decreases the wall sticking rate.
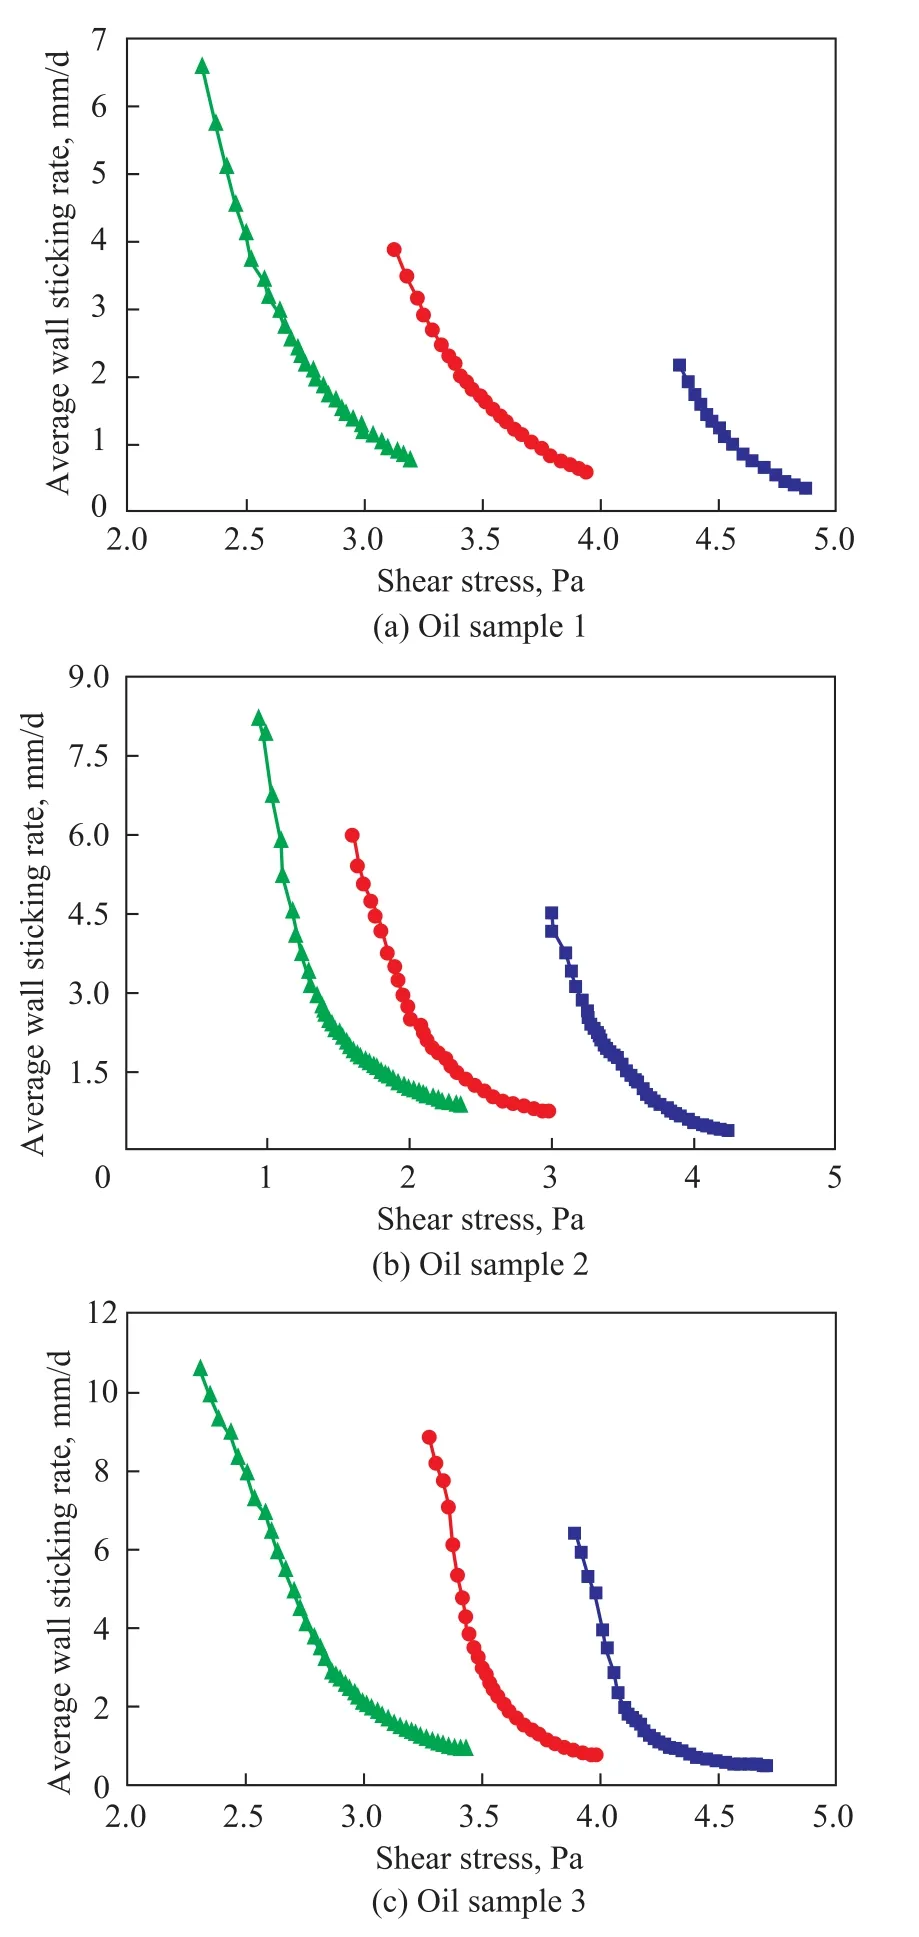
Figure 7 Relationship between average wall-sticking rate and shear stress of oil samples at different mass flow rates■—100 kg/h;●—80 kg/h;▲—50 kg/h
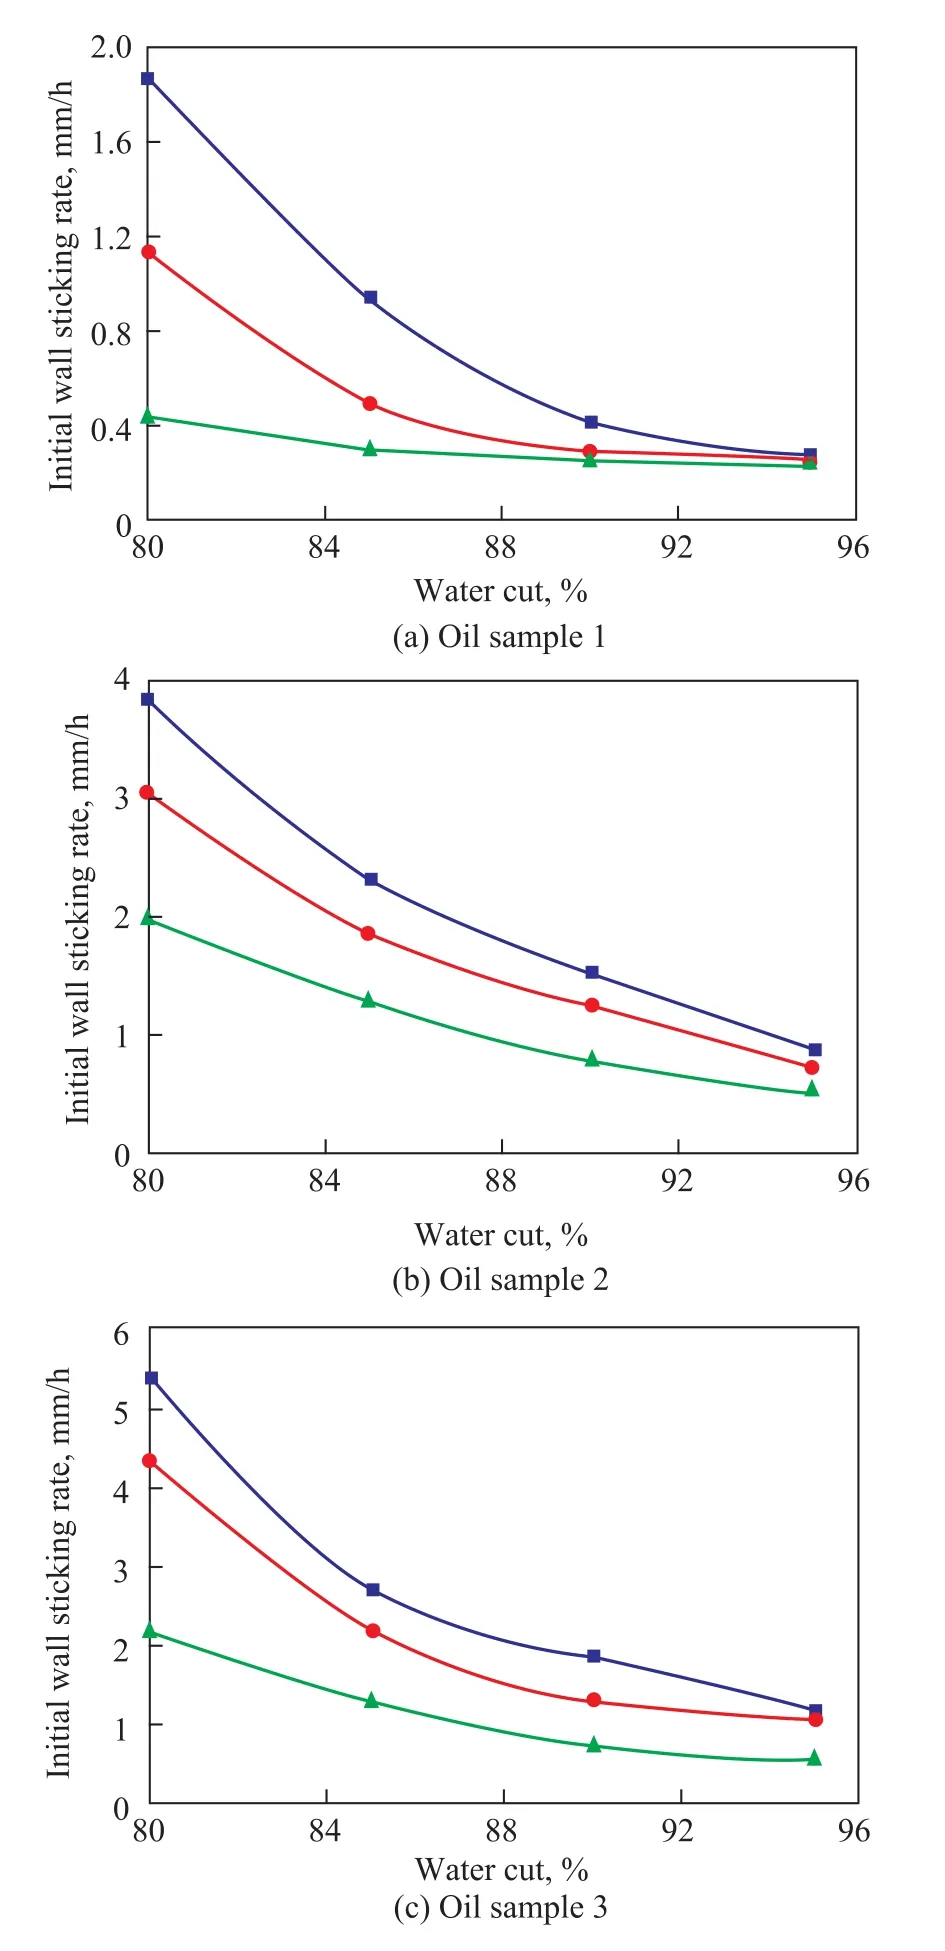
Figure 8 Relationship between wall-sticking rate and water cut of oil samples at different mass flow rates■—50 kg/h;●—80 kg/h;▲—100 kg/h
4 Regression Model and Validation
4.1 Calculation of wall sticking occurrence temperature
As we can see from the experiment, the water cut and shear stress are main factors of the WSOT: an increase in either one of them can cause a decrease in the WSOT. Based on the above comprehensive investigation and experimental data, an empirical formula was established to calculate the WSOT for high water-cut crude oils in un-heated pipes:
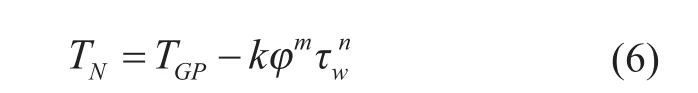
where TNis the oil phase WSOT (℃) of oil-water mixture in pipelines; TGPis the gel point (℃) of oil-water emulsion with a stable water cut of 30%; φ is the water cut of oil-water mixture in the range of 80%~99% (vol.); τwis the shear stress (Pa) on the pipe wall; and k, m, n are the regression coefficients.
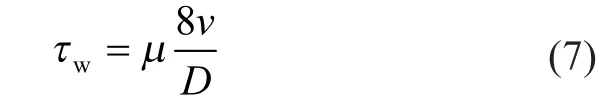
The shear stress of a Newtonian fluid under laminar flow near the inner wall of the pipe is expressed as[23]:
If the flow is turbulent, the shear stress can be determined by[23]:

where D is the inner diameter (m) of the pipe; v is the mean flow velocity (m/s).
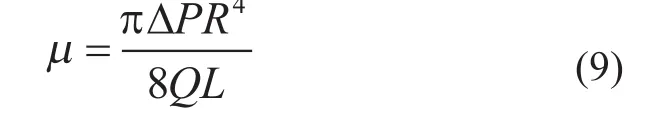
The dynamic viscosity of the prepared emulsion μ can be calculated by[23]:
The parameters in Eq. (6) for the three samples were regressed, with the results listed in Table 2. For the three oil samples, k, m and n have different values because of their composition differences.
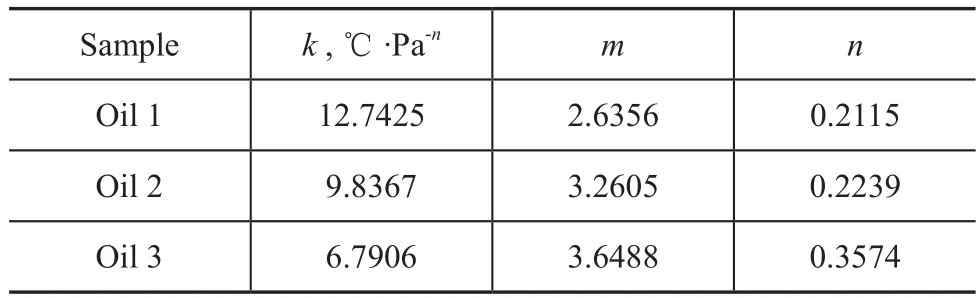
Table 2 The regressed results of k, m, and n in Eq. (6)
A comparison of WSOT between the experimental and calculated results for oil samples 1, 2 and 3 with high water-cut was performed. The WSOT of oil-water emulsion under various water cuts and different shear stresses was calculated by Eq. (6). The calculated values showed a good agreement with experimental values. The absolute error was less than 0.8 ℃, which was acceptable for engineering practice. So the criterion developed herein is reliable for calculating the WSOT allowance for high water-cut, highly viscous and high gel-point crude oil transmission pipelines.
4.2 Regression model of wall sticking rate
As it can be seen from experiment, the wall sticking rate decreased with the increase in shear stress and water cut, and the increase in temperature difference. Based on the above comprehensive investigation, a regression model was established for the wall sticking rate:
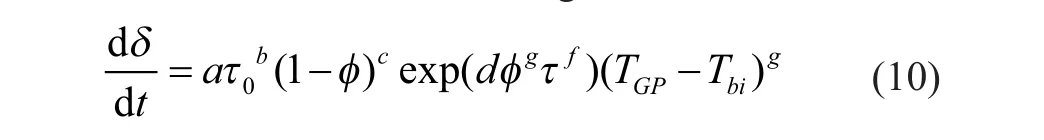
For the three oil samples, these coefficients had different values because of their composition differences. Based on the experimental results, the parameters in Eq. (10) for three emulsion samples were regressed with the results shown in Table 3.
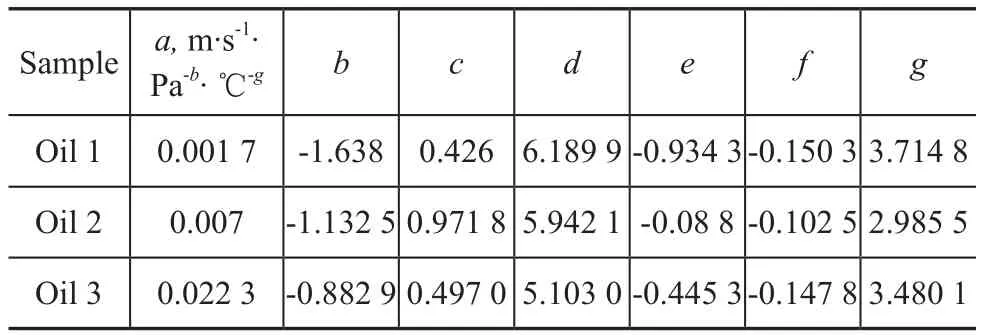
Table 3 The regressed parameters in Eq. (10) for oil samples 1, 2, and 3
To prove the reliability of the novel regression model, the calculated values under different experimental conditions obtained through this regression model were compared with experimental values, and the relative errors were all less than 30%. Its accuracy was able to meet the requirements of engineering calculations. Therefore, this formula can be used to simulate the variation of wall sticking rates affected by multiple factors. It has the ability to estimate the wall sticking rate of pipelines on site and can provide a sound basis for optimizing the pigging frequency.
从表4可以看出,处理T4、T5、T6之间千粒质量差异不显著,其大小顺序为 T6、T4、T5,处理 T4、T6 显著高于T2,处理T1、T2之间差异不显著。施加沼肥的处理中除T3外,其千粒质量都高于T1(不施肥)和T2(化肥),其中处理T4、T6的千粒质量显著高于未施加沼肥的的处理T1、T2。T6的千粒质量分别比处理T1、T2高 3.40%、2.65%, 处理 T4的千粒质量分别比处理 T1、T2高 3.35%、2.60%, 处理 T5的千粒质量分别比处理 T1、T2高 2.31%、1.57%。 数据表明,前茬施加沼肥对后茬玉米子粒产生了有利影响,提高了后茬玉米的子粒饱满度。
Based on Eq. (6) and Eq. (10), the software with hydrodynamic and thermodynamic calculation function during the high water-cut stage was programmed using the VB language, which could incorporate the gelled oil wall sticking rate calculation module and the pressure-drop increase prediction module. In addition, there were somerevisions to the temperature drop section of this software, such as using the Sokhov formula to calculate the temperature drop while considering the effect of water phase on the specific heat of the fluid. In addition, this software had applied the actual apparent viscosity of high water-cut crude oils instead of the simple water viscosity, because the fluid viscosity had experienced obvious changes after phase inversion.
This regression model is more reliable for pressure drop calculation in pipelines of high water-cut oil at low temperature. As regards the temperature drop, we have several calculations for oil samples and the average absolute deviation of this software with PIPEPHASE is 0.6 ℃ and its absolute deviation with OLGA is 1.01 ℃. This outcome is acceptable for engineering application.
4.3 Validation
The present regression model or software can distinguish whether the non-heating transportation is appropriate for the high water-cut crude oil. Oil from Well 1 was transported via addition of hot water. The basic production parameters of Well 1 are listed in Table 4.
Table 4 Basic production parameters for oil well 1
Based on these basic parameters, the calculated results revealed that the temperature of the fluid was reduced and the gelled oil would adhere to the inner wall of the pipeline without watering heating, resulting in the reduction of flow area and the gradual increase of pressure drop. When watering heating was stopped for 1 day, the wellhead back pressure of Well 1 increased to 0.530 MPa. In contrast, when the watering heating was stopped for 5 days, the wellhead back pressure of Well 1 increased to 6.507 MPa. These calculated results were similar to the actual value of the operating well. The gelled oil adhering to the pipe wall reached a thickness of 20 mm in some sections, which could cause potential accidents. Non-heating transportation is feasible and will not lead to gelation in this project. However, remediation measures should be taken adequately to prevent pipe plugging and other issues.
In summary, this module is more suitable for calculating the pressure drop in a pipeline during the high water-cut stage, and the calculated results are closer to the actual measured values. This module can help ensure transportation safety of crude oil with high water cut, explore temperature allowance of oil gathering without heating, and reduce energy consumption.
5 Conclusions
Wall sticking experiments with high water-cut, highly viscous and high gel-point crude oil were conducted in a laboratory flow loop. Experimental results showed that the transportation of the high water cut and high gel point crude oil without heating was feasible at below the gel point, but wall sticking could still occur on the pipe wall. Water cut and shear stress were the main factors that affected WSOT and the sticking rate. The WSOT and wall sticking rate decreased with an increasing shear stress and water cut. The sticking thickness increased rapidly initially and then increased gently due to changes of the effective cross sectional area and wall roughness. The WSOT criterion and a regression model of wall sticking rate were established. The absolute error of WSOT was less than 0.8 ℃ and the relative error of wall sticking rate regression model was less than 30%. Also, the software incorporated with hydrodynamic and thermodynamic calculation function was found to be reliable enough in field application for the unheated oil gathering and transferring system. In summary, this study can provide a collection of data detailing the wall sticking problem of high water-cut, highly viscous and high gel-point crude oil, although many questions still remain pertaining to the wall sticking problems. More micro-structure analyses are necessary for further wall sticking study.
Acknowledgement:The authors are thankful for the support from the projects of the National Natural Science Foundation of China (No. 51374224) for this research.
[1] Chen Yan, Tang Lihua, Wang Xiaobing. Study on ultimate temperature in low temperature transportation of water cut oil [J]. Offshore Oil, 2007, 27 (4): 60-63 (in Chinese)
[2] Milind D. Wax control in the presence of hydrates [R]. National Energy Technology Laboratory, 2008, 10
[3] El-Gamal I M, Gad E A M. Low temperature rheological behavior of Umbarka waxy crude and influence of flow improver [J]. Oil & Gas Science and Technology, 1997, 52 (3): 369-379
[4] Ruffier-Meray V, Roussel J C, Defontaines A D. Use of pulsed NMR spectroscopy to measure the amount of solid in waxy crudes [J]. Oil & Gas Science and Technology, 1998, 53 (4): 531-535
[5] Xia Haiying, Li Yongming, Guo Jixiang. Evaluation on the stability of suspension of oilfield product water [J]. Applied Chemical Industry, 2011, 40 (3): 449-456 (in Chinese)
[6] Ribeiro F S. Obstruction of Pipelines due to Paraffin Deposition during the Flow of Crude Oils [J]. Int J Heat Mass Transfer. 1997, 40 (18): 4319-4328
[7] Brown T S, Niesen V G, Erickson D D. Measurement and Prediction of the Kinetics of Paraffin Deposition [C]. the SPE 68thAnnual Technical Conference and Exhibition, Houston, Texas U.S.A., 1993, October 3-6
[8] Huang Qiyu, Wang Lei. Effect of droplet distribution on rheological properties of water-in-oil emulsion in waxy crude oils [J]. Acta Petrolei Sinica, 2013, 34 (4): 765-774 (in Chinese)
[9] Singh P, Venkatesan R, Fogler H S. Formation and aging of incipient thin film wax-oil gels [J]. AIChE Journal, 2000, 46(5): 1059-1074
[10] Han Hongsheng, Li Wenqing, Wang Xiaobing. Experimental study on ultimate temperature during low temperature gathering-transferring of water cut oil [J]. Petroleum Geology and Engineering, 2007, 21 (6): 102-104 (in Chinese)
[11] Wang Zhihua, Liuyang, et al. Experimental study on returning oil temperature boundary for low-temperature field production gathering system determined by the pressure drop gradient method [J]. Petroleum Geology and Engineering, 2011, 25 (3): 137-140
[12] Li Chuanxian, Bai Fan, Wang Yan. Influence of crude oil composition on wax deposition on tubing wall [J]. CIESC Journal, 2014, 65(11): 2014
[13] Zhang Shaobo, Wang Yining. Temperature boundary for low-temperature field production gathering system at Pingbei field of low permeability [J]. Oil-Gasfield Surface Engineering, 2011, 30 (8): 14-15 (in Chinese)
[14] Gao Xueliang, Zhu Yuhui, et al. Study on ultimate temperature during low temperature transportation of extra-high water cut oil [J]. Oil-Gasfield Surface Engineering, 2005, 24 (12): 25 (in Chinese)
[15] Song Chengyi. Application of low temperature gathering treatment process for produced liquid of high pour point crude oil in cold area [J]. Petroleum Engineering Construction, 2010, 36 (2): 96-99 (in Chinese)
[16] Zhang Guozhong, Ma Zhixiang. Determination of safe and economic transportation temperature in hot oil pipelines [J]. Acta Petrolei Sinica, 2004, 25 (1): 106-109 (in Chinese)
[17] Eskin D, et al. Modeling of particle deposition in a vertical turbulent pipe flow at a reduced probability of particle sticking to the wall [J]. Chemical Engineering Science. 2011, 66(20): 4561-4572
[18] Li Chuanxian. Effects of stress and oscillatory frequency on the structural properties of Daqing gelled crude oil at different temperatures [J]. Journal of Petroleum Science and Engineering, 2009, 65(3): 167-170 (in Chinese)
[19] Huang Qiyu. Modeling of wax deposition in waxy crude pipelines[D]. Beijing: China University of Petroleum, 2000
[20] Rainer H, Lene A. Single-phase wax deposition experiments [J]. Energy & Fuels, 2010, 24(2): 1069-1080
[21] Maths H, Benjamin K A. Online estimation of wax deposition thickness in single-phase sub-sea pipelines based on acoustic chemometrics: A feasilility study[J]. Fuel, 2013, 105: 718-727
[22] Haaland S E. Simple and explicit formulas for the friction factor in turbulent pipe-flow[J]. Journal Fluids Engineering, 1983, 105: 89-90
[23] Yang Xiaoheng. Pipeline Design and Management[J]. Dongying: China University of Petroleum Press, 2006
date: 2015-06-14; Accepted date: 2015-08-06.
Prof. Huang Qiyu, Telephone: +86-10-89732203; E-mail: ppd@cup.edu.cn.
猜你喜欢
杂志排行
中国炼油与石油化工的其它文章
- Numerical Simulation of Enhanced Oil-Water Separation in a Three-Stage Double-Stirring Extraction Tank
- Design and Control of Self-Heat Recuperative Distillation Process for Separation of Close-Boiling Mixtures: n-Butanol and iso-Butanol
- Computational Fluid Dynamics Simulation of Liquid-Phase FCC Diesel Hydrotreating in Tubular Reactor
- Promotional Effect of CoO(OH) on Selective Hydrogenation of Maleic Anhydride to γ-Butyrolactone over Supported Ruthenium Catalyst
- Microbial Characterization of Denitrifying Sulfide Removal Sludge Using High-Throughput Amplicon Sequencing Method
- Hydrothermal Liquefaction of Wheat Straw in Sub-critical Water/Ethanol with Ionic Liquid for Bio-oil Production