Computational Fluid Dynamics Simulation of Liquid-Phase FCC Diesel Hydrotreating in Tubular Reactor
2015-06-22LiHuaLiuNingqiangZengZhiyuZouYingWangJiming
Li Hua; Liu Ningqiang; Zeng Zhiyu; Zou Ying; Wang Jiming
(1.Research Institute of Petroleum Processing, East China University of Science and Technology, Shanghai 200237; 2. SINOPEC Changling Company, Yueyang 414012; 3. Hunan Changling Petrochemical S&T Developing Co., Ltd., Yueyang 414012; 4. China Petrochemical Corporation, Beijing 100728)
Computational Fluid Dynamics Simulation of Liquid-Phase FCC Diesel Hydrotreating in Tubular Reactor
Li Hua1,2; Liu Ningqiang1; Zeng Zhiyu3; Zou Ying1; Wang Jiming1,4
(1.Research Institute of Petroleum Processing, East China University of Science and Technology, Shanghai 200237; 2. SINOPEC Changling Company, Yueyang 414012; 3. Hunan Changling Petrochemical S&T Developing Co., Ltd., Yueyang 414012; 4. China Petrochemical Corporation, Beijing 100728)
The computational fluid dynamics (CFD) code, FLUENT, was used to simulate the liquid-phase FCC diesel hydrotreating tubular reactor with a ceramic membrane tube dispenser. The chemical reaction and reaction heat were added to the model by user-defined function (UDF), showing the distribution of temperature and content of sulfides, nitrides, bicyclic aromatics and monocyclic aromatics in different parts of the reaction bed. When the pressure was 6.5 MPa, the amount of mixing hydrogen was 0.84% (m), the space velocity was 2 h-1and the inlet temperature was 633K, the temperature reached a maximum at a height of 0.15 m, and the range of radial temperature reached its maximum (2.5 K) at a height of 0.15 m. It indicated that the proper ratio of height to diameter of catalyst bed in the tubular reactor was 5-6. The increase of inlet temperature, the mixing hydrogen and the decrease of space velocity led to the decrease in the content of bicyclic aromatics, sulfides and nitrides, and the increase in monocyclic aromatics content, while the high temperature increased. The results were in good agreement with experimental data, indicating to the high accuracy of the model.
FCC diesel; tubular liquid-phase hydrogenation; computational fluid dynamics (CFD)
1 Introduction
The capacity of catalytic cracking units is quite enormous in China and the FCC diesel constitutes a high proportion of the total diesel pool. Due to the high aromatic and sulfur contents and low cetane number of FCC diesel, the hydrotreating technology is needed to meet the increasingly stringent environmental regulations. Currently, a new technology, the liquid-phase hydrotreating, has been commercialized. The process has canceled the recycle system of hydrogen; instead, it uses plenty of cycle oil carrying dissolved hydrogen to provide hydrogen for hydrogenation reactions. The liquid-phase hydrotreating technology overcomes the problems that diesel and hydrogen cannot be fully mixed and reaction conversion is low in the traditional trickle-bed[1]process, and meanwhile lowers the equipment investment and energy consumption. The SINOPEC Changling Company has improved the liquid-phase hydrotreating technology and developed a new technology of liquid-phase diesel hydrogenation in a tubular reactor. There are two cores in this technology. One is that it adds a nanoscale ceramic membrane dispenser at the inlet of the reactor, in order to make the hydrogen fully disperse in diesel and improve the interfacial contact. The other is that it can set many points to add the hydrogen at different parts of the reactor. This measure can decrease the amount of hydrogen added at the inlet of the reactor, avoiding the existence of hydrogen gas phase in the reaction and improving the hydrogen efficiency. Therefore, this technology can eliminate the system for circulating oil and hydrogen, decreasing the reactor diameter and reducing the investment and energy consumption.
In this paper, the computational fluid dynamics software Fluent was used to simulate the liquid FCC diesel hydrogenation in the tubular reactor and describe the content of reactants and temperature distribution in different parts of the catalyst bed. It also validates the model through comparison between the simulation results and the experimental data, so as to provide guidance for the design ofmulti-part hydrogenation solutions and the realization of commercialization.
2 CFD Model for the Fixed-Bed Reactor
2.1 The geometry of reactor
Due to the use of the ceramic membrane tube dispenser at the inlet of reactor, the hydrogen has achieved nanoscale dispersion in the oil phase. The hydrogen which exceeds the saturated dissolution can be dispersed in FCC diesel as fine bubbles within a certain time. As the bubbles flow with the FCC diesel at the same speed, the reactor is regarded as a liquid-solid two phase reactor.
The simulation object is the liquid-phase hydrogenation fixed bed reactor in laboratory. The reactor geometry and structural dimensions are shown in Figure 1. The computational region is the reaction bed. Using the Gambit software to draw the mesh, the structure of the mesh is shown in Figure1. The number of meshes is 22080.

Figure 1 Reactor geometry and mesh
In order to meet the engineering demand of the simulation results, the space filled with catalyst particles in the fixedbed reactor is assumed as a continuous porous medium, which in CFD is modeled as a fluid region with extra terms in the momentum balance to allow for additional resistance to flow. Moreover, due to the complexity of fluid flow in the porous medium, the turbulent model is thoroughly discussed and simplified in the section. The detailed equations are presented in the following sections.
2.2 Governing equations
Since there are solid and fluid phases in the porous medium, the flow is influenced by the solid matrix, which occupies space and extracts energy from the reaction zone. It is assumed that the solid is chemically inert. The main governing equations of the porous medium model are shown in Table 1.

Table 1 Main governing equations of the porous medium model[2-3]
2.3 Turbulent model
In the present study, the value of Re for the porous medium is about 2.7—13.9 in the Forchheimer[5]area. In the porous medium, the fluid flow can change from the laminar flow to turbulence with the Reynolds number (Re) increased. Guardo, et al.[6-7]further investigated the influence of the turbulence model in CFD modeling of wallto-fluid heat transfer on packed beds. In Guardo, et al.’swork, five different RANS turbulence models including the Spalart-Allmaras model (one-equation model) were selected. In their work, the results obtained from the Spalart-Allmaras turbulence model showed better agreement than the two-equation RANS models. This could be explained by the fact that the Spalart-Allmaras model uses a coupling between the wall and the damping functions in the near-wall treatment, which does not include additional diffusion or dissipation terms in its formulation and does not present the stagnation point anomaly. The transport equation for is[8]:

2.4 Boundary conditions
At the reactor inlet, the velocity inlet is specified. The velocity, temperature and components at the reactor inlet can be calculated based on the boundary conditions of the reactor inlet. At the reactor outlet, the pressure outlet is specified. Furthermore, for the inner wall of the reactor, the fluids are assumed to obey the no slip boundary condition at the wall.
On the other hand, the temperature at the inlet is controlled at a specific value in the experiment. Due to the presence of heat dissipation in the reactor, its radial temperature is different. The reaction heat is estimated according to the experimental data.
The density of FCC diesel has been determined according to the Chinese national standard GB/T 1885—1998. The viscosity of FCC diesel has been calculated by Equation (2)[9].

For the case which specifies that the wall temperature keeps constant and the flow is in the transition flow range, αfcan be calculated according to Equation (3)[10].

2.5 Reaction kinetic model
According to the experimental results, the total saturated hydrocarbons and aromatics have little change during the reaction in FCC diesel within the range of experimental conditions; because of the low content of tricyclic aromatics which show little change before and after the reaction, the changes in the content of total saturated hydrocarbons, aromatics and tricyclic aromatics are ignored. Only the changes in monocyclic aromatics, bicyclic aromatics, sulfides and nitrides are considered. The kinetic models of sulfides, nitrides, bicyclic aromatics and monocyclic aromatics are established as shown by Equations (4)—(7).

Upon fitting each parameter through the Levenberg-Marquardt and global optimization[11], the results are shown in Equations (8)—(11), which are put into the Fluent by the user-defined function (UDF).
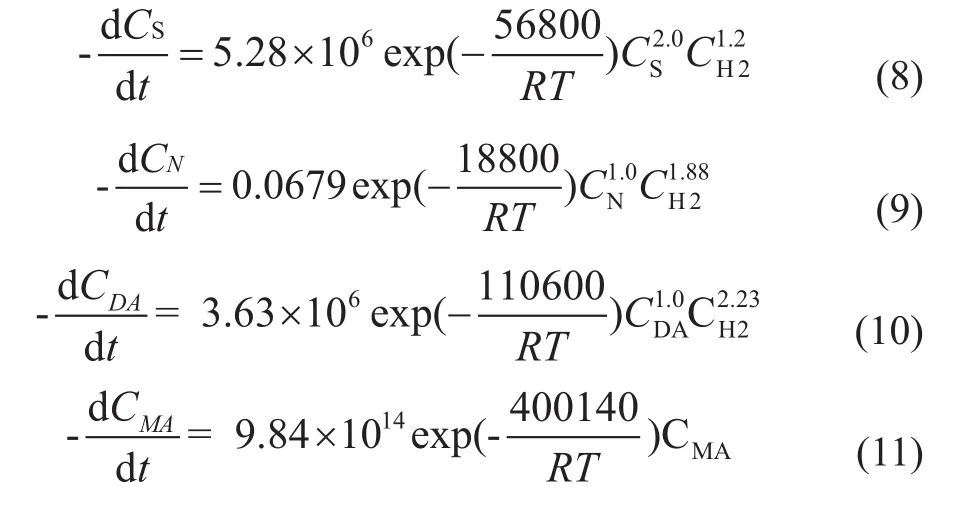
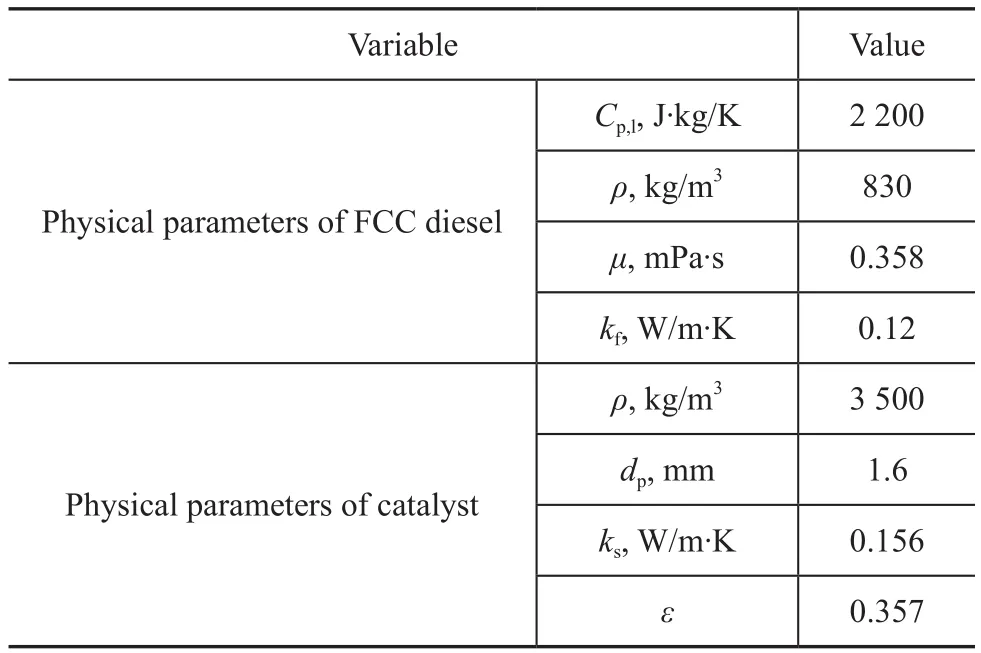
Table 2 Physical parameters of FCC diesel and catalyst
2.6 CFD modeling method
The equations mentioned above are solved by the commercial CFD code Fluent 6.3.26 (Ansys Inc., USA) in a double precision mode. The pressure and the velocity are coupled by the SIMPLE algorithm. Calculation should be continued until the residuals are below the requirements[12].
3 Results and Discussion
3.1 Simulation of the content and temperature contours
To confirm that the CFD results are independent of the mesh size, simulations are carried out at 7680, 22080 and 70770 meshes. The content of sulfur is 1 255.3 μg/g, 1 250 μg/g and 1 246.7 μg/g. The results are independent of the mesh size, so the simulation at 22080 meshes is discussed.
When the pressure is 6.5 MPa, the amount of mixing hydrogen is 0.84%, the space velocity is 2 h-1, and the inlet temperature is 633 K. Figure 2 and Figure 4 show the content contour of the reactants and the temperature contour.
In Figure 2, the different colors represent the different contents of the reactants. The contents of sulfides, nitrides and bicyclic aromatics are decreased and monocyclic aromatics are increased from the inlet to the outlet. The different sizes of the color areas represent the different change rates of the reactants. Figure 3 shows the contents of the reactants along the reactor bed. The rate for removal of sulfides is higher than the rate for removal of nitrides. They all stabilize at the outlet of the catalyst bed. Figure 6 shows the distribution of temperature along the reactor bed. The process of FCC diesel hydrogenation is an exothermic process. As the reaction goes on, the temperature increases along the height of the reactor bed. At the inlet of the reactor bed, the content of reactants is high, so the reaction rate and the exothermic rate are high also. When the temperature continues to increase, the exothermic rate slows down with the decrease of the reactant content, and the maximum temperature (643.3K) is determined at the height of 0.15 m due to the heat dissipation effect, which is by 10.3 K higher than the entrance temperature (Figure 5). After the location of the maximum temperature is determined, the reaction tem-perature, the content of the reactants and the reaction rate then decline, and the catalyst utilization rate also drops. In order to improve the desulfurization and denitrification rates and also improve the aromatics conversion rate, the conditions of hydrogenation reaction have to be changed. Since the maximum temperature appears at a height of 0.15 m and the ratio of height to diameter is 5.36, the suitable ratio of height to diameter in the catalyst bed should be 5—6, which also means that new hydrogenation points are required after the maximum temperature point in order to improve the condition of hydrogenation reaction.

Figure 2 Mass fraction contour (a: sulfides; b: nitrides; c: bicyclic aromatics; d: monocyclic aromatics)

Figure 3 Distribution of reactants content along the reaction bed■—sulfide;●—nitride;▲—bicyclic aromatic;▼—monocyclic aromatic
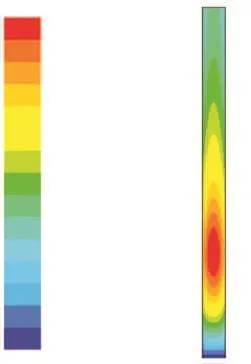
Figure 4 Temperature contour
Figure 6 shows that the radial temperature varies at different height of the reactor bed. The temperature at the tube center is higher than that of the wall. At the height of 0.15 m, the range of radial temperature reaches a maximum value (2.5K).
3.2 Effects of operating conditions on the hydrogenation process
3.2.1 The effect of inlet temperature
At a space velocity of 2 h-1with 0.84% of mixing hydrogen, Figure 7 shows the simulation results obtained at different inlet temperatures. It is shown that the increase of inlet temperature can lead to decreased content of bicyclic aromatics, sulfides and nitrides and increased content of monocyclic aromatics. The inlet temperature has more sensitive effect on the content of the monocyclic aromatics and bicyclic aromatics than nitrides. The increase of the inlet temperature can also lead to the increase of the maximum temperature. The maximum temperature rise reaches 14.2 K when the inlet temperature is 653 K, and the minimum temperature rise is 6.9 K when the inlet temperature is only 603 K. Because higher inlet temperature can lead to higher reaction rate and higher exothermic rate, the temperature rise is relatively high. Moreover, it is also shown that the location of the maximum temperature does not change obviously.
3.2.2 The effect of the amount of mixing hydrogen
At a space velocity of 2 h-1and an inlet temperature of 633 K, Figure 8 shows the simulation results obtained at different amounts of mixing hydrogen. It is shown that the increase of mixing hydrogen can lead to a decreasing content of bicyclic aromatics, sulfides and nitrides and an increasing content of monocyclic aromatics. The amount of mixing hydrogen shows a more sensitive effect on the simulation results. Higher mixing hydrogen amount would be much better for the desulfurization and denitrification reactions, and also more beneficial to the conversion of bicyclic aromatics and monocyclic aromatics[13-16]. The increase in the amount of mixing hydrogen can also lead to the increase of the maximum temperature. The maximum temperature rise reaches 15.6 K when the mixing hydrogen dosage is 1.12%, and the minimum temperature rise is 3.3 K when the mixing hydrogen amount is 0.42%. Because higher mixing hydrogen can lead to higher reaction rate and high-er exothermic rate, the temperature rise is relatively high. Moreover, it is also shown that the location of the maximum temperature will slightly move backward.

Figure 5 Temperature distribution along the reactor bed (r=0.014 m)
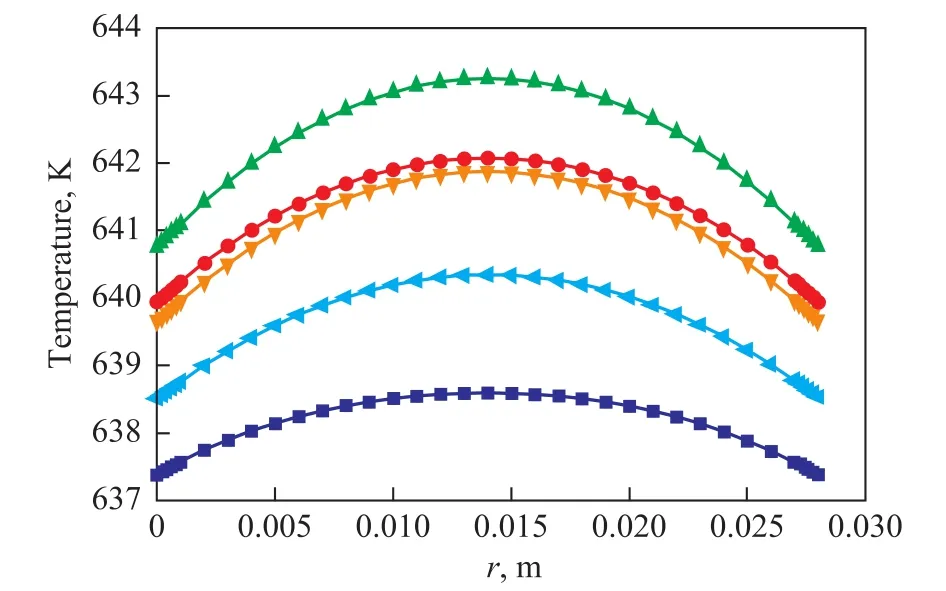
Figure 6 Temperature distribution along the radial direction of the reactor■—H=0.05 m;●—H=0.10 m;▲—H=0.15 m;▼—H=0.20 m; —H=0.25 m

Table 3 Comparison of experimental values and simulation values
3.2.3 The effect of space velocity
At a mixing hydrogen amount of 0.84% (m) and an inlet temperature of 633 K, Figure 9 shows the simulation results at different space velocities. It is shown that the increase of space velocity can lead to the increasing content of bicyclic aromatics, sulfides and nitrides and the decreasing content of monocyclic aromatics. High space velocity is not conducive to the reaction outcome. The increase of space velocity can lead to the decrease of maximum temperature. The maximum temperature rise is 12.5 K when the space velocity is 1 h-1, and the minimum temperature rise reaches 9.0 K when the space velocity is 5 h-1. When the space velocity increases, the volume flow rate of the material as well as the Reynolds number in the reactor bed increase also, resulting in the increase of both the axial and radial heat transfer rates. Therefore, the radial temperature difference would reduce, while the hot spot temperature decreases and its position moves backward.

Figure 7 Effect of the inlet temperature on the simulation results■—603 K;●—613 K;▲—623 K;▼—633 K; —653 K

Figure 8 Effect of the mixing hydrogen amount on the simulation results■—0.42%;●—0.56%;▲—0.71%;▼—0.84%; —1.12%
4 Conclusions
(1) The content of sulfides, nitrides, bicyclic aromatics decreases and the monocyclic aromatics content increases from the inlet to the outlet. The content of reactants shows different rate of changes at different height of the reactor bed. The rate for removal of sulfides is higher than that of the nitrides. However, they all stabilize at the outlet of the reactor bed.
(2) The temperature is different along the radial direction of the reactor bed, and the maximum temperature difference is 2.5 K. The temperature is also different along the axial direction of the reactor. When the pressure is 6.5 MPa, the amount of mixing hydrogen is 0.84 m%, and the space velocity is 2 h-1, while the inlet temperature is 633 K. The maximum temperature (643.3 K) appears at a height of 0.15 m, which is by 10.3 K higher compared with the entrance temperature. After the location of the maximum temperature is determined, the temperature, the content of the reactants and the reaction rate all decrease, while the utilization rate of catalytic drops. In order to improve the rate of desulfurization and denitrification reactions and aromatic conversion, the conditions of hydrogenation should be changed. Since the maximum temperatureappears at a height of 0.15 m and the ratio of height to diameter is 5.36, a suitable ratio of height to diameter should be 5—6 in catalyst packing. It also means that new hydrogenation points are required in order to improve the condition of hydrogenation reaction.
(3) The increase of the inlet temperature and the mixing hydrogen amount, and the decrease of space velocity can lead to the decrease in the content of bicyclic aromatics, sulfides and nitrides and the increase in the content of monocyclic aromatics. They also can lead to high temperature rise.
Nomenclature
ui— liquid velocity, m/s
Sm—quality source term
Si—momentum source term
p—pressure, Pa
d—tube inner diameter, m
dp—particle diameter, m
Yi—mass fraction of i
Ri—reaction rate, kg/m3·s
Di,m—diffusion coefficient, m2/s
Ef—liquid calories, kg·m2/s2
ES—solid heat, kg/m2·s2
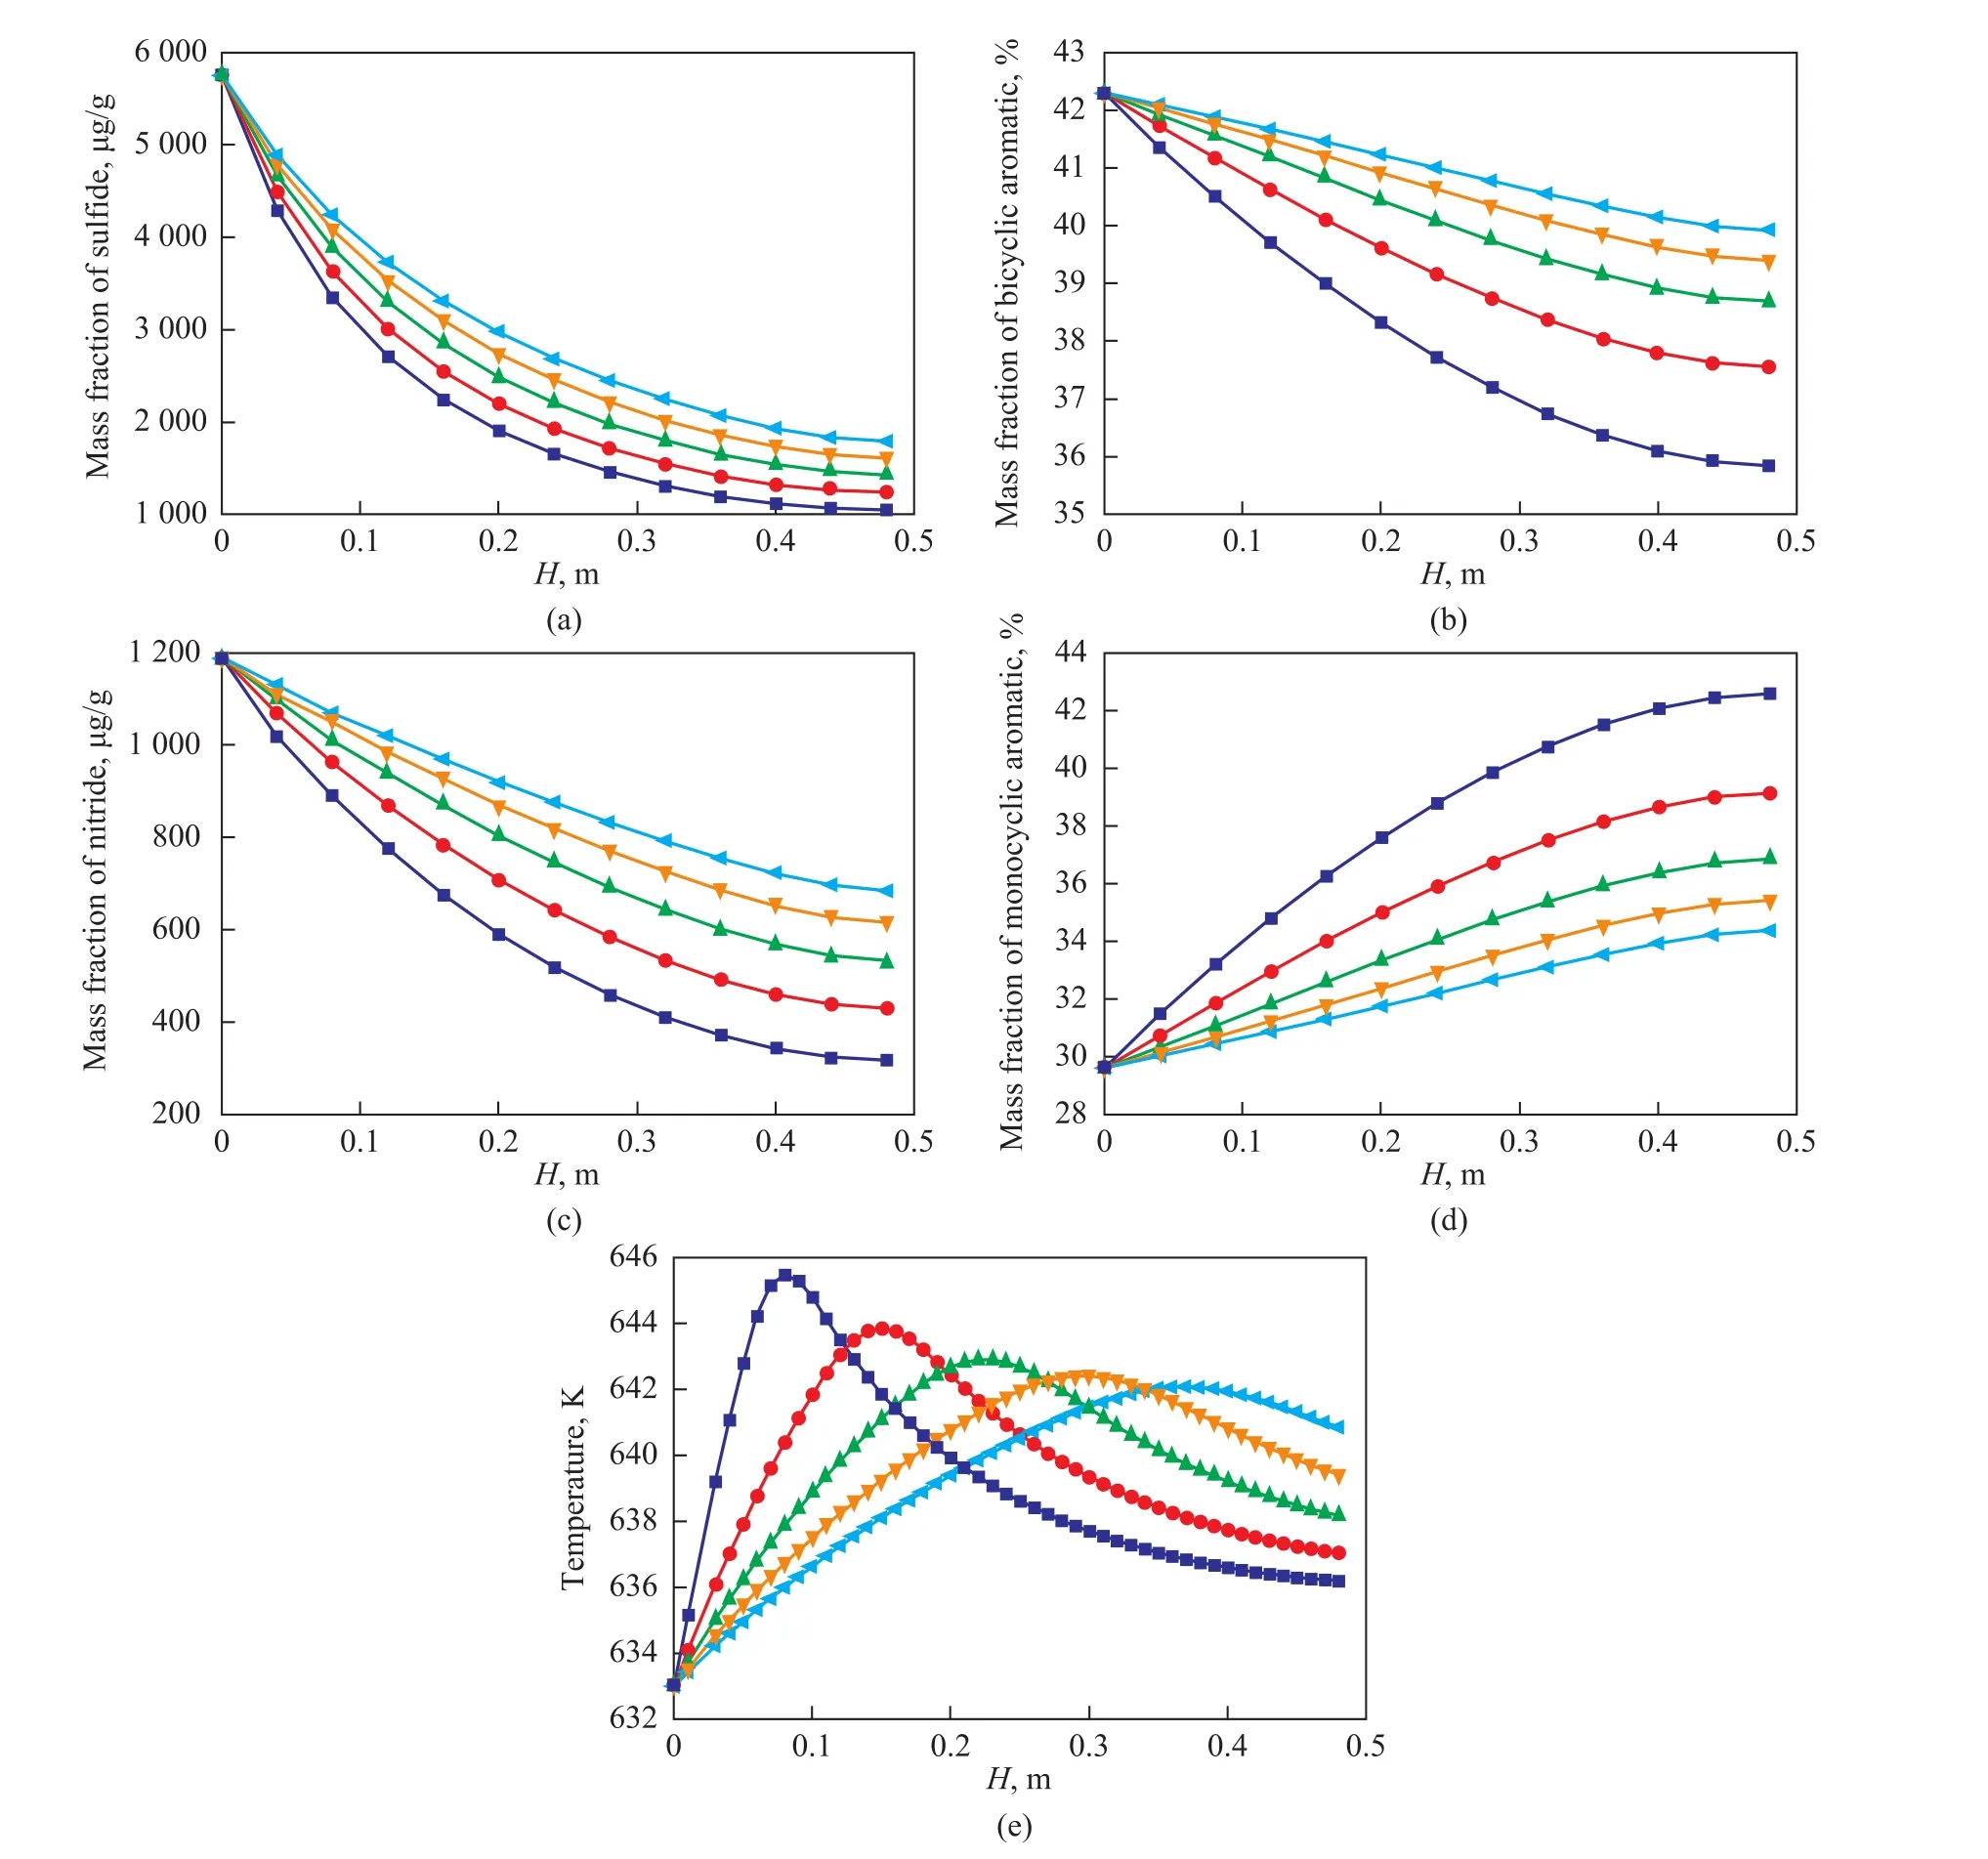
Figure 9 Effect of space velocity on the results■—1 h-1;●—2 h-1;▲—3 h-1;▼—4 h-1; —5 h-1
ke—total heat transfer coefficient, W/m·K
hi—enthalpy change, J/kg
Sf—energy source term
kf—liquid thermal conductivity, W/m·K
ks—solid thermal conductivity, W/m·K
υ—viscosity, m/s2
Nu—Nusel number
C—mass fraction of sulfides
XH2—mass fraction of H2
Cp,l—liquid heat capacity, J·kg/K
Ys—content of sulfide
CDA—content of bicyclic aromatic
CMA—content of monocyclic aromatic
k0—pre-exponential factor
n1—sulfide reaction order
m1—H2reaction order
n2—nitride reaction order
m2—H2reaction order
n3—bicyclic aromatic reaction order
m3—H2reaction order
E—activation energy, kJ/mol
ρ—density, kg/m3
τij—stress tensor, N/m2
μ—viscosity, Pa·s
ε—porosity
ρs—solid density, kg/m3
αf—convective heat transfer coefficient, W/m2·K
[1] Bharvanl R R, Henderson R S. Revamp your hydrotreater for deep desulfurization: clean fuels[J]. Hydrocarbon Processing, 2002, 81(2): 61-64
[2] Wakao N, Kagei S. Heat and Mass Transfer in Packed Beds[M]. Taylor & Francis, 1982
[3] Sun S, Lan X, Ma S, et al. Numerical simulation of the transfer and reaction processes in catalytic reforming fixed bed reactors[J]. Acta Petrolei Sinica (Petroleum Processing Section), 2008, 24(1): 38 (in Chinese)
[4] Ergun S. Fluid flow through packed columns[J]. Chem. Eng. Prog, 1952, 48: 89-94
[5] Bear J, Corapcioglu V. Fundamentals of Transport Phenomena in Porous Media[M]. M. Nijhoff: The Netherlands, 1984: 199-254
[6] Guardo A, Coussirat M, Larrayoz MA, et al. CFD flow and heat transfer in nonregular packing for fixed bed equipment design[J]. Ind Eng Chem, 2004, 43(22): 7049-7056
[7] Guardo A, Coussirat M, Larrayoz M A, et al. Influence of the turbulence model in CFD modeling of wall-to-fluid heat transfer in packed beds[J]. Chemical Engineering Science, 2005, 60(6): 1733-1742
[8] Spalart P, Allmaras S. A one-equation turbulence model for aerodynamic flows[R]. American Institute of Aeronautics and Astronautics AIAA-92-0439, 1992
[9] Xu Chunming, Yang Chaohe. Petroleum Refining Engineering[M]. Beijing: Petroleum Industry Press, 2009: 59-73 (in Chinese)
[10] Wang Yundong, Luo Guangsheng, Liu Qian. The Principle of Transfer Processes[M]. Beijing: Tsinghua University Press, 2002: 211-213 (in Chinese)
[11] Wang Hongtao, Wang Hua, Chai Xianfeng. Study on kinetic model of diesel hydrodesulfurization[J]. Chemical Industry and Engineering Progress, 2009, 28(5): 769-772 (in Chinese)
[12] FLUENT User Manual 6.3. Fluent Inc
[13] Liu Lihua, Liu Shuqun. Ni2P-MoS2/γ-Al2O3catalyst for deep hydrodesulfurization via the hydrogenation reaction pathway[J]. China Petroleum Processing and Petrochemical Technology, 2014, 16(4): 12-18
[14] Chen Wenyi, Zou Kai, Wang Xiuwen, et al. Correlation of properties and compositions of hydrotreated lube base oil[J]. Petroleum Processing and Petrochemicals, 2014, 45(10): 94-98 (in Chinese)
[15] Shao Zhicai, Zhao Xinqiang, Liu Tao, et al. Commercial application of the second generation RHT catalysts for hydroprocessing the residue with low sulfur and high nitrogen contents[J]. China Petroleum Processing and Petrochemical Technology, 2014, 16(1): 1-7
[16] Yang Huibin, Zhang Qing, Jiang Hongbo, et al. Thermodynamics of 2-methylphenanthrene hydrogenation reaction[J]. Petroleum Processing and Petrochemicals, 2014, 45(6): 15-19 (in Chinese)
date: 2015-06-02; Accepted date: 2015-07-23.
Professor Zou Ying, Telephone: +86-21-64252816; E-mail: yzou@ecust.edu.cn.
杂志排行

中国炼油与石油化工的其它文章
- Promotional Effect of CoO(OH) on Selective Hydrogenation of Maleic Anhydride to γ-Butyrolactone over Supported Ruthenium Catalyst
- Quantitative Analysis Using Fourier Transform Ion Cyclotron Resonance Mass Spectrometry and Correlation between Mass Spectrometry Data and Sulfur Content of Crude Oils
- Hydrothermal Liquefaction of Wheat Straw in Sub-critical Water/Ethanol with Ionic Liquid for Bio-oil Production
- Microbial Characterization of Denitrifying Sulfide Removal Sludge Using High-Throughput Amplicon Sequencing Method
- Synthesis and Separation Performance of Y-type Zeolite Membranes by Pre-Seeding Using Electrophoresis Deposition Method
- Design and Control of Self-Heat Recuperative Distillation Process for Separation of Close-Boiling Mixtures: n-Butanol and iso-Butanol