An Incursion of O ff-EquatorialSubsurface Cold Water and Its Role in Triggering the“Double Dip”La Ni˜na Event of 2011
2015-04-20ZHENGFeiFENGLishaandZHUJiang
ZHENG FeiFENG Lishaand ZHU Jiang
1International Center for Climate and Environment Science,Institute ofAtmospheric Physics, Chinese Academy of Sciences,Beijing100029
2College of Atmospheric Sciences,Chengdu University of Information Technology,Chengdu610225
An Incursion of O ff-EquatorialSubsurface Cold Water and Its Role in Triggering the“Double Dip”La Ni˜na Event of 2011
ZHENG Fei∗1,FENG Lisha1,2,and ZHU Jiang1
1International Center for Climate and Environment Science,Institute ofAtmospheric Physics, Chinese Academy of Sciences,Beijing100029
2College of Atmospheric Sciences,Chengdu University of Information Technology,Chengdu610225
Based on Global Ocean Data Assim ilation System(GODAS)and NCEP reanalysis data,atmospheric and oceanic processes possibly responsible for the onsetof the 2011/12 La Ni˜na event,which followed the 2010/11 La Ni˜na even—referred to as a“double dip”La Ni˜na—are investigated.The key mechanisms involved in activating the 2011/12 La Ni˜na are illustrated by these datasets.Results show that neutral conditions were already evident in the equatorial eastern Pacific during the decaying phase of the 2010/11 La Ni˜na.However,isothermalanalyses show obviously cold water still persisting at the surface and atsubsurface depths in off-equatorial regions throughoutearly 2011,being mostpronounced in the tropicalSouth Pacific.The negative SST anomalies in the tropical South Pacific acted to strengthen a southern w ind across the equator.The subsurface cold water in the tropical South Pacific then spread northward and broke into the equatorial region at the thermocline depth.This incursion process ofoff-equatorialsubsurface cold watersuccessfully interrupted the eastern propagation of warm water along the equator,which had previously accumulated atsubsurface depths in the warm pool during the 2010/11 La Ni˜na event.Furthermore,the incursion process strengthened as a resultof the off-equatorialeffects,mostly in the tropical South Pacific.The negative SST anomalies then reappeared in the centralbasin in summer 2011,and acted to trigger local coupled air–sea interactions to produce atmospheric–oceanic anomalies thatdeveloped and evolved w ith the second cooling in the fallof 2011.
“double dip”La Ni˜na,subsurface cold water,incursion,off-equatorialprocess
1.Introduction
ENSO is the strongestsignalofair–sea interaction,which periodically develops in the tropical Pacific and exerts a surprisingly significant influence on short-term global climate change(e.g.,Huang and Wu,1989;Neelin et al., 1998;Alexanderand Scott,2002;Toniazzo and Scaife,2006; Philippon et al.,2012).The significance of ENSO has been documented by many researchers(e.g.,Wang and Picaut, 2004;M cPhaden et al.,2006;Wang et al.,2012).Recently, ENSO has been receiving increased attention due to the appearance of a new type of El Ni˜no,the Central-Pacific(CP) El Ni˜no(e.g.,Kao and Yu,2009;Yu etal.,2010),which has maximum SST anomalies centered near the dateline.
As many efforts have been made to develop and enforce the performance of ENSO models(e.g.,Jietal.,1996;Latif etal.,1998;Kleeman and Moore,1999;Zhang etal.,2003; Zheng et al.,2006a,2006b;2007;Zheng and Zhu,2008; Jin etal.,2008;Zheng etal.,2009;Zheng and Zhu,2010a, 2010b;Barnston etal.,2012),theirskills in predicting ENSO have gradually improved.However,the real-time ENSO prediction skillof models in the pastdecade has been somewhat lower than the less advanced models of the 1980s and 1990s (Barnston etal.,2012).Additionally,Barnston etal.(2012) suggested an apparent retrogression in skillexists for ENSO prediction in the 2002–11 study period compared w ith that in the 1981–2010 period.The 9-yr sliding correlation for the hindcasts over the 1981–2010 period has an average score of 0.65 ata 6-month lead time,but the prediction skill of correlation decreases to 0.42 for the 2002–11 period.There are two possible explanations for this abnormal phenomenon in the pastdecade:one is due to the more frequentoccurrences of CP El Ni˜no(Lee and M cPhaden,2010;M cPhaden et al., 2011;Xiang etal.,2012);and the other is the appearance ofa specialkind of La Ni˜na(Zhang etal.,2013;Hu etal.,2014), which follows a previous La Ni˜na event(e.g.,the 2011/12 event),and is referred to as“double dip”La Ni˜na hereafter in this paper.
M cPhaden and Zhang(2009)argued that there is a ten-dency for some La Nin˜a events to persistand re-emerge for a second cooling year after 1980.However,most ENSO models are unable to successfully predict this kind of second cooling eventuntilnow(Barnston etal.,2012).Specifically, among allENSO prediction models(14 dynam icaland 8 statistical)listed on the InternationalResearch Institute for Climate and Society(IRI)website athttp://iri.columbia.edu/climate/ENSO/currentinfo/SST table.htm l,most failed to forecastthe Nin˜o3.4 SST anomalies of the 2011/12 event,starting from early-m id 2011,and only one model[an intermediate coupled model(ICM)used by Zhang et al.(2013)]gave a successful prediction of 2011 cold SST conditions over the tropical Pacific one year in advance.This presents a critical challenge to the ENSO prediction community(Barnston et al.,2012)and suggests an imperative demand to understand the physical processes leading to the second-year cooling in 2011.Zhang et al.(2013)demonstrated that thermocline feedback is a crucial mechanism affecting the interannual SST evolution of the“double dip”in 2011,which is specifically represented by the relationship between the oceanic entrainment temperature(Te)and sea level(SL)in the ICM. At the same time,the persistentand sufficiently strong easterly w ind anomaly over the western-central equatorial Pacific,which operates to sustain the large negative subsurface thermal variability off and on the equator to significantly affect the SST evolution during 2010–12 associated w ith the thermocline feedback,has been demonstrated to be another key process by Zhang etal.(2013).Hu etal.(2014)argued there can be two preconditions responsible for the continuation of a La Ni˜na event:one,which is necessary but insufficienton its own,is that the previous La Ni˜na mustbe a strong event;and the other is whether there are eastward propagating downwelling warm equatorial Kelvin waves during the decaying phase of the fi rst La Ni˜na.Moreover,it has been suggested that the subtropical–tropical teleconnection is important and cannot be ignored for the occurrence of ENSO events(Vimontetal.,2001;Wang and Yang,2014).Vimont etal.(2001)proposed a seasonal footprinting mechanism to explain how m idlatitude atmospheric variability could lead to tropical ENSO variability via atmosphere–ocean coupling in the subtropics.Wang and Yang(2014)investigated the impactof subtropical Pacific sea surface temperature anomalies(SSTAs)on the equatorialocean,and proposed a w ind–evaporation–SST mechanism as playing the dominant role in equatorialSST changes.However,allpreviousstudies on the 2011/12 La Ni˜na event lack a detailed description of its onsetand evolution due to the qualification of observations and oceanic 3D monitoring,which is crucial in order to understand the mechanism causing the second-year cooling during the long-lived 2010–12 La Ni˜na event.
In this work,to elucidate the trigger mechanism of the 2011/12 La Ni˜na event,we exam ine the atmospheric and oceanic processes related to the evolution of the 2011/12 La Ni˜na in detail,through analyzing the 3D reanalysis fields from the GlobalOcean Data Assimilation System(GODAS) and its calculated diagnostic variables.We focus on the roles played by off-equatorialsubsurface temperature anomalies in the tropical South and North Pacific through exam ining the subsurface temperature evolution of isotherms.In order to observe the pathways consistently throughout the basin from the off-equatorial to the equatorial region,isothermal analyses are performed using the 3D temperature fi elds.Seeing as the subsurface temperature anomalies tend to propagate along isothermalsurfaces,an isothermalanalysisisnecessary and can better characterize the temporalevolution and the 3D structure of the upper ocean.The major finding in this work is that the enhanced southeasterly w ind anomalies over the tropical Pacific from March to June in 2011,associated w ith the negative SST anomalies in the tropical South Pacific that were leftbehind by the 2010 moderate La Ni˜na event,played a key role in spreading the subsurface cold water over the tropical South Pacific northward.The subsurface cold water then broke into the equatorial region at thermocline depth to activate the onsetof the second cooling in summer 2011.In addition,analyzing the temperature anomalies at isothermal surfaces makes itclear thatthe incursive pathway of cold subsurface waterwas along the thermocline depth and originated from off-equatorial regions,mostly in the tropical South Pacific.
The remainderof the paper is organized as follows.Section 2 briefl y introduces the datasetand analysis method used in this work.Section 3 describes the onset and evolution of the 2011/12 La Ni˜na event in detail.Section 4 is concerned w ith the incursion process from the extratropical subsurface cold water into the equatorial region.And finally,a discussion and conclusions are presented in section 5.
2.Datasetand analysis method
The monthly mean data for temperature and SL are from GODAS(Behringer and Xue,2004),which are operationally provided by the National Centers for Environmental Prediction(NCEP).The horizontal resolution in the zonal and meridional direction of GODAS is 1◦× (1/3)◦and the products have 40 levels w ith a 10 m resolution in the upper 200 m.The monthly mean atmospheric reanalysis data,including sea level pressure(SLP)and w ind stress,are from the NECP–DOE(National Centers for Environmental Prediction–Departmentof Energy)Reanalysis II(Kanam itsu etal.,2002),w ith a resolution of2.5◦×2.5◦and a T62 Gaussian grid(192×94),respectively.Both the GODAS products and atmospheric NCEP reanalysis datasets cover the period from January 1982 to December2011,and the long-term climatological fields are generated based on the period 1982–2004.
It is well known that the dynam ic and thermodynam ic processes at subsurface layers(e.g.,the m ixing and entrainment)contribute to interannual SST variations(e.g.,Zebiak and Cane,1987;Wang and M cPhaden,2000).Moreover,the thermocline and its variations play an important role in affecting ENSO evolution,butobservation systems for subsurface structure have been very scarce in the past(Wang etal., 2012).The available 3D GODAS products provide a uniqueopportunity to investigate the 3D structure of the upperocean and ENSO evolution in more detail.Furthermore,it is also worth mentioning that the 3D structure of the temperature field in the GODAS products—especially the distributions of the subsurface temperature,which play a critical role in ENSO evolution—is highly correlated w ith thatof the Argo datasetover the tropicalPacific.In this study,due to the poor quality of the salinity fields in GODAS,instead of the isopycnal analyses,isothermal analyses are performed using the 3D temperature fields to better characterize the temporalevolution and 3D structure over the tropical Pacific during the 2011/12“double dip”La Ni˜na event.The thermocline depth is defined as the depth where the 20◦C isotherm is located, and the climatologicaland interannually varying temperature at the thermocline depth are also calculated.
3.Onsetand evolution of the 2011/12 La Ni˜na
Various GODAS and NCEP reanalysis data involving the atmospheric and oceanic processes responsible for the onset and evolution of the 2011/12 La Ni˜na eventare investigated in this section.Figure 1 shows the temporalevolutions of the interannual variations in SST,SL,zonal w ind stress(Taux), meridional w ind stress(Tauy),and thermocline depth in the equatorial Pacific in 2011.The developmentof the 2011/12 La Ni˜na event is quite clear at the equator,and there is a close relationship among these anomalous fields.For the SST anomalies,there is a shiftof the cold–warm–cold conditions over the equatorial central-eastern Pacifi c during the whole of 2011(Fig.1a).A second cooling at the sea surface occurs in m id-to-late 2011,follow ing the fi rst cooling in the fallof 2010(notshown).The 2010 moderate La Ni˜na event seems to end in spring 2011(Zhang etal.,2013).Then,the equatorialeastern Pacific experiences neutralSST conditions and w itnesses this weak La Ni˜na event(i.e.,“double dip”La Ni˜na event)in August 2011.The weak La Ni˜na conditions gradually develop to moderate intensity during November 2011.The key feature here is the appearance of the second cooling at the sea surface in the boreal fallof2011.Corresponding to the characteristics of the SST anomalies,the anomalous SL and thermocline depth show sim ilar variation patterns(negative–positive–negative)over the central to eastern equatorial Pacific(Figs.1b and e).Meanwhile,the combined data presented in Figs.1c and d,which depict the easterly and southerly w ind anomalies,respectively,demonstrate a predom inance of the anomalous southeasterly w inds over the whole of the equatorial region.In addition,the depth of the thermocline(Fig.1e),represented by the 20◦C isotherm depth,and the SST(Fig.1a),are highly correlated,w ith a cold SST associated w ith a shallow thermocline,and vice versa.Moreover,from February to May 2011,the positive oceanic heat anomalies in the equatorial western Pacific ex-cite a downwelling oceanic Kelvin wave,which are depicted clearly by the thermocline depth anomalies(Fig.1e).Associated w ith the eastward propagating Kelvin wave,a pronounced warm ing process exists in the equatorial centraleastern Pacific during early–m id 2011(Fig.1a).However, after the Kelvin wave successfully reaches the eastern boundary of the tropical Pacific,the warm ing processdoes notcontinue afterward and is replaced by a cooling process in the whole equatorial Pacific.
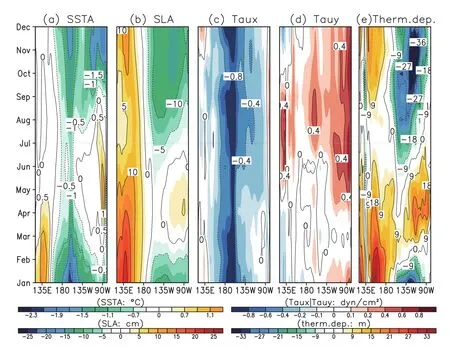
Fig.1.Temporal evolutions of interannualanomalies along the equatorial Pacific(averaged between 2◦S and 2◦N)in 2011 for(a)SST,(b)SL,(c)Taux,(d)Tauy,and(e)thermocline depth.The contour interval is 0.5◦C in(a),5 cm in(b),0.4 dyn cm-2in(c)and(d),and 9 m in(e).
Figure 2 displays the horizontaldistributions of the interannual SST anomalies over the equatorial Pacific region in 2011.The vigorous period of the 2010 La Ni˜na persists to January 2011,so the negative SST anomalies prevail extensively in the tropical Pacific,w ith a m inimum of less than -2◦C along the equator between 150◦and 170◦W(Fig.2a). From March to June,the region of negative SST anomalies shrinks gradually in the equatorialeastern Pacific,while a small-scale warm SST signal appearing in March gradually expands its area and increases its strength during the next three months(Figs.2b–e).As a result,neutral SST conditions emerge in the eastern equatorial Pacific in m id-2011.During this period,negative SST anomalies persist over off-equatorial regions,being most pronounced in the tropical South Pacific.Thereafter,the domain of positive SST anomalies gradually dim inishes and is displaced by negative ones.In particular,the negative SST anomalies reappear in the equatorial central Pacific in August(Fig.2g),and this cooling condition tends to persistand strengthen in the follow ing months(Fig.2h),leading to a“double dip”La Ni˜na event.The condition shift of the SST anomalies(i.e., negative–positive–negative)in the central-eastern Pacific is the most direct response to this kind of continuous La Ni˜na event.
In contrast to the variations of temperature at the surface layer,those in the subsurface layers are clearer.Figure 3 presents the horizontal distributions of interannual temperature anomalies at the thermocline depth,associated w ith the current anomalies.In January,the cold and warm water at the subsurface layers over the tropical Pacific nearly separate at 160◦W.The cold subsurface water is located in the eastern tropical Pacific,while the warm subsurface water is located in the western tropical Pacific(Fig.3a).The positive subsurface temperature anomalies,which previously accumulated atsubsurface depthsin the tropicalwestern Pacific (Fig.3a),startto propagate along the equator toward the eastern basin in February and March(Fig.3b).Simultaneously, pronounced negative anomalies persist in the subsurface layers of the off-equatorial regions,and warm water occupies almost the entire equatorial Pacific.Note that the cold water appears unexpectedly in 145◦–155◦W and 2◦N–2◦S and interrupts the eastern propagation of the warm water along the equator in April(Fig.3c).Then,the region of warm water shrinks gradually in the eastern equatorial Pacifi c and the area of equatorial cold water expands gradually in the nextfew months(Figs.3d–h).Finally,the cold water is seen to totally occupy the tropicaleastern Pacific again(Figs.3d and h).The pattern of the subsurface temperature anomalies in October is similar to that in January,only w ith a weakeramplitude.Obviously,the temperature anomalies at the thermocline depth(Fig.3)can reflect the evolution of the second cooling eventbetter than the SST anomalies(Fig.2).For the subsurface current field,a pathway originating from the tropical South Pacific can be clearly seen:the cold water carried by the southeastern currents is eventually transported to the equator(Fig.3).
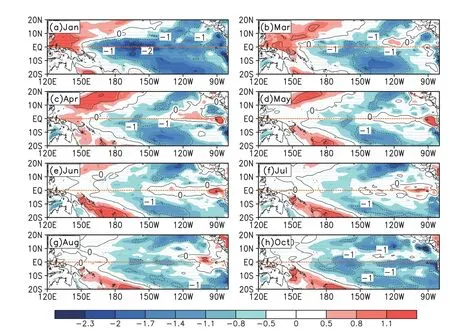
Fig.2.Horizontal distributions of the interannual SST anomalies over the equatorial Pacific region in some selected months of 2011.The contour interval is 1◦C.
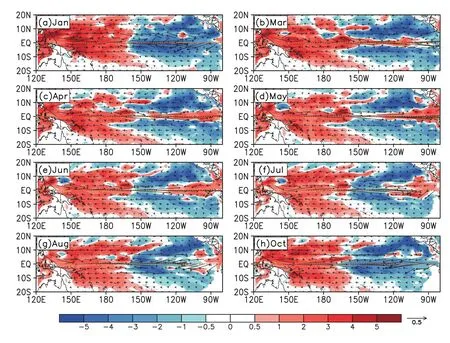
Fig.3.The same as in Fig.2,but for the temperature(shading)and ocean current(vectors)anomalies at the thermocline depth.The units forocean current is cm s-1.
Due to the strong interaction between ocean and atmosphere over the tropical Pacific,atmospheric components also play significant roles in the development of the“double dip”La Ni˜na event.Here,the NCEP reanalysis data are used to describe the atmospheric processes closely related to this event.Figure 4 shows the horizontal distributions of the SLP anomalies(shading)and w ind stress anomalies(vectors).Consistentw ith the negative SST anomalies,the center of the positive SLP anomalies exists for several months in the tropical central-eastern Pacific during the 2011 La Ni˜na event,acting to strengthen a southern meridionalw ind across the equator in early–m id 2011,especially from February to May(Figs.4b–d).The gradientof the SLP leads to an equatorward transportof cold water,and acts to produce the crossequatorialsouthern w ind.The cross-equatorialsouthern w ind can make the cold surface water in the tropical South Pacific expand northward to the equator and m ix w ith the cold surface water in the tropical North Pacifi c,off-equator.At the same time,the southeasterly w ind can cause the stratification variation of the thermocline to furtherspread the cold subsurface water to the equator from the off-equatorial regions.
During the decaying phase of the 2011/12 La Ni˜na,the region of negative SST anomalies gradually shrinks in the equatorialeastern Pacific,but these cooling processes do not persistand develop,perhaps because the off-equatorial cold anomalies(i.e.,South and North Pacific)are too weak to provide enough cold water,and the meridionalw inds also cannot supportan equatorward current in 2012(fi gures notshown). Finally,the SSTA does not return to the La Ni˜na state,as happened during 2011.
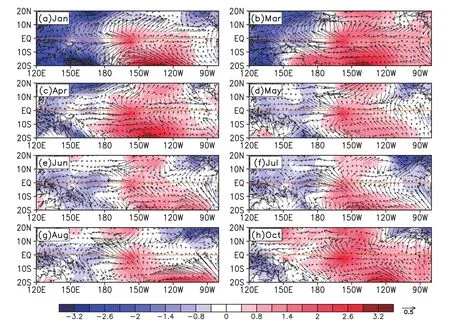
Fig.4.The same as in Fig.2,but for the sea levelpressure anomalies(shading)and the w ind stress anomalies (vectors).
Figure 5 shows the vertical distribution of the interannual temperature anomalies in the upper oceans(i.e.,from the surface to 300 m)over the equatorial region.In January 2011,positive temperature anomalies can be observed at the surface in the tropical western Pacific,while negative temperature anomalies are located in the tropical central-eastern Pacific regions at the surface layer.However,positive temperature anomalies and negative temperature anomalies exist in almostequalmeasure in the subsurface layers,w ith a sharp temperature frontalong 160◦W.Meanwhile,the thermocline over the equatorial western Pacific is relatively deeper than thatin the equatorialeastern Pacific(Fig.5a).Thereafter,the positive subsurface temperature anomalies,which had previously accumulated at subsurface depths over the tropical western Pacific,start to propagate toward the eastern basin along the equator,acting to dim inish the negative temperature anomalies there,reverse the sign of SST anomalies,and initiate warm conditions(Fig.5b).In April,the negative temperature anomalies in the equatorial central-eastern Pacific almost totally disappear except for a small surface region between the dateline and 140◦W,and the whole surface equatorial Pacific is almost completely occupied by neutralwarm SST conditions(Fig.5c).In May,a striking feature is evident in the form of a cold water mass unpredictably appearing and persisting at the thermocline depth between 140◦and 150◦W,when the warm wateroccupies almost the entire equatorial Pacific both at the surface and in the subsurface layers(Fig.5d).In the follow ing months,the range of this cold water mass gradually expands and eventually reoccupies the whole equatorialcentral-eastern Pacific(Figs.5e–h). Based on these analysis results,we can conclude that this incursion of cold water into the equatorial region took place at the thermocline depth,and the incursion process was the key mechanism preventing the developmentof a warm eventand causing a second-year cooling during the 2010–12 La Ni˜na event.However,it is still difficult to distinguish whether the source of the cold water was from the south or the north,as wellas whatkind of physicalprocess was able to trigger the incursion of cold water.These questions are furtherexam ined in the follow ing section.
4.The incursion process from the offequatorial subsurface water into the equatorial region
The incursion process is clearly displayed in Figs.6a–d by show ing the horizontal distributions of the interannual temperature anomalies at the thermocline depth in a specifically smaller region(10◦S–10◦N,165◦W–120◦W)and a shorter period(from March to June).In March,the negative subsurface anomalies still prevailover the off-equatorial region,while the equatorial Pacific is occupied by warm water in the subsurface layers(Fig.6a).Note that the cold subsurface water,which is located in the tropical South Pacific,starts to spread northward and break into the equatorial region between 145◦and 155◦W,successfully interrupting the eastern propagation of warm water along the equator in April(Fig.6b).In May,the incursion of the cold subsurface water from the tropical South Pacific into the equatorial region strengthens,and the cold water tends to move across the equator to the north(Fig.6c).Subsequently,the crossequatorial cold subsurface water from the tropical South Pacific mixes w ith that located in the tropicalNorth Pacific,and the off-equatorial negative temperature anomalies converge over the equator(Fig.6d).Furthermore,the cold waters in the tropicalSouth and North Pacific(the two selected specific regions)are previously accumulated at the subsurface depths. Consistent w ith the surface w inds,the subsurface currents,combined w ith the persistent cold water at the subsurface depths over the tropical South Pacific,are active enough to generate a cold water pathway to the equatorial region.The area of the junction gradually expandsin the next few months and the cold water can again be seen to completely occupy the tropical eastern Pacific(Fig.3).As depicted above,the cold water in this incursion process is mostly from the offequatorial regions(i.e.,the tropical South Pacific).
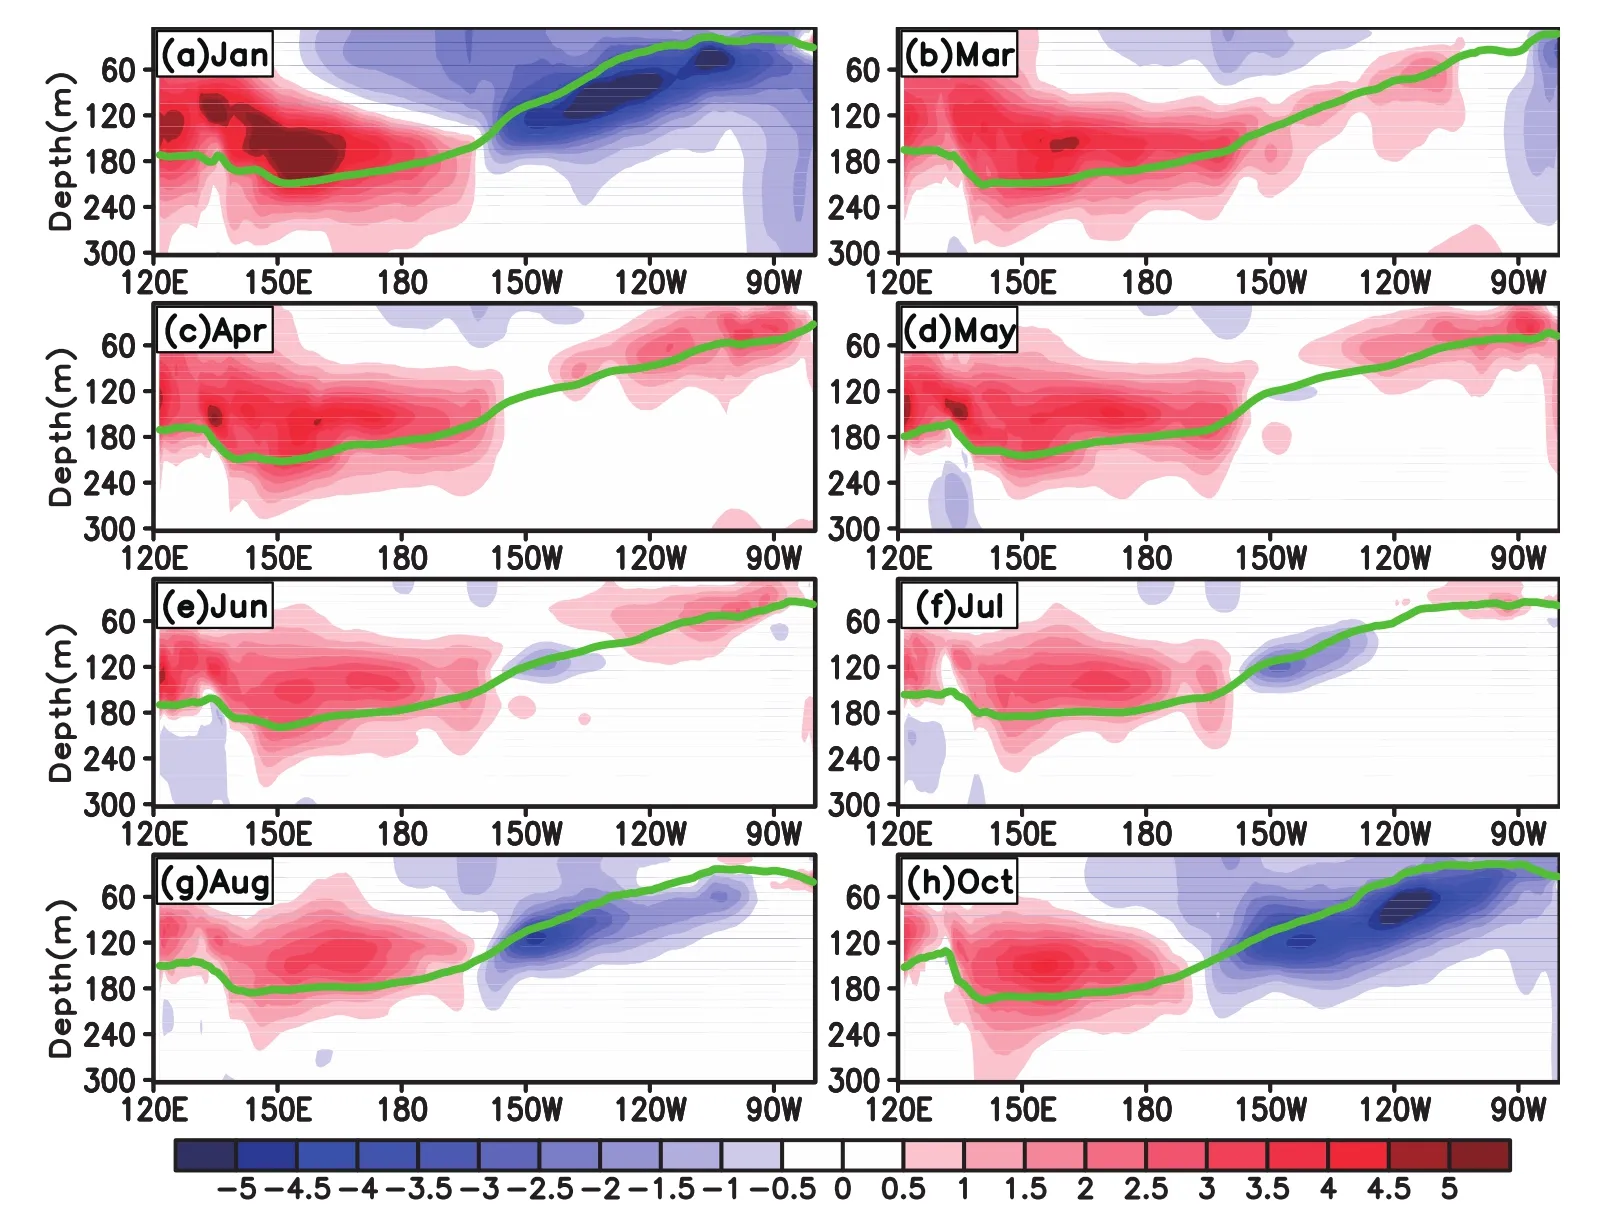
Fig.5.Vertical distributions of the interannual temperature anomalies in the upper oceans of the equatorial region(averaged between 2◦S and 2◦N)in 2011 for(a)January,(b)March,(c)April,(d)May,(e) June,(f)July,(g)August,and(h)October.The green line represents the thermocline depth diagnosed by the 20◦C isotherm.
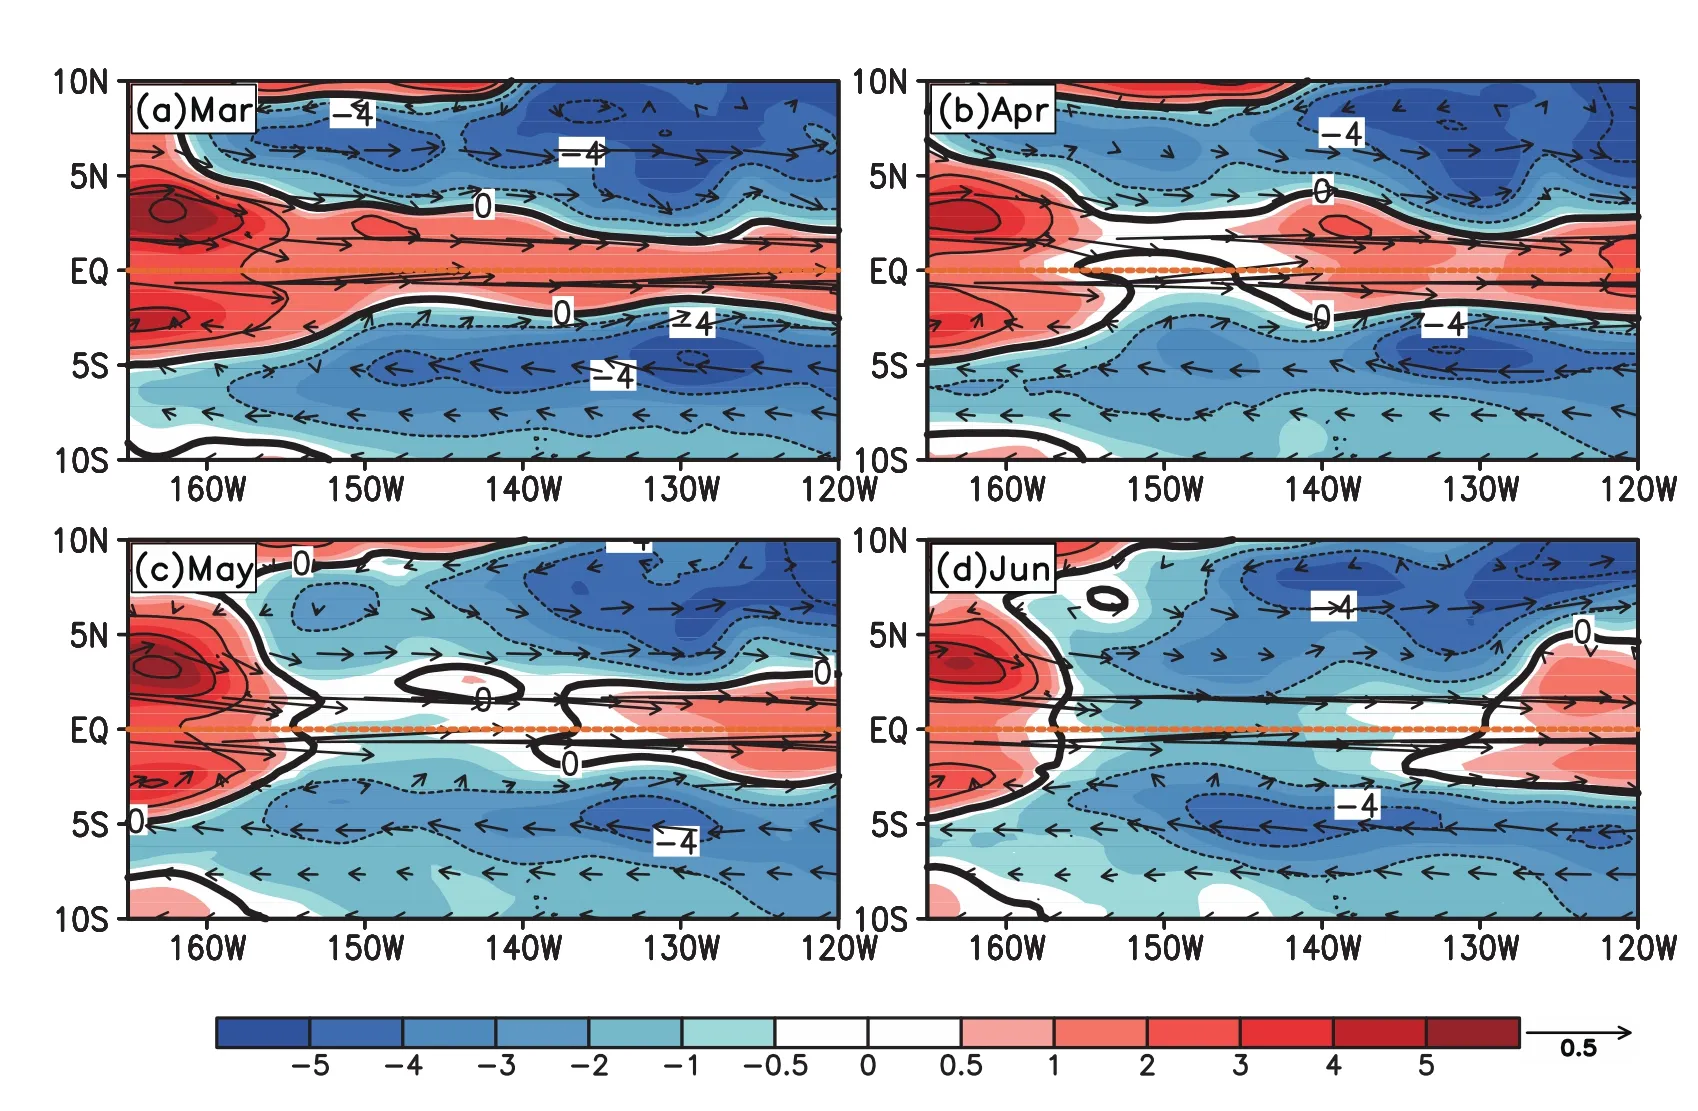
Fig.6.Horizontal distributions of the interannual temperature(shading)and ocean current(vectors)anomalies at the thermocline depth over the central to eastern equatorial Pacific(10◦S–10◦N,165◦–120◦W)in 2011 for(a)March,(b)April,(c)May,and(d)June.The contour interval is 2◦C,and the units for ocean current is cm s-1.The bold black curve represents the zero-line.
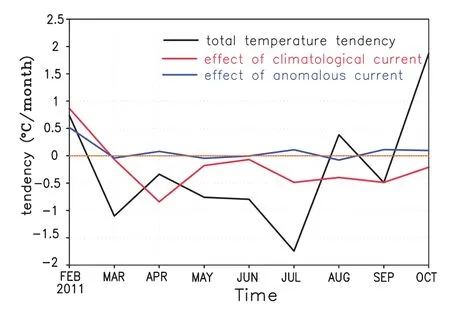
Fig.7.Temperature tendency in 2011 over the incursion region (150◦–140◦W,2◦S–0◦)at the thermocline depth.The black line represents the total temperature tendency;the red line represents the effect of climatological current w ith temperature anomalies on the temperature tendency;and the blue line represents the effectof anomalous currentw ith temperature anomalies on the temperature tendency.
Consistent w ith the demonstrations in Huang et al. (2010),the climatological currentw ith anomalous temperature plays a more important role in affecting the tropical temperature tendency than the anomalous current w ith temperature anomalies.In 2011,the climatological current associated w ith temperature anomalies provides a cooling effecton modulating the temperature tendency over the tropical South Pacific at the thermocline depth(Fig.7).Especially during the key MAM-tim ing(March–April–May tim ing)for the onsetof“double dip”La Nina,the cooling effectis obvious and significant in affecting the temperature tendency.In contrast, over the whole of2011,the anomalouscurrenthas little effect on enhancing the temperature tendency.
In order to investigate the 3D structure of the pathway along which the off-equatorial cold water moves into the equatorial region,we compute an oblique section from(2◦N, 150.5◦W)to(8◦S,141.5◦W).The vertical distributions of the interannual temperature anomalies in the upper oceans (5–300 m)from(2◦N,150.5◦W)to(8◦S,141.5◦W)are illustrated in Fig.8.It is clear that the negative temperature anomalies during the incursion process almost break into the equatorial region at the thermocline depth(Figs.8a–d), which has already been discussed based on Figs.3 and 6. In March,in the subsurface layers,there are negative temperature anomalies over the south of the equator and positive temperature anomalies over the equatorial region(Fig.8a).A northward position of the temperature zero-line in the subsurface depths occurs in April,and the positive temperature anomalies at the equator dissipate at that time(Fig.8b).In May,the negative subsurface temperature anomalies in the tropical South Pacific start to break into the equatorial region along the thermocline via horizontal advection(Fig.8c),and then mix w ith the negative subsurface temperature anomalies located in the tropicalNorth Pacific region(Fig.8d).
As described in section 3,consistent w ith the negative SST anomalies over the tropical South Pacific,the positive SLP anomalies over that area act to produce a southern meridional w ind across the equator in early–m id 2011.As the interannual variations of the upper ocean over the tropical Pacific are controlled by the surface w ind(e.g.,Wang and M cPhaden,2000),a potential trigger for the activation of the incursion process of the subsurface cold water can be found in the form of the enhanced southern meridional w ind throughoutearly–mid 2011.Zhang etal.(2013)argued that interannualw ind forcing effects were important to SST evolution during 2011.Figure 9 shows the zonal–time sections for anomalous w ind stress changes during 2011 to illustrate the key factor triggering the 2011/12 La Ni˜na event. In Fig.9a,the southeasterly w ind reappears over the tropical South Pacific(100◦–110◦W)around March,and spreads to almost the entire tropical South Pacific(160◦E–80◦W)from April.Moreover,the w ind is crossing the equator(Fig.4). On the other hand,southerly anomalies exist over the tropical North Pacific(Fig.9b),which are not conducive to the invasion of the subsurface cold water from the north of the equator.All these phenomena could have contributed to the incursion process of the off-equatorial subsurface cold water having mostly arisen from the tropical South Pacific,indicating significant roles played by the w ind in activating the“double dip”La Ni˜na event.It is also worth noting that the subsurface cold water in the North Pacific is also significant. However,the surface cold water over that region is weaker than that in the South Pacific,and there are no corresponding northeasterly w inds to cause the stratification variation of the upperoceansto furtherspread the cold subsurface water from the north to the equator.
5.Discussion and conclusions

Fig.8.Verticaldistributions of the interannual temperature anomalies in the upperoceans from(2◦N,150.5◦W) to(8◦S,141.5◦W)in 2011 for(a)March,(b)April,(c)May,and(d)June.The contour interval is 1◦C.The green line represents the thermocline depth diagnosed by the 20◦C isotherm.The bold black curve represents the zero-line,and the verticalorange line represents the equator.
The atmospheric and oceanic processes that could have been responsible for the onset of the La Ni˜na event of 2011 have been investigated,and an incursion process of subsurface cold water from off-equatorial regions into the equatorial region has been illustrated by GODAS 3D temperature productsand NCEP reanalysisatmospheric datasets.Furthermore,ithas been demonstrated that this incursion process of cold subsurface waterwas the key process in precipitating the“double dip”La Ni˜na.During 2010–12,a prolonged La Ni˜na eventarose in the tropicalPacific,w ith a second cooling atthe sea surface follow ing an initialcooling in the fallof2010.After the moderate La Ni˜na event in 2010,positive subsurface anomalies,which had previously accumulated at subsurface depths over the tropicalwestern Pacific,started to propagate along the equator toward the eastern basin,acting to reverse the sign of the SST anomalies there and initiate warm conditions.Then,in m id-2011,near normal SST conditions were present in the equatorial eastern Pacific.However,throughoutearly 2011,obviously negative anomalies persisted at the surface and at subsurface depths in off-equatorial regions, being most pronounced in the tropical South Pacific.The negative SST anomalies in the tropical South Pacific acted to strengthen a southern meridional w ind across the equator.The subsurface negative temperature anomalies in the tropical South Pacific then spread northward and broke into the equatorial region at the thermocline depth.This incursion process ofoff-equatorialsubsurface cold watersuccessfully interrupted the eastern propagation of the warm water along the equator,and was strengthened as a resultof the offequatorial effects,mostly in the tropical South Pacific.The cold SST anomalies then reappeared in the central basin in summer 2011,and acted to trigger local coupled air–sea interactions producing atmospheric–oceanic anomalies thatdeveloped and evolved w ith the second cooling in the fall of 2011.
The evolution of the 2011“double dip”La Ni˜na eventdescribed in this study is unprecedented,and depended on the obvious negative temperature anomalies thatpersisted at the surface and at subsurface depths over off-equatorial regions, as wellas the triggering mechanism of the atmosphere.During the decaying phase of the 2010 La Ni˜na event,the surface and subsurface cold water persisted over subtropical regions,and the subsurface cold water maintained a stronger negative value and retreated slower than that at the surface (Feng etal.,2015).Moreover,different from the mechanism of subtropical–tropical teleconnection,the off-equator cold anomaly in early–m id 2011 may nothave been conducive to the equatorial recharge process,and as a result could have favored the persistence of a cold ocean subsurface temperature anomaly and prevented the transition from La Ni˜na to El Ni˜no(Hu et al.,2014).Two issues have been demonstrated as key conditions responsible for the appearance of“double dip”La Ni˜na.One is subsurface cold water stillexisting in off-equatorial regions during the decaying phase of the previous La Ni˜na event.Accumulated cold water in the off-equator subsurface layers provides a precondition for the generation ofa“double dip”La Ni˜na event.The other is persistent negative SST anomalies in the tropical South Pacific acting to produce and strengthen southern w inds across the equator.The enhanced southern w ind then plays a triggering role thatencourages subsurface cold water in the South Pacific to spread northward and break into the equatorial region at the thermocline depth.
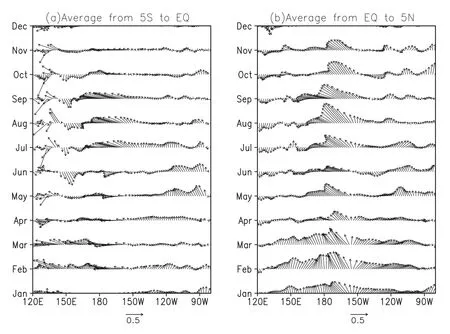
Fig.9.Zonal–time sections of the w ind stress anomalies in 2011:(a)south of the equator(averaged between 5◦S and the equator);(b)north of the equator(averaged between the equator and 5◦N).
The fi ndings of our work can also partly explain why most models,especially coupled atmosphere–ocean general circulation models,failed to predict the“double dip”La Ni˜na event that started from early–mid 2011.The failure possibly resulted from the initialization in such models.In this paper,we indicate that the persistent southeasterly w inds and prescribed subsurface cold conditions w ith an equatorward incursion would have been the key factors for predicting the 2011/12 La Ni˜na.However,for most ENSO models,their initialization methods are based on“ocean-only”assim ilation schemes(i.e.,only oceanic observations are assim ilated into the model,and the initial atmospheric states are keptunchanged).Moreover,due to the lim itations of the quality and quantity of ocean currentobservations,it is very hard to assimilate the observed current directly(Zheng and Zhu,2010a).Thus,providing more accurate atmospheric and oceanic subsurface information in the initial conditions ofmodels based on more advanced coupled data assim ilation methods(e.g.,Zheng and Zhu,2008,2010a)would clearly benefi t seasonal-to-interannual predictions of“double dip”La Ni˜na events.
However,these conclusions have only been drawn based on one“double dip”La Ni˜na case.There are other“double dip”La Ni˜na cases that have happened over the tropical Pacific(e.g.,in 2008/09 and 2000/01),and so the similarities and differences among these events need to be analyzed to better describe the nature of these strikingly different ENSO evolutions associated w ith various physical processes w ithin the Pacific climate system(Hu etal.,2014).For instance—as exemplified by the fact thata sim ilar incursion of subsurface cold water from the North Pacific happened in 2008,while there was no obvious incursion process from the off-equatorial regions in 2000—whetherornot the persistent subsurface cold watercan break into the equatorial region can differ from one case to the next.Furthermore,the differences in the location and orientation of the incursion process vary and depend on the atmospheric surface conditions(i.e.,easterly and equatorward w inds).
Moreover,due to the lack of 3D oceanic data in the past, modeling studies are also needed to validate the roles played by the off-equatorialsurface and subsurface anomalies in activating“double dip”La Ni˜na events over the tropical Pacific.For example,approximately 15“double dip”La Ni˜na cases could be simulated by a long-term(i.e.,500 years) pre-industrial control run in a fully coupled atmosphere–ocean model(Zheng,2014),which could help analyze the key mechanisms favoring the occurrence of“double dip”La Ni˜na events through providing more than 10 samples of the second cooling case.
Acknow ledgements.We thank the two anonymous reviewers for their valuable comments.This work was supported by the National Program for Supportof Top-notch Young Professionals,the National Basic Research Program of China(Grant No. 2012CB955202),the Chinese Academy Sciences’Project“Western Pacific Ocean System:Structure,Dynam ics and Consequences”(WPOS;Grant No.XDA10010405),and the National Natural Science Foundation of China(GrantNo.41176014).
REFERENCES
A lexander,M.,and J.Scott,2002:The influence of ENSO on airsea interaction in the Atlantic.Geophys.Res.Lett.,29(14), 1701,46-1–46-4,doi:10.1029/2001GL014347.
Barnston,A.G.,M.K.Tippett,M.L.L’Heureux,S.Li,and D.G. DeWitt,2012:Skill of real-time seasonal ENSO model predictions during 2002–11,is our capability increasing?Bull. Amer.Meteor.Soc.,93,631–651,doi:10.1175/BAMS-D-11-00111.1.
Behringer,D.,and Y.Xue,2004:Evaluation of the global ocean data assim ilation system at NCEP:The Pacific Ocean. Preprints,Eighth Symposium on Integrated Observing and Assimilation Systems for Atmosphere,Oceans,and Land Surface,Washington State Convention and Trade Center,Seattle, Washington,Amer.Meteor.Soc.
Feng,L.,R.-H.Zhang,Z.Wang,and X.Chen,2015:Processes leading to the second-year cooling of the 2010–12 La Ni˜na event,diagnosed using GODAS.Adv.Atmos.Sci.,doi: 10.1007/s00376-014-4012-8.
Hu,Z.-Z.,A.Kumar,Y.Xue,and B.Jha,2014:Why were some La Ni˜nas followed by another La Ni˜na?Climate Dyn.,42, 1029–1042,doi:10.1007/s00382-013-1917-3.
Huang,B.,Y.Xue,X.Zhang,A.Kumar,and M.J.M cPhaden, 2010:The NCEP GODAS ocean analysis of the tropical Pacific mixed layer heatbudgeton seasonal to interannual time scales.J.Climate,23,4901–4925.
Huang,R.H.,and Y.F.Wu,1989:The influence of ENSO on the summer climate change in China and its mechanisms.Adv. Atmos.Sci.,6(1),21–32,doi:10.1007/BF02656915.
Ji,M.,A.Leetmaa,and V.E.Kousky,1996:Coupled model forecasts of ENSO during the 1980 and 1990s atthe NationalMeteorological Center for environmental prediction.J.Climate, 9,3105–3120.
Jin,E.K.,and Coauthors,2008:Currentstatus ofENSO prediction skill in coupled ocean–atmosphere models.Climate Dyn.,31, 647–664,doi:10.1007/s00382-008-0397-3.
Kao,H.-Y.,and J.-Y.Yu.2009:Contrasting eastern-Pacific and centralPacific types of ElNi˜no.J.Climate,22,615–632,doi: 10.1175/2008JCLI2309.1.
Kanam itsu,M.,W.Ebisuzaki,J.Woollen,S.-K.Yang,J.J.Hnilo, M.Fiorino,and G.L.Potter,2002:NCEP-DOE AM IP-IIReanalysis(R-2).Bull.Amer.Meteor.Soc.,83,1631–1643,doi: 10.1175/BAMS-83-11-1631.
K leeman,R.,and A.M.Moore,1999:A new method for determining the reliability of dynamical ENSO predictions.Mon. Wea.Rev.,127,694–705.
Latif,M.,and Coauthors,1998:A review of the predictability and prediction of ENSO.J.Geophys.Res.,103(C7),143 75–14 393.
Lee,T.,and M.J.M cPhaden,2010:Increasing intensity of El Ni˜no in the central-equatorialPacific.Geophys.Res.Lett.,37, L14603,doi:10.1029/2010GL044007.
M cPhaden,M.J.,S.E.Zebiak,and M.H.Glantz,2006:ENSO as an integrating concept in earth science.Science,314,1740–1745.
M cPhaden,M.J.,and X.B.Zhang,2009:Asymmetry in zonal phase propagation of ENSO sea surface temperature anomalies.Geophys.Res.Lett.,36,L13703,doi:10.1029/2009GL 038774.
McPhaden,M.J.,T.Lee,and D.M cClurg,2011:El Ni˜no and its relationship to changing background conditions in the tropical Pacific Ocean.Geophys.Res.Lett.,38,L15709,doi:10.1029/ 2011GL048275.
Neelin,J.D.,D.S.Battisti,A.C.Hirst,F.-F.Jin,Y.Wakata,T. Yamagata,and S.E.Zebiak,1998:ENSO theory.J.Geophys. Res.,103(C7),14 262–14 290.
Philippon,N.,M.Rouault,Y.Richard,and A.Favre,2012:The influence of ENSO on w inter rainfall in South Africa.Int.J. Climatol.,32,2333–2347,doi:10.1002/joc.3403.
Toniazzo,T.,and A.A.Scaife,2006:The influence of ENSO on w inter North Atlantic climate.Geophys.Res.Lett.,33, L24704,doi:10.1029/2006GL027881.
Vimont,D.,J.M.Wallace,and D.S.Battisti,2001:Footprinting: A seasonalconnection between the mid-latitudes and tropics. Geophys.Res.Lett.,28,3923–3926.
Wang,C.,and J.Picaut,2004:Understanding ENSO physics—A review.Earth’s Climate:The Ocean-Atmosphere Interaction,C.Wang,S.-P.Xie,and J.Carton,American GeophysicalUnion,Washington,D.C.,21–48.
Wang,C.,C.Deser,J.-Y.Yu,P.DiNezio,and A.Clement,2012: El Ni˜no and Southern Oscillation(ENSO):A review.Coral Reefs of the Eastern Pacific,P.W.Glynn,Spring,3–19.
Wang,L.,and H.-J.Yang,2014:The role of atmospheric teleconnection in the subtropical thermal forcing on the equatorial Pacific.Adv.Atmos.Sci.,31(4),985–994,doi: 10.1007/s00376-013-3173-1.
Wang,W.,and M.J.M cPhaden,2000:The surface-layer heatbalance in the equatorialPacific Ocean.Part II:Interannualvariability.J.Phys.Oceanogr.,30,2989–3008.
Xiang,B.Q.,B.Wang,and T.Li,2012:A new paradigm for the predom inance of standing Central Pacific Warm ing after the late 1990s.Climate Dyn.,41,327–340,doi:10.1007/s00382-012-1427-8.
Yu,J.-Y.,H.-Y.Kao,and T.Lee,2010:Subtropics-related interannualsea surface temperature variability in the equatorialcentral Pacific.J.Climate,23,2869–2884,doi:10.1175/2010 JCLI3171.1.
Zebiak,S.E.,and M.A.Cane,1987:A model El Ni˜no/Southern oscillation.Mon.Wea.Rev.,115,2262–2278.
Zhang,R.-H.,S.E.Zebiak,R.K leeman,and N.Keenlyside, 2003:A new intermediate coupled model for El Ni˜no simulation and prediction.Geophys.Res.Lett.,30,2012,doi: 10.1029/2003GL018010.
Zhang,R.-H.,F.Zheng,J.Zhu,and Z.G.Wang,2013:A successful real-time forecastof the 2010–11 La Ni˜na event.Scientific Reports,3,1108;doi:10.1038/srep01108.
Zheng,F.,2014:Variability simulated by a coupled general circulation model:ECHAM 5/MPI-OM.Atmos.Oceanic Sci.Lett., 7,471–475,doi:10.3878/j.issn.1674-2834.14.0014.
Zheng,F.,and J.Zhu,2008:Balanced multivariate model errors of an intermediate coupled model for ensemble Kalman fi lter data assimilation.J.Geophys.Res.,113,C07002,doi: 10.1029/2007JC004621.
Zheng,F.,and J.Zhu,2010a:Coupled assim ilation for an intermediated coupled ENSO prediction model.Ocean Dyn.,60, 1061–1073,doi:10.1007/s10236-010-0307-1.
Zheng,F.,and J.Zhu,2010b:Spring predictability barrier of ENSO events from the perspective of an ensemble prediction system.Global Planet Change,72,108–117,doi:10.1016/ j.gloplacha.2010.01.021.
Zheng,F.,J.Zhu,R.-H.Zhang,and G.-Q.Zhou,2006a:Ensemble hindcasts of SST anomalies in the tropicalPacific using an intermediate coupled model.Geophys.Res.Lett.,33,L19604,doi:10.1029/2006GL026994.
Zheng,F.,J.Zhu,R.-H.Zhang,and G.-Q.Zhou,2006b:Improved ENSO forecasts by assim ilating sea surface temperature observations into an intermediate coupled model.Adv.Atmos. Sci.,23(4),615–624,doi:10.1007/s00376-006-0615-z.
Zheng,F.,J.Zhu,and R.-H.Zhang,2007:The impactof altimetry data on ENSO ensemble initializations and predictions.Geophys.Res.Lett.,34,L13611,doi:10.1029/2007GL030451.
Zheng,F.,J.Zhu,H.Wang,and R.-H.Zhang,2009:Ensemble hindcasts of ENSO events over the past 120 years using a large numberofensembles.Adv.Atmos.Sci.,26(2),359–372, doi:10.1007/s00376-009-0359-7.
:Zheng,F.,L.S.Feng,and J.Zhu,2015:An incursion of off-equatorial subsurface cold water and its role in triggering the“double dip”La Ni˜na eventof2011.Adv.Atmos.Sci.,32(6),731–742,
10.1007/s00376-014-4080-9.
(Received 15 April2014;revised 19 October2014;accepted 22 October2014)
∗Corresponding author:ZHENG Fei
Email:zhengfei@mail.iap.ac.cn
©Institute of Atm ospheric Physics/Chinese Academ y of Sciences,and Science Press and Springer-Verlag Berlin Heidelberg 2015
杂志排行
Advances in Atmospheric Sciences的其它文章
- Analysis and Evaluation of the GlobalAerosolOpticalProperties Simulated by an Online Aerosol-coup led Non-hydrostatic Icosahedral Atmospheric M odel
- The Im pact of Surface Properties on Downward Surface Shortwave Radiation over the Tibetan Plateau
- Structures and Characteristics of the W indy Atmospheric Boundary Layer in the South China Sea Region during Cold Surges
- Influence of Positive and Negative Indian Ocean Dipoles on ENSO via the Indonesian Throughflow:Results from Sensitivity Experiments
- Asian Summer M onsoon Onset in Simulations and CM IP5 Projections Using Four Chinese Climate M odels
- A Diagnostic Analysis on the Effectof the Residual Layer in Convective Boundary Layer Development near M ongolia Using 20th Century Reanalysis Data
