Structures and Characteristics of the W indy Atmospheric Boundary Layer in the South China Sea Region during Cold Surges
2015-04-20CHENGXueLingHUANGJianWULinandZENGQingCun
CHENG Xue-Ling,HUANG Jian,WU Lin,and ZENG Qing-Cun
1State Key Laboratory of Atmospheric Boundary Layer Physics and Atmospheric Chemistry, Institute of Atmospheric Physics,Chinese Academy of Sciences,Beijing100029
2Institute of Tropical and Marine Meteorology,China Meteorological Administration,Guangzhou510080
3Institute of Atmospheric Physics,Chinese Academy of Sciences,Beijing100029
Structures and Characteristics of the W indy Atmospheric Boundary Layer in the South China Sea Region during Cold Surges
CHENG Xue-Ling∗1,HUANG Jian2,WU Lin1,and ZENG Qing-Cun3
1State Key Laboratory of Atmospheric Boundary Layer Physics and Atmospheric Chemistry, Institute of Atmospheric Physics,Chinese Academy of Sciences,Beijing100029
2Institute of Tropical and Marine Meteorology,China Meteorological Administration,Guangzhou510080
3Institute of Atmospheric Physics,Chinese Academy of Sciences,Beijing100029
An observationalanalysis of the structures and characteristics of a w indy atmospheric boundary layer during a cold air outbreak in the South China Sea region is reported in this paper.It is found that the main structures and characteristics are the same as during strong w ind episodes w ith cold air outbreaks on land.The high frequency turbulent fluctuations(period<1 m in)are nearly random and isotropic w ith weak coherency,but the gusty w ind disturbances(1 m in<period<10 m in)are anisotropic w ith rather strong coherency.However,in the w indy atmospheric boundary layeratsea,compared w ith thatover land,there are some pronounced differences:(1)the average horizontalspeed is almostindependentofheight,and the vertical velocity is positive in the lower marine atmospheric boundary layer;(2)the vertical flux of horizontal momentum is nearly independentof height in the low layer indicating the existence of a constant flux layer,unlike during strong w ind over the land surface;(3)the kinetic energy and friction velocity of turbulent fluctuations are larger than those of gusty disturbances; (4)due to the independence of horizontal speed to height,the horizontal speed itself(not its vertical gradientused over the land surface)can be used as the key parameter to parameterize the turbulentand gusty characteristics w ith high accuracy.
turbulence,w ind gust,coherentstructure,cold surge,w indy marine atmospheric boundary layer
1.Introduction
Boundary layers were fi rst investigated at the beginning of the 20th century by Prandtl(1904),and the fi rstgeophysical application of boundary layer theory belongs to Ekman (1905).Until now,there has been a theory system(which can be referred to as classical theory)on the structures and dynam ical characteristics of the atmospheric boundary layer (ABL)(Kolmogorov,1941,1962;Sutton,1953;Monin and Obukhov,1954;Lum ley and Panofsky,1964;Stull,1988; Sorbjan,1989;Kaimal and Finnigan,1994;Wyngaard, 2010);and these classical results have been w idely used in weather and climate forecasting models,such as the general circulation models of the National Center for Atmospheric Research(NCARa),Geophysical Fluid Dynam ics Laboratory(GFDLb),European Centre for Medium-Range Weather Forecasts(ECMWF)c,and the Weather Research and Forecasting Model(WRF)d,as wellas various other practicalatmospheric models.
However,these studiesare based on the condition ofweak average w ind speed.Under thatcondition,follow ing the theory,the average speedchanges w ith height as a logarithmic function,and the turbulent spectrum obeys a-2/3 power law.In fact,in the real ABL,there are many cases of cold air outbreaks(cold surges;Ding etal.,2009).Usually, in these cases,the w ind speed averaged for 10 m in,at the 10 m height above ground,is larger than 10 m s-1.Moreover,values of>30 m s-1and even>40 m s-1are very often found forstorms and typhoons.It is important to study the structures and dynamical characteristics of w indy ABLs and to recognize their differences from classical theoreticalresults.
In the land ABL,many observationshave long been made during strong w ind episodes,and by analyzing these valuable data ithas been possible to show many differences compared w ith weak w ind situations(Cheng et al.,2007;Zeng et al., 2007a;2007b;Zeng etal.,2010;Cheng etal.,2011;Cheng et al.,2012a,2012b,2012c).For example:(1)the power function is better than the logarithm ic function in fi tting the vertical distribution of average w ind speed,(2)w ind fluctuations are betterdivided into two types,i.e.(I)high frequency turbulent fluctuations(turbulent fluctuations,or simply“turbulence”forshort)w ith a frequency greater than 1/60 Hz(period<1 min),which is random and possesses weak coherency,and(II)gusty w ind disturbances(“gusts”for short) w ith a frequency between 1/60 and 1/600 Hz(period of 1–10 m in),which possesses rather regular structure and strong coherency;(3)turbulence lies in the inertial sub-range,and its spectrum obeys a-2/3 scaling law,as does the classical theory,but gusts are far from the inertial sub-range and the spectrum has a different form,even w ith a discrete maximum atsome main frequencies(usually in the range 1/120–1/240 Hz);(4)the constant flux layer does notexist,and the downward flux of momentum reaches its maximum atsome lower levelw ithin the boundary layer;(5)the downward flux of horizontal momentum contributed by gusts is as large as thatby turbulence;(6)both the turbulent kinetic energy and momentum flux are large in the lower layer,then decrease very quickly w ith height,show ing that turbulence is generated by land–air interactions near the ground surface;and(7) the maxima ofkinetic energy and momentum flux ofgusts are ata levelhigher than those of turbulence,show ing its generation is due to disturbances w ithin the ABL,but the influence of the ground surface is small.
For the marine boundary layer,current models(such as the models of the NCAR,GFDL,and WRF)and the associated literature(Andreas,1992,1998,2010;Fairall et al., 1994)are all based on the classical turbulent and boundary layer theories.In particular,is taken as a logarithm ic distribution in all these models and studies.However,in fact,the occurrence of strong w inds over the sea surface is much more frequent than over land.Therefore,the structures and characteristics of the marine boundary layer during strong w ind episodes might also be different to those during weak w ind episodes,and a logarithm ic profi le ofmightbe doubtful.There have been some observationalexperiments conducted that were specifically focused on the marine boundary layer,such as Hum idity Exchange over the Sea Program(HEXOS)and Fronts and Atlantic Storm-Track Experiment(FASTEX),the MeetpostNoordw ijk platform in the North Sea(DeCosmo,1991;Sm ith etal.,1993;Andreas and DeCosmo,1999;Andreas,2010),and Coupled Ocean-Atmosphere Response Experiment(COARE)(Zeng et al., 2002).However,apart from Zeng et al.(2002),the analyses of these data have largely been based on the classical theory of the boundary layer.Although there were 322 hours of data in the FASTEX datasets,and sometimes the w ind speedreached 22 m s-1,Andreas(1998)derived the 10 m w ind speed as 32 m s-1by the logarithmic profi le,and the bulk turbulent flux algorithm was also used.
Only Zeng et al.(2002)noticed the existence of gusts and used the drag coefficientDwhen calculating the momentum and thermal fluxes in the marine boundary layer;and in the calculation ofD,was replaced bycorrection term considering the statistical characteristics of gustiness. We have no intention of making a reanalysis of those observation data.Fortunately,we have some new data regarding the marine boundary layer during cold surges from January–May 2012 and 2013. These data were obtained during the Marine Meteorological Experiment Complex(MMEC) at Bohe,Guangdong Province,in a cooperative effort by the Institute of Tropicaland Marine Meteorology/China Meteorological Adm inistration,the Maom ing Meteorological Bureau/Guangdong Province,the Institute of Atmospheric Physics/Chinese Academy of Sciences,and China Ocean University.In this paper,we analyze these data to present the structures and characteristics of the marine ABL during the cold air outbreak,and compare them w ith those at land surface stations.
2.The MMEC and instruments
The MMEC at Bohe,Guangdong Province,comprises three sites:(1)Beishan Station,which is located on Lotus Head(a small and very narrow peninsula,like an arrow intruding into the sea)ata heightofabout10 m;(2)NearBeishan Station,there is an observation platform(21◦26′21′′N, 111◦23′44′′E)above the sea surface and 6.5 km from the shore,where the depth of the water is 16 m;(3)A 100 m meteorological tower(21◦27′3′′N,111◦22′28′′E)installed on a very small rocky island named Zhizi,which is located ata heightof10 m and 4.4 km from the shore,where the depth of the surrounding sea is 6–10 m.A map show ing the locations of the sites and also a picture of the platform are provided in Fig.1.
A setof Doppler boundary layer w ind profi lers(Sumitomo Electric Industries,Osaka,Japan)is utilized atBeishan Station to measure the w ind profi le w ithin the whole ABL. The effective observation height of this setof instruments is from 100 m to 3500 m,the vertical resolution is 100 m,and the average sampling time is 10 m in.These observations provide the large-scale background for the analysis of the finerscale observations made at the observation platform and on Zhizi Island.
There is a 25 m high tower on the observation platform w ith three sets of Gill R3-50 ultrasonic anemometers(Gill Instruments Lim ited,Hampshire,UK,measuring resolution: 0.01 m s-1;measurementaccuracy:<1%RMS(rootmean square)),which are installed at 24 m,16 m and 9 m above the tower base,and the tower base is 11 m above the sea surface.Besides,there is also a smallannex tower w ith one set of Gill R3-50 ultrasonic anemometers at 8 m above sea level.Accompanying these foursets ofultrasonic anemometers,there are foursetsof XW-TS1130 inclinometers(BeijingStarneto Technology CO.Ltd,Beijing,China,angle measuring range:±15◦;measurementaccuracy:0.1◦)for monitoring the attitudes of these anemometers.The frequency of the ultrasonic anemometers and inclinometers is 20 Hz.The instruments used for measuring other meteorological variables are supplementary(for checking the quality of the ultrasonic anemometer observations)and hence are notdescribed here.
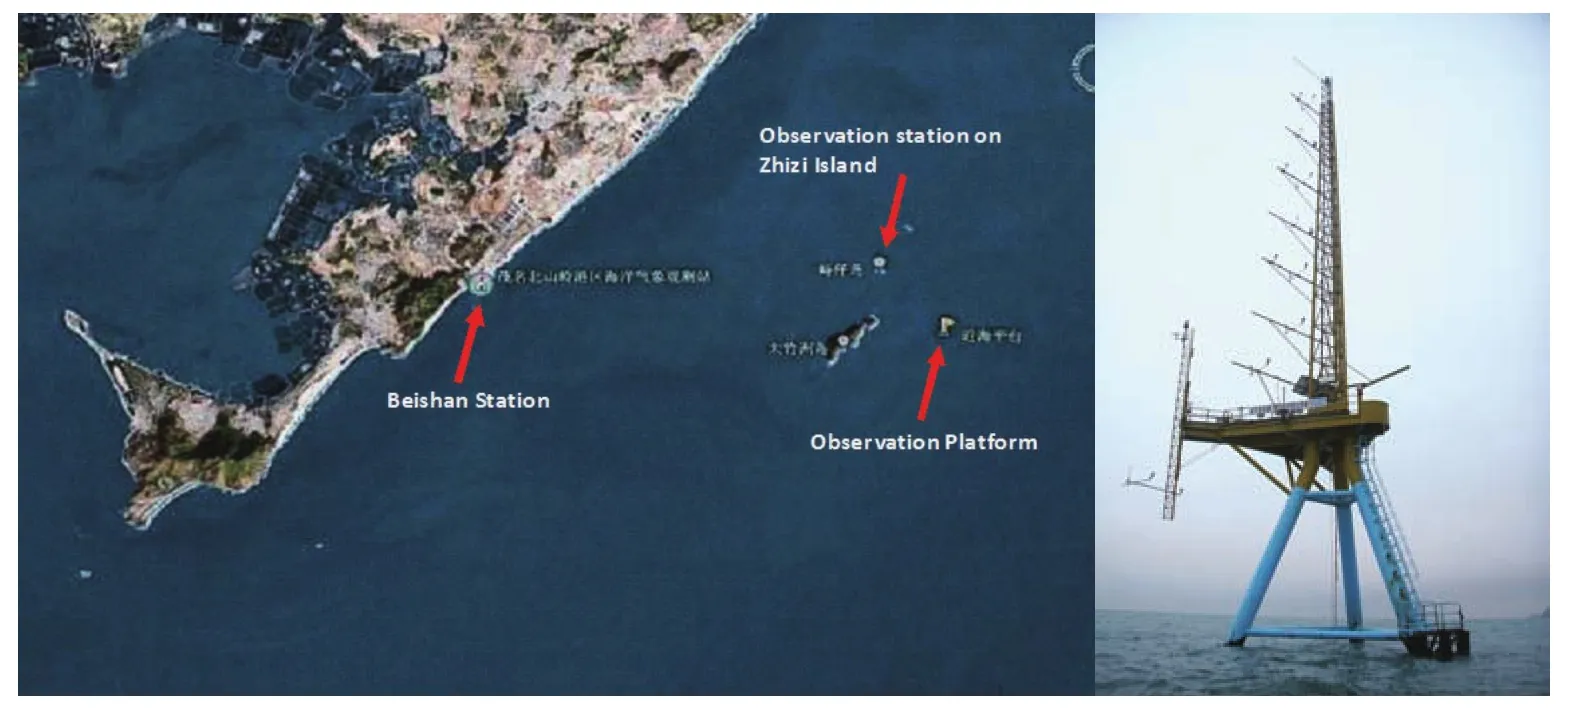
Fig.1.The marine meteorologicalscience experimentcomplex atBohe and the observation platform.
On Zhizi Island there is a meteorological tower w ith six levels of NRG-Symphonic anemometers(NRG systems, Hinsburg,USA)at 10,20,40,60,80 and 100 m above the island and three levels of anemoscopes(NRG systems,Hinsburg,USA)at10,60 and 100 m above the island.These data are used for multiple checks of the observations ofby the observation platform and its extension to higheraltitude.
In order to ensure the quality of observations,abnormal data recorded by the GillR3-50 ultrasonic anemometers were elim inated.Forexample,data were removed if the anemometers were contam inated by precipitation.A lso,any extraordinarily large valuesbeyond the reasonable range of the data,or exceeded the threshold of six times larger than the variance of the data obtained from the computation of the probability density function,were also removed.The supplementary data for replacing the elim inated data were obtained by interpolation from adjacentdata.
The inclination of an ultrasonic anemometer can cause horizontal w ind velocity fluctuation to produce a relatively large component in the verticaldirection,so the vertical fluctuations as wellas the verticalvelocity become contam inated. Usually,the inclination of an ultrasonic anemometer can be corrected by allof the three coordinate system transform ing methods of the double rotation(DR)orplanar-fi t(PF)methods(Wilczak et al.,2001).In the present study we used the inclinometer settled on the reference plane of the anemometer to obtain the synchronous signals of inclination angles, and put these anglesinto the coordinate transformation to obtain the new velocity data: whereu0,v0,w0are the original signal of velocities,u,v,ware the revised velocities,andα,βare the inclination angles around thexaxis(pitch angle)andyaxis(yaw angle)respectively.Note,thatαandβare slow ly variable or even constant.A fter a single rotation,uis defined as the horizontal w ind speed along the downw ind direction(the direction in which the horizontal velocity vector is heading),and hence the average velocity ofv,i.e.is exactly zero according to such decomposition.

3.The strong w ind cases and the methods of analysis
The data obtained from MMEC during cold airoutbreaks (cold surges)from January–May 2012 and 2013 are analyzed in detail.During the period January–May 2012 there were 289 hours when w ind velocities reached 10 m s-1at 9 m height above the tower base of the observation platform(20 m above sea level),and 103 hours when they reached 12 m s-1.The period 23–24 March 2012 was a typicalcase during which a stream of cold air quickly descended over Guangdong Province and the South China Sea region,and above sea surface the cold surge enhanced the northeastw ind obviously.There was moderate to heavy rainfallover the north of the province,and light to moderate rainfall over central and southern regions.Some cities and counties suffered strong convective weather,such as short-term thunderstorms and highly intense rainfall.At the sea surface there were northeasterly w inds at force 7 accompanied by force 8 gusts.Figure 2 shows the 850 hPa weather map at0800 LST 24 March 2012.We can see thatthe strong w ind w ith a northern componentdoesnotappearatthe top of the boundary layer(approximately 850 hPa).Figure 3 is the one-hour-averaged time–heightw ind profi le at Beishan Station.Together,Figs.2 and 3 show that the cold airoutbreak was very shallow and strong w ind was a phenomenon thatoccurred in the boundary layer. They also show that very strong w ind was presentbetween 2100 LST 23 March and 1000 LST 24 March 2012,butbelow 1000 m.In such a large-scale background,the observationsat the observation platform and on Zhizi Island show that the strong horizontal w ind speed in the low layer of the ABL appeared w ith a peak at0001 LST 24 March and lasted for almost1 day(seen in Figs.4a and b).Note that there is very good structuralconsistency between the curvesin Figs. 4a and b.

Fig.2.850 hPa weathermap at0800 LST 24 March 2012(provided by Guangdong Meteorological Bureau).

Fig.3.Time–height w ind profi les of one-hour-averagedduring 23–24 March 2012 at Beishan Station.
Here,we apply the method suggested by Zeng et al. (2010)to analyze the characteristics of the w indy marine ABL;that is,to divide the variablefinto three parts:10-m in-averagedgusty valueand turbulent valueTaking w ind velocityVVVfor example,we havewhere the subscripts“g”and“t”represent gusty w ind disturbance and turbulent fluctuation,respectively.Conventionally,VVVis decomposed asis called fluctuation(even turbulence), buthere we divideVVV′into two furtherparts,i.e.Besides,the three directionalcomponents of the vectorVVVare denoted as(u,v,w),whereuis the horizontal speed in the downw ind direction,thenand

The average time is 10 min.Here,we use the simplest method to separate turbulent fluctuation and gusty w ind disturbance.That is,the frequency of the former is larger than 1/60 Hz,and the latter is between 1/60 Hz and 1/600 Hz. A lthough the frequency dividing these into two parts m ight be slightly different,and may change from case to case for strong and weak w ind situations,it is sufficient to take the value in applications as 1/60 Hz.We focus on analyzing the characteristics of turbulence and gusts,and the relationship between them w ith average w ind(primarily the horizontal average velocityDenoting the kinetic energy,friction velocity and the coherent index asEi,ui∗andCirespectively, wherei=g,t,we have

whereAijare the amplitudes of theifluctuation of thejcomponent,andi=g(gust)and t(turbulence),andj=u,v,w. Besides,The largerCiis,the higher the coherency and greater the regularity of the structure.
4.The structures and characteristics of the w indy marine ABL during cold surges
4.1.Average wind
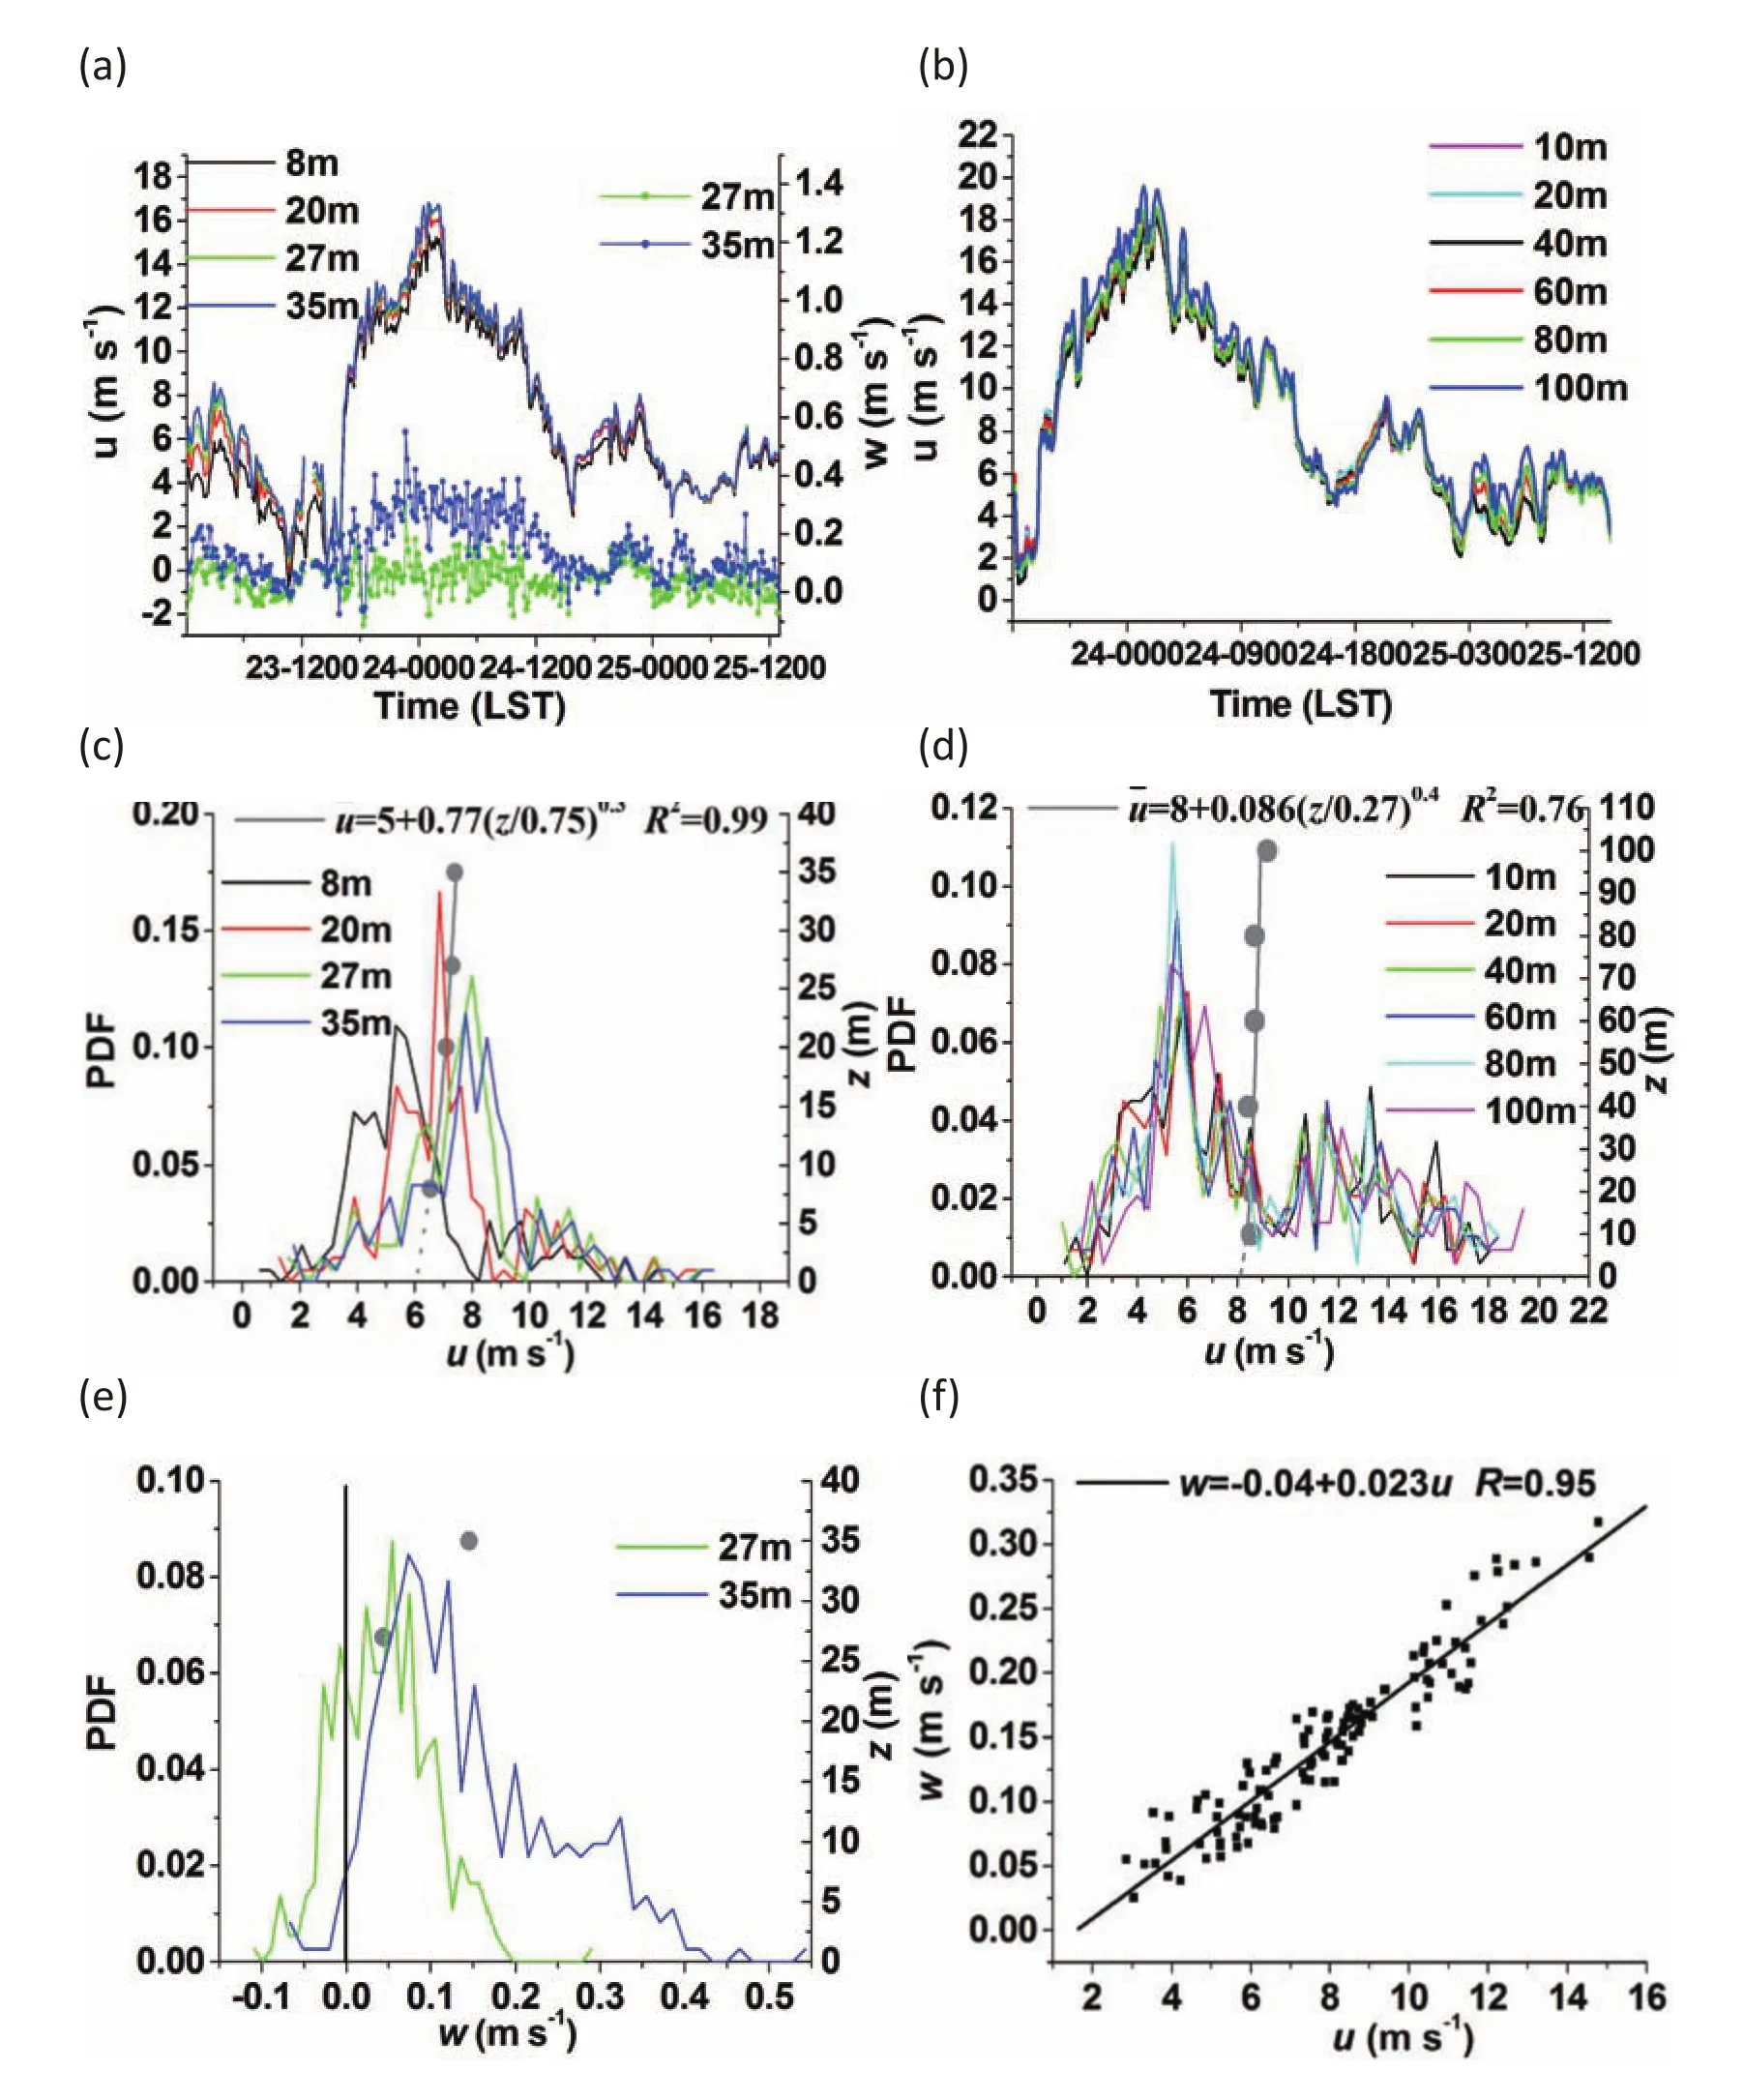
Fig.4.10-m in-averaged horizontaland verticalvelocities during 23–24 March 2012:(a)at four levels and w at two levels of the observation platform;(b)at six levels on Zhizi Island;(c)the distribution ofatevery levelof the observation platform;(d)the distribution ofu atevery levelof the tower on Zhizi Island;(e)as in (c)except for w at two levels;(f)the pairfor cold surge cases.
Figure 4a shows the 10-m in-averaged time series of the w ind speedobtained by the observation platform ultrasonic anemometers at four levels during 23–24 March 2012.Note thatduring this cold surge the w ind direction(notgiven here) was very stable.For comparison,Fig.4b shows the same information butobtained by the anemometers on Zhizi Island atsix levels.In Fig.4a the vertical velocitiesat the levels 27 m and 35 m(above the sea surface)are also shown,and they are all positive.Note thatat the low levels of 8m and 20 m are influenced by the platform;hence,the resultsare not meaningful and not presented here.Furthermore,except for in summer,unfortunately there was no ultrasonic anemometeratthe toweron Zhizi Island;hence,there is nopresented in Fig.4b.Figure 4c shows the distribution ofvalues at every levelof the observation platform during 23–24 March 2012.The points are the ensemble means of the speeds.Figure 4d is the same as Fig.4c but for Zhizi Island.These two figures show that the w ind speedswere almost the same at every level,and the difference between levels was small. Therefore,the velocitygenerally did notchange w ith height below 110 m above sea level,orat leastbelow 35 m above sea level,during the cold surge episode.However,there are still some differences between Figs.4a and b,e.g.the 1 m s-1difference ofand the slightphase difference.These may be due to the different locations of the two sets of observations. Note that the vertical profi le ofis valid for all cold surge cases in the 2012 and 2013 w inter–spring seasons(figure notshown),which is one important characteristic of the w indy marine ABL,and itshows that the logarithm ic profi le ofis notvalid in such cases.
Figure 4e shows the vertical velocityat the two levels mentioned above for the cold surge case during 23–24 March 2012,and Fig.4f shows the relationship betweenandThese figures show another important feature of the w indy marine ABL,i.e.that there is ascending atmospheric motion above the sea surface,and it can be parameterized well by one parameter,
4.2.The characteristics of gusty and turbulentenergy
Figure 5 givesan example oforiginalvelocity(u,w)measured by ultrasonic anemometers and the decompositions, (ug,wg)and(ut,wt),at the 8 m level.Figures 6 and 7 show the amplitudes of turbulent fluctuations,(At≡E1/2t), and gusty disturbances,(Ag≡E1/2g),and their components (Atu,Atv,Atw,Agu,Agv,Agw)against the average w ind speedis simplified asUin the figures).The regressions(parameterization formulas)are also given in these figures.Note that alldata obtained by MMEC for every case of whole air outbreak processes(0.5 m s-1<<16 m s-1)in January–May 2012 and 2013 were analyzed and are presented in Figs.6–10,except for Fig.8;and the regressions in Figs.6 and 7 are forall levels because theirdifferences between every levelare smalldue to the fact thatall four levels are in the lowest layer below 35 m height(above sea level)and the independence ofuto height.
Figures 6 and 7 show that:(1)the gusty w ind disturbances are anisotropic,and the amplitudeAguis larger thanAgv,and both are larger than the vertical amplitude,i.e.Agu>Agv>Agw.However,the turbulence isalmostisotropic on the horizontalplane,AtuandAtvare almost the same,and only the verticalamplitudeAtwis somewhatsmaller.(2)Becauseis almost independent of height,the parameterization formulas forAijcan be developed by using the vertically averaged w ind speed as the unique parameter,and this parameter can also be considered as the 10 m w ind speed, as commonly accepted in the literature.(3)The accuracies of these regressions are high—except that ofAgv,which is moderate—especially for turbulentparameters.
4.3.The vertical fl ux of horizontal momentum and friction velocity
Figure 4 shows thatthe velocity increased obviously from 1800 LST 23 March and thatthe strong w ind lasted until1200 LST 24 March 2012.During this period the vertical fluxes of horizontalmomentum caused by both turbulence and gusts at various levels were also obviously large(Figs.8a–d).Figure 8e presents the verticalprofi les of these fluxes during this period.
Figure 8 shows that the turbulent downward flux was larger than the gusty one,and that they were equally large only at the 35 m level.Besides,the turbulent(gusty)fluxes decreased(increased)slightly w ith height.The friction velocitiesut∗andug∗againstare shown in Figs.9a and b,and theirverticalprofi lesand distributionsatevery levelare given in Figs.9c and d.Figures 9a and b show that theug∗andut∗at all levels for all cases of cold surges can be very well expressed by parameterization formulas w ith a single parameteru.Furthermore,Figs.9c and d showug∗<ut∗at all levels, except for the 35 m levelwhereug∗≈ut∗,and thatbothug∗andut∗are independentof height(error<10%),albeitug∗definitely increases w ith heightslightly.
4.4.The coherent structure of gusty disturbances
Once we have the kinetic energy and friction velocity of turbulence and gusts,their coherent indices,CgandCt,can be easily calculated according to Eqs.(7)and(8).TheCgandCtvalues for the case in March 2012 are given in Table 1. The results indicate thatmostCgvalues are much larger thanCtduring the strong w ind period,and the gusty disturbances possess a well-organized structure.
4.5.The equivalent period of gusts
The equivalentperiodTgofgustswas introduced by Zeng et al.(2010)to approximately present the real gusty trains whose period is variable from time to time but w ithin some range.Such a defined equivalentperiod of gusts is very useful for solving the problem of aerosol transport(Cheng etal.,2012c).

Fig.5.Original velocity u(left),gusts ug(middle),and turbulence ut(right)at the 8 m levelof the platform tower at 0700 LST 24 March 2012.
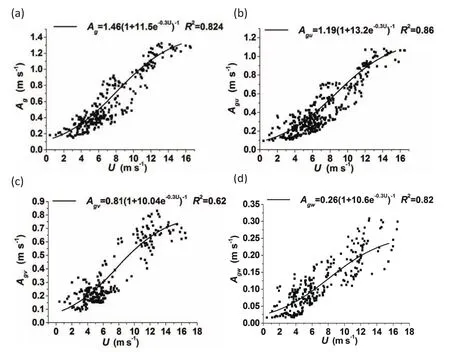
Fig.6.The amplitude of gusts and its three components against

Fig.7.As in Fig.6 except for the turbulence(a)At,(b)Atu,(c)Atv,and(d)Atw.
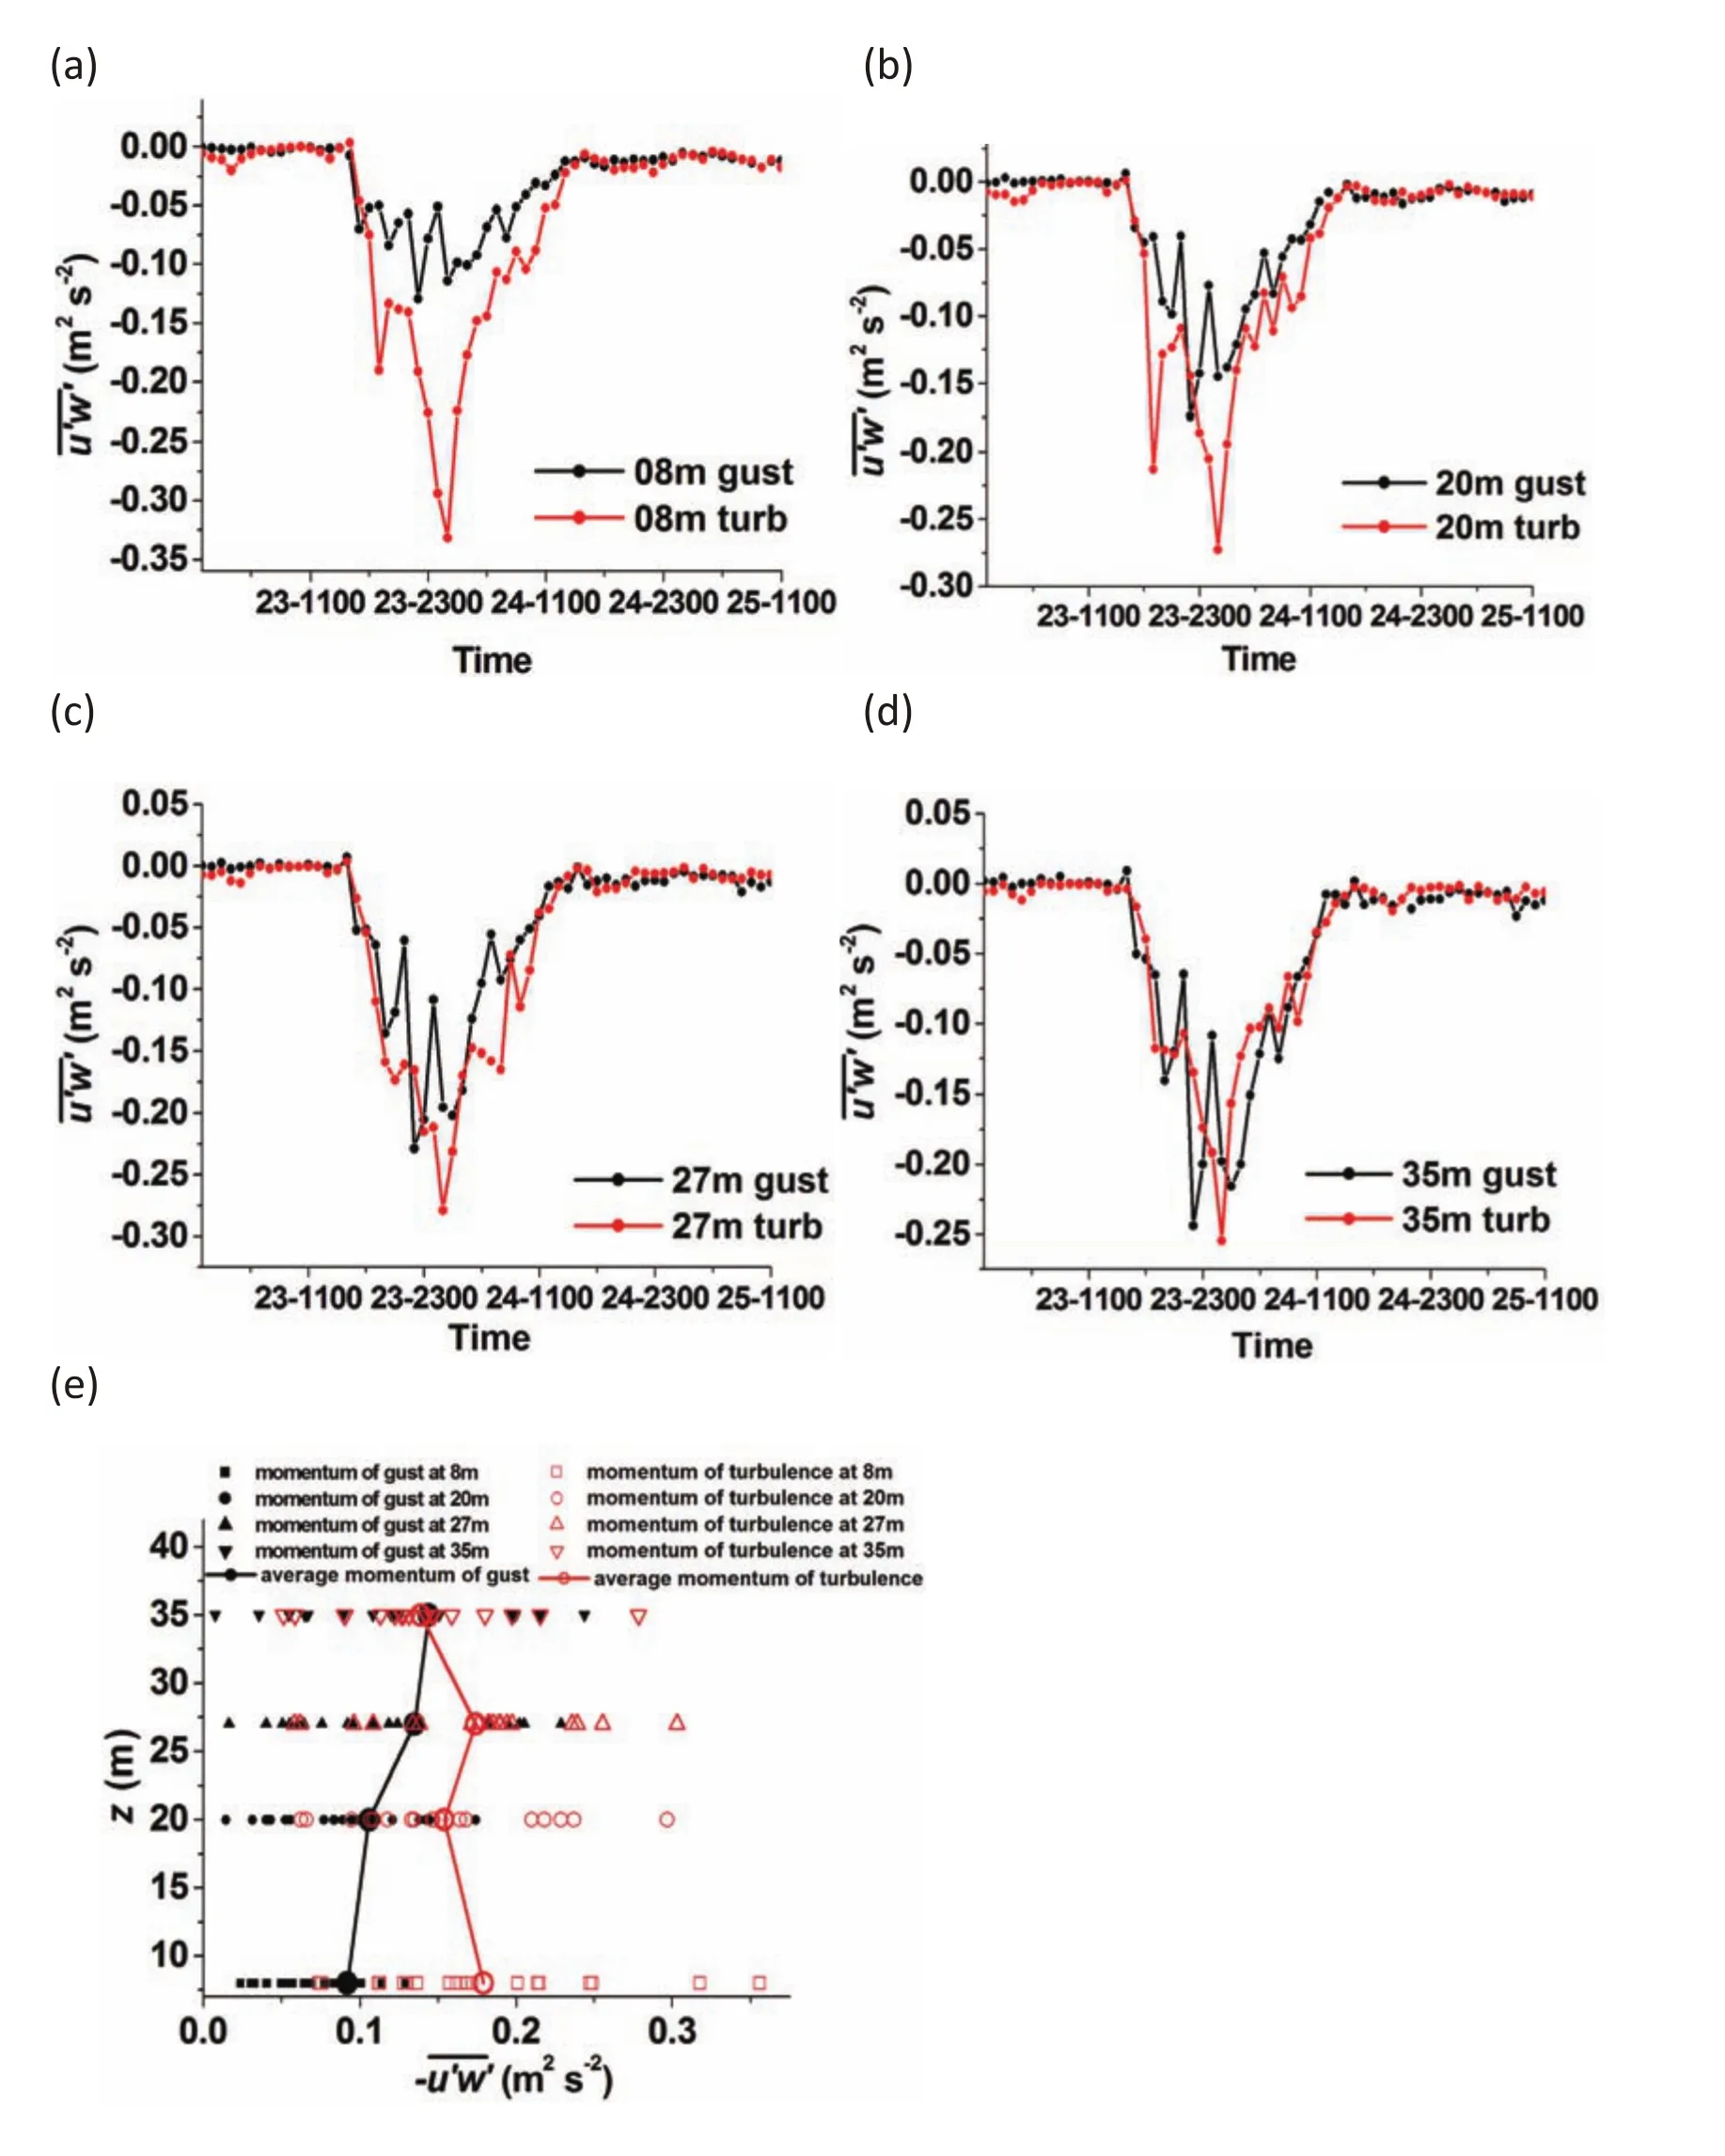
Fig.8.The vertical fluxes of momentum of turbulence(red)and gusts(black)at four levels(a–d)and their profi les(e).
During the cold surge periods in January–May 2012 and 2013,theTgcomputed from the observedugat four levels is presented in Fig.10.It can be seen thatTgis located in the domain(2 m in,6 m in),and the period is stable atstrong w ind and almost reaches the saturation value of 2.6 m inutes. Compared to the equivalentperiod of gusts over land,where theTgis located in the domain(3 min,8 min)and the saturation period seems to be about4 min(Cheng etal.,2012a), the gusts in the marine boundary layer w ith strong w ind are smaller in scale than those over land.This phenomenon,and the independence ofto height,indicate that in oceanic regions the movable interface,the air–sea interaction and thesea-waves greatly influence the characteristics of the ABL.
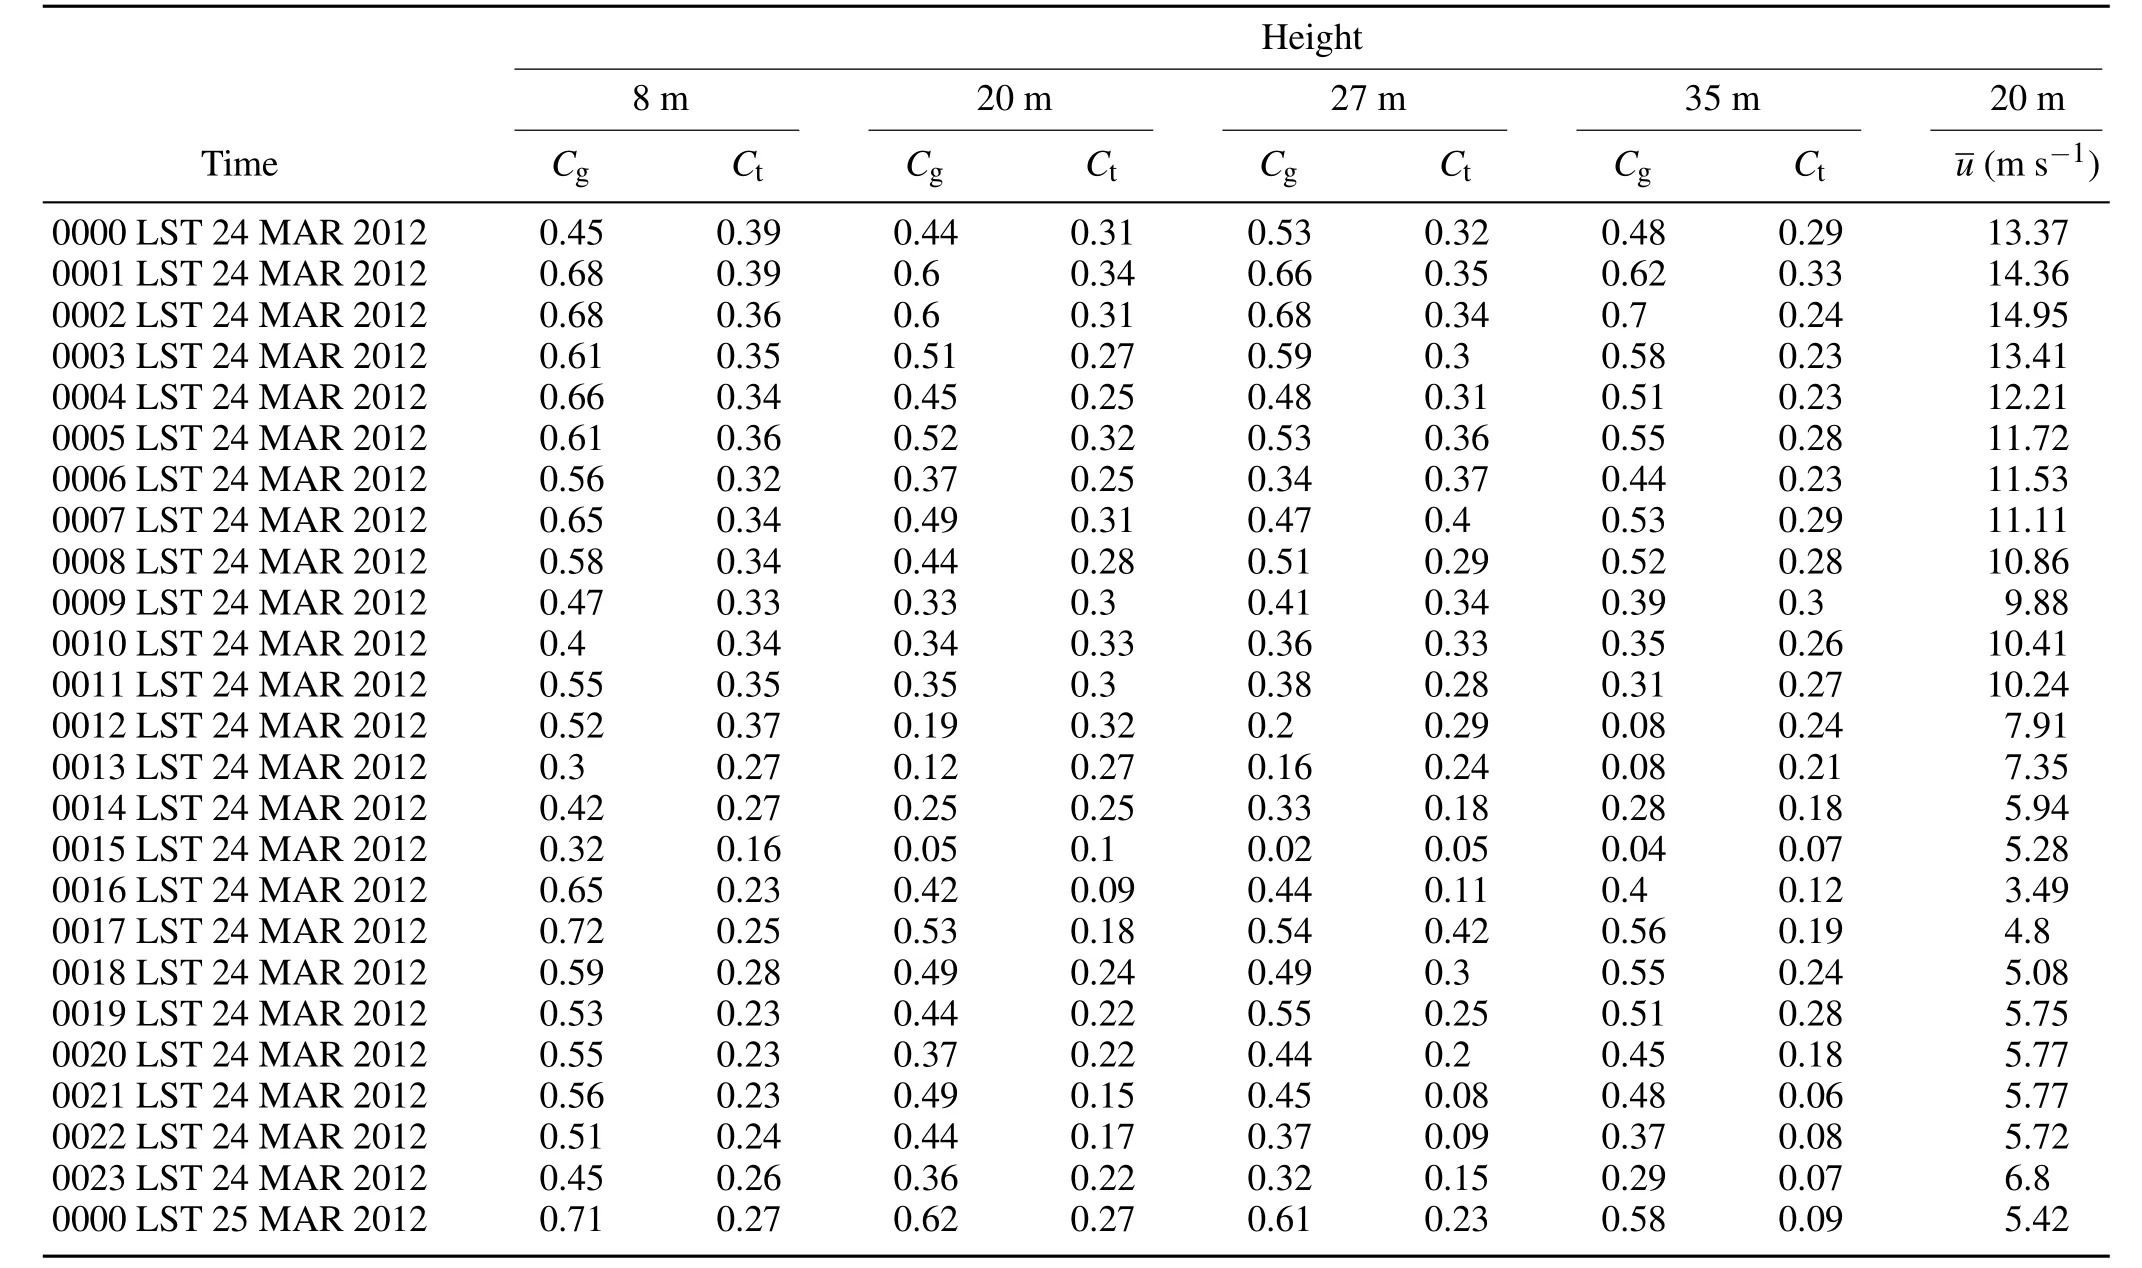
Table 1.The coherentcoefficients Cg(gusts)and Ct(turbulence)during the cold surge case in March 2012.
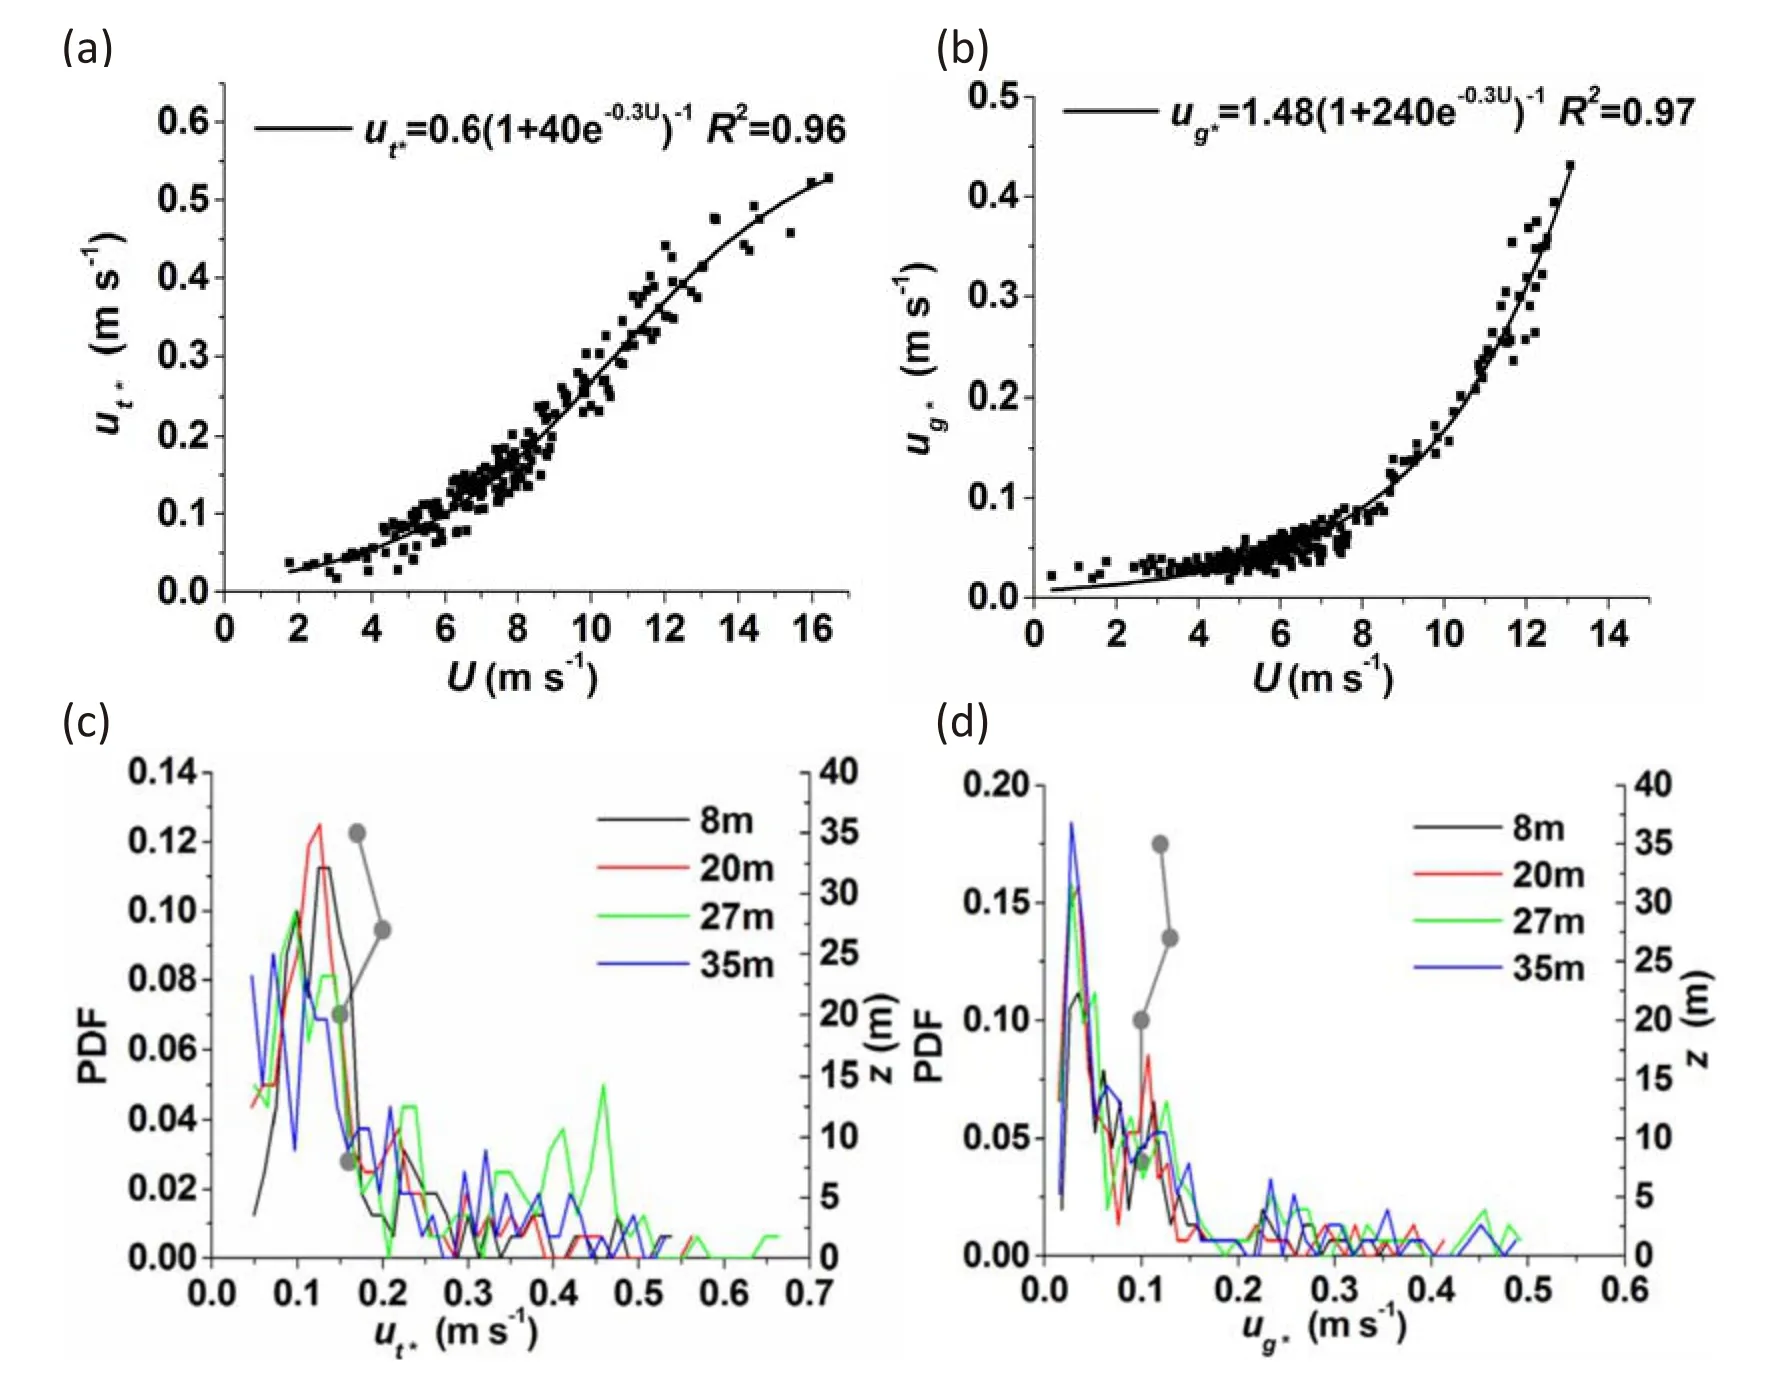
Fig.9.Friction velocity change w ith average velocity(a,b)and their profi les and distributions atevery level(c,d).

Fig.10.The change in equivalentperiod Tgw ith horizontalvelocity u.
5.Concluding rem arks
In the present reported study we analyzed the structures and characteristics of the marine ABL during strong cold surges in the South China Sea region.The results showed that most characteristics are consistent w ith the situation of strong w ind over land.For example:
(1)There are both gusty w ind disturbances and high frequency turbulent fluctuations superposed on the basic strong w ind;the turbulence is random,nearly isotropic and weakly coherent,but the gusts possess rather more regular and stronger coherency,as well as anisotropy.W ith an increase in the average velocitythe equivalent period of gusts decreases and reaches saturation.
(2)The characteristics of turbulence and gusts,such as the kinetic energy and momentum flux,can be expressed by parameterization formulas.
Meanwhile,there are some differences,such as:
(1)In the loweratmospheric layerabove the oceanic surface,the average horizontal speedis almost independent ofheight(unlike the increase w ith heightover land),and the verticalvelocity>0(unlike<0 over land).
(2)There is a constant flux layer(the vertical fluxes of horizontal momentum are almost independent of height)in both the turbulence and gusts above the oceanic surface.
(3)In oceanic regions,the parameterization formulas for the characteristics of the ABL can be presented well byrather thanover land.
The strong w inds analyzed in ourearlierstudies over land and in the presentstudy over the ocean all took place during cold air outbreaks.The common laws indicate a similar influence of the underlying surface on the atmospheric motion, and the differences are due to the different characteristics of the underlying surface.In the oceanic region the underlying surface is movable and possesses multiple temporal-and spatial-scale motions;and around this interface the air–sea interactions are strong and highly complex.Therefore,more observations and analyses are needed.
We have also carried outsim ilar work butduring the passage of typhoons.The prelim inary results show thatthe major characteristics are sim ilar to those reported in this paper,although the average w ind speed,gusts and turbulence are all very much stronger.We hope to report the results in a future paper.
Acknow ledgements.This work was supported by the National Nature Science Foundation of China(NSFC,Grant Nos.40830103 and 41375018),a National Program on Key Basic Research project (973 Program)(Grant No.2010CB951804),the plan of the State Key Laboratory of Atmospheric Boundary Layer Physics and Atmospheric Chem istry,Institute of Atmospheric Physics,Chinese Academy of Sciences(Grant No.LAPC-KF-2013-11),China Special Fund for Meteorological Research in the Public Interest(Grant No.GYHY200906008),and the program of the Chinese Academy of Sciences(Grant No.XDA10010403).We are also very grateful for the help provided by LIN L.X.(Chief Scientist of weather forecasts)and ZENG C.(Officer)at the Weather Forecast Division of Guangdong Meteorological Bureau,and ZHAO Y.J.(Senior Engineer)and LUO W.D.from the Institute of Atmospheric Physics, Chinese Academy of Sciences.
REFERENCES
Andreas,E.L.,1992:Sea spray and the turbulent air-sea heat fluxes.J.Geophys.Res.,97,11 429–11 441,doi:10.1029/ 92JC00876.
Andreas,E.L.,1998:A new sea spray generation function for w ind speeds up to 32 ms-1.J.Phys.Oceanogr.,28,2175–2184.
Andreas,E.L.,2010:Spray-Mediated enthalpy flux to the atmosphere and salt flux to the ocean in high w inds.J.Phys. Oceanogr.,40,608–619.
Andreas,E.L.,and J.DeCosmo,1999:Sea spray production and influence on air-sea heat and moisture fluxes over the open ocean.Air-Sea Exchange:Physics,Chemistry and Dynamics, G.L.Geernaert,Ed.,K luwer,327–362.
Cheng,X.L.,Q.C.Zeng,F.Hu,and Z.Peng,2007:Gustiness and coherentstructure ofstrong w ind in the atmospheric boundary layer.Climatic and Environmental Research,12(3),227–243. (in Chinese)
Cheng,X.L.,Q.C.Zeng,and F.Hu,2011:Characteristics of gusty w ind disturbances and turbulent fluctuations in w indy atmospheric boundary layer behind cold fronts.J.Geophys. Res.,116,D06101,doi:10.1029/2010JD015081.
Cheng,X.L.,Q.C.Zeng,and F.Hu,2012a:Parameterizations of some important characteristics of turbulent fluctuations and gusty w ind disturbances in the atmospheric boundary layer.J. Geophys.Res.,117,D08113,doi:10.1029/2011JD017191.
Cheng,X.L.,F.Hu,and Q.C.Zeng,2012b:Simulation of w ind gust structure in the atmospheric boundary layer w ith Lattice Boltzmann Method.Chinese Science Bulletin,57,1196–1203.
Cheng,X.L.,Q.C.Zeng,and F.Hu,2012c:Stochastic modeling the effect of w ind gust on dust entrainment during sand storm.Chinese Science Bulletin,57,3595–3602,doi:10.1007/s11434-012-5230-z.
DeCosmo,J.,1991:Air-sea exchange of momentum,heat and water vapor over whitecap sea states.Ph.D.thesis,Univ.of Wash.,Seattle,212 pp.
Ding,T.,W.-H.Qian,and Z.-W.Yan,2009:Characteristics and changes of cold surge events over China during 1960-2007. Atmos.Oceanic Sci.Lett.,2,339–344.
Ekman,V.W.,1905:On the influence of the earth’s rotation on ocean-currents.Ark.Mat.Astron.Fys.,2,1-52.
Fairall,C.W.,J.D.Kepert,and G.J.Holland,1994:The effect of sea spray on surface energy transports over the ocean.The Global Atmosphere and Ocean System,2,121–142.
Kaimal,J.C.,and J.J.Finnigan,1994:Atmospheric Boundary Layer Flows:Their Structure and Measurement.Oxford University Press,New York,289 pp.
Kolmogorov,A.N.,1941:The localstructure of turbulence in incompressible viscous fluids atvery large Reynolds numbers. Dokl.Akad.Nauk.SSSR,30,299–303.Reprinted in Proc.R. Soc.London A,434,9–13(1991).
Kolmogorov,A.N.,1962:A refinement of previous hypotheses concerning the local structure of turbulence in a viscous incompressible fluid athigh Reynolds number.J.Fluid Mech., 13,82–85.
Lum ley,J.L.,and H.A.Panofsky,1964:The Structure of Atmospheric Turbulence.Interscience,New York,239 pp.
Monin,A.S.,and A.M.Obukhov,1954:Basic laws of turbulent m ixing in the surface layer of the atmosphere.Tr.Akad.Nauk SSSR Geofiz.Inst,24,163–187.
Prandtl,L.,1904:Uber Flussigkeitsbewegung beisehrkleiner Reibung,Verhandlungen des dritten internationalen Mathematiker-Kongresses,Heidelberg,489–491,Leipzig.(English trans.,2001:On the motion of fluids w ith very little friction,in Early Developments of Modern Aerodynamics,J.A. D.Ackroyd,B.P.Axcell,A.I.Ruban,eds.,Butterworth-Heinemann,Oxford,UK,77–84.)
Smith,M.H.,P.M.Park,and I.E.Consterdine,1993:Marine aerosol concentrations and estimated fluxes over the sea. Quart.J.Roy.Meteor.Soc.,119,809–824.
Sorbjan,Z.,1989:Structure of the Atmospheric Boundary Layer. Prentice Hall,Englewood Cliffs,New Jersey,317 pp.
Stull,R.B.,1988:An Introduction to Boundary Layer Meteorology.Kluwer Academic Publishers,Norwell,Mass,738 pp.
Sutton,O.G.,1953:Micrometeorology.M cGraw-Hill,New York, 333 pp.
Wilczak,J.M.,S.P.Oncley,and S.A.Stage,2001:Sonic anemometer tiltcorrection algorithms.Bound.-Layer Meteor., 99,127–150.
Wyngaard,J.C.,2010:Turbulence in the Atmosphere.Cambridge University Press,393 pp.
Zeng,Q.C.,X.L.Cheng,and F.Hu,2007a:The mechanism of soilerosion and dustemission under the action of nonsteady strong w ind w ith descending motion and gustw ind.Climatic and Environmental Research,12(3),244–250.(in Chinese)
Zeng,Q.C.,F.Hu,and X.L.Cheng,2007b:The mechanism of dust entrainment by gustw ind.Climatic and Environmental Research,12(3),251–255.(in Chinese)
Zeng Q.-C.,X.L.Cheng,F.Hu,and Z.Peng,2010:Gustiness and coherent structure of strong w ind and their role in the dustem ission and entrainment.Adv.Atmos.Sci.,27(1),1–13, doi:10.1007/s00376-009-8207-3.
Zeng,X.,Q.Zhang,D.Johnson,and W.-K.Tao,2002:Parameterization ofw ind gustiness for the computation ofocean surface fluxes atdifferentspatial scales.Mon.Wea.Rev.,130,2125–2133.
:Cheng,X.-L.,J.Huang,L.Wu,and Q.-C.Zeng,2015:Structures and characteristics of the w indy atmospheric boundary layer in the South China Sea region during cold surges.Adv.Atmos.Sci.,32(6),772–782,
10.1007/s00376-014-4228-7.
(Received 12 April2014;revised 16 October 2014;accepted 06 November 2014)
∗Corresponding author:CHENG Xue-Ling
Email:chengxl@mail.iap.ac.cn
aNationalCenter for Atmospheric Research.Community Earth System Model.http://www2.cesm.ucar.edu.
bGeophysical Fluid Dynamics Laboratory.Earth System Model.http://www.gfdl.noaa.gov/earth-system-model.
cEuropean Centre for Medium-Range Weather Forecasts.http://www.ecmw f.int/.
dWeather Research and Forecasting.http://w rf-model.org/index.php.
©Institute of Atm ospheric Physics/Chinese Academ y of Sciences,and Science Press and Springer-Verlag Berlin Heidelberg 2015
杂志排行
Advances in Atmospheric Sciences的其它文章
- An Incursion of O ff-EquatorialSubsurface Cold Water and Its Role in Triggering the“Double Dip”La Ni˜na Event of 2011
- Analysis and Evaluation of the GlobalAerosolOpticalProperties Simulated by an Online Aerosol-coup led Non-hydrostatic Icosahedral Atmospheric M odel
- The Im pact of Surface Properties on Downward Surface Shortwave Radiation over the Tibetan Plateau
- Influence of Positive and Negative Indian Ocean Dipoles on ENSO via the Indonesian Throughflow:Results from Sensitivity Experiments
- Asian Summer M onsoon Onset in Simulations and CM IP5 Projections Using Four Chinese Climate M odels
- A Diagnostic Analysis on the Effectof the Residual Layer in Convective Boundary Layer Development near M ongolia Using 20th Century Reanalysis Data
