Application of a Delay-Difference Model for the Stock Assessment of Southern Atlantic Albacore (Thunnus alalunga)
2015-03-31ZHANGKuiLIUQunandKALHOROMuhsanAli
ZHANG Kui, LIU Qun, and KALHORO Muhsan Ali
Application of a Delay-Difference Model for the Stock Assessment of Southern Atlantic Albacore ()
ZHANG Kui, LIU Qun*, and KALHORO Muhsan Ali
,,266003,.
Delay-difference models are intermediate between simple surplus-production models and complicated age-structured models. Such intermediate models are more efficient and require less data than age-structured models. In this study, a delay-differ- ence model was applied to fit catch and catch per unit effort (CPUE) data (1975–2011) of the southern Atlantic albacore () stock. The proposed delay-difference model captures annual fluctuations in predicted CPUE data better than Fox model. In a Monte Carlo simulation, white noises (CVs) were superimposed on the observed CPUE data at four levels. Relative estimate error was then calculated to compare the estimated results with the true values of parametersandin Ricker stock-recruitment model and the catchability coefficient.is more sensitive to CV thanand. We also calculated an 80% percentile confidence interval of the maximum sustainable yield (MSY, 21756t to 23408t; median 22490t) with the delay-difference model. The yield of the southern Atlantic albacore stock in 2011 was 24122t, and the estimated ratios of catch against MSY for the past seven years were approximately 1.0. We suggest that care should be taken to protect the albacore fishery in the southern Atlantic Ocean. The proposed delay-difference model provides a good fit to the data of southern Atlantic albacore stock and may be a useful choice for the assessment of regional albacore stock.
delay-difference model; albacore (); catch per unit effort; Ricker model; stock-recruitment relationship; maximum sustainable yield
1 Introduction
Delay-difference models are considered as a theoretical bridge between simple surplus-production models and complicated age-structured models (Hilborn and Walters, 1992; Quinn and Deriso, 1999). This ‘bridge’ was initially developed by Deriso (1980) and further elaborated by Kimura (1984, 1985), Schnute (1985, 1987), Fogarty and Murawski (1986), and Fournier and Doonan (1987). This bridge was then modified by Walters and Martell (2004). Schnute-Deriso delay-difference model considers biological information in a simple way (Musick., 2005), assumes a constant natural mortality rate, and uses fishing mortality rate as being independent of age for fish at recruitment age and older (Deriso, 1980). Although this model does not perform well for stocks such as shrimps and smaller tunas that continually reproduce over time, delay-difference models have been successfully used to estimate stock size in shark-like fishes (Musick., 2005), fishes with long life cycle (Pallare and Restrepo, 2003; Jensen., 2009), lobster (Hall, 1997), and prawn ().
Albacore (), which is a temperate tuna species fromthe family Scombridae, is widely distributed in marine waters,including the Mediterranean Sea (Sun., 2002). In the Atlantic Ocean, the International Commission for the Conservation of Atlantic Tunas (ICCAT) has divided albacore stockinto three groups: the northern and southern Atlantic stocks (separated at 5˚N) and the Mediterranean stock (ICCAT, 1999). The northernAtlantic albacore stock has suffered from overfishing; so ICCAT has issued a stock rebuilding plan, in which target population levels are to be rebuilt by 2020. Although the status of the southern Atlantic albacore stock is better than that of the northern stock, the former may also face overfishing according to the report of 2011 ICCAT Albacore Stock Assessment Meeting (ICCAT, 2012).
The southern Atlantic albacore stock has been assessed using an age-structured production model (ASPM), Bayesian surplus-production model, and a surplus-pro- duction model incorporating covariates (ASPIC) (ICCAT, 2012). In fully age-structured models, detailed biological information should be obtained (Hilborn and Walters, 1992), and uncertainties may create doubtful results of stock assessment (Pallare and Restrepo, 2003). Surplus-production models only provide an overview because of the lack of biological realism (Quinn and Deriso, 1999). Thus, alternative model tools are necessary to conduct appropriate southern Atlantic albacore stock assessments.
In this study, a delay-difference model (Deriso, 1980; Schnute, 1985, 1987) was applied to assess the southern Atlantic albacore () fishery data. We estimated the maximum sustainable yield (MSY) and other biological reference points commonly used as management benchmarks (., BMSY, EMSY, and FMSY) (Jacobson., 2002). Estimated results were then analyzed to verify the proposed methodology and provide reference data for the sustainable management of the southern Atlantic albacore fishery.
2 Materials and Methods
2.1 Data Sources
The catch data of the southern Atlantic albacore fishery from 1975 to 2011 were obtained from the,(2011). For this albacore stock, the total catches in the past 30 years ranged from approximately 15000t to 40000t, which is mostly attributed to the longline fisheries (ICCAT, 2012). According to ICCAT (2013), the index of Chinese Taipei longline fishery may significantly indicate the abundance of albacore stock. Thus, we used a standardized catch per unit effort (CPUE) based on the Chinese Taipei longline fisheryas a relative abundance index of albacore stock. Fig.1 shows the statistical data of catch and standardized CPUE of the southern Atlantic albacore fishery from 1975 to 2011.
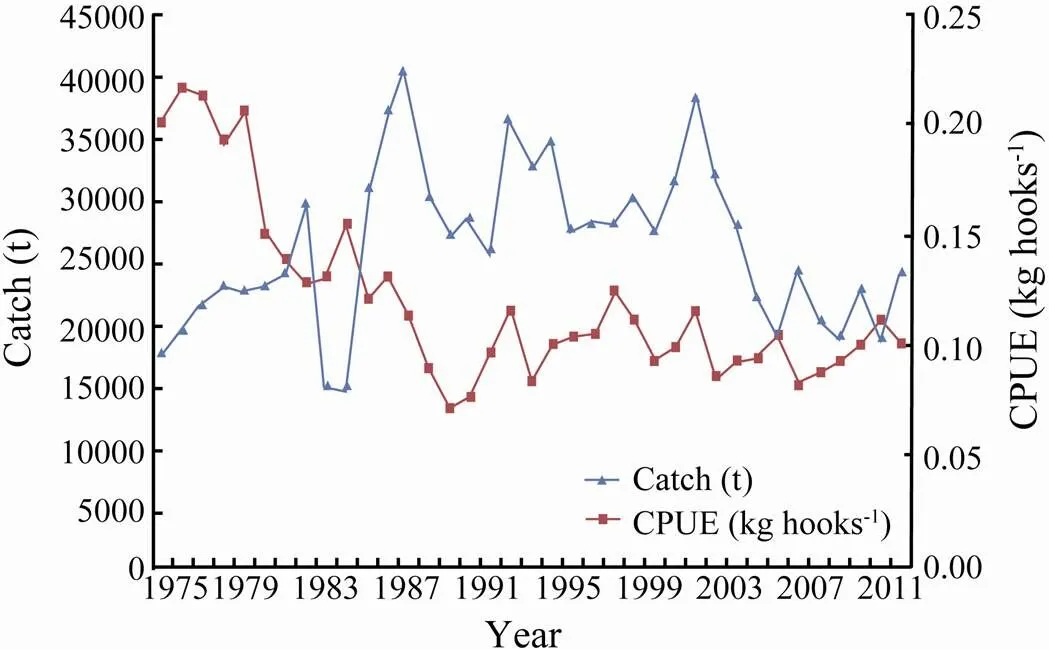
Fig.1 Statistical data of the catch and standardized catch per unit effort (CPUE) of the southern Atlantic albacore (Thunnus alalunga) fishery from 1975 to 2011.
2.2 Growth Model
In the delay-difference model, the mean body weight of recruitable fish follows a linear relationship for age≥(Hilborn and Walters, 1992):

whereis age,is the recruitment age, andandare parameters. Schnute (1987) proposed the following solution to estimateand:
,
whereandWare Von Bertalanffy growth coefficients and asymptotic weight, respectively. We obtained the point estimates of,W, and mean body weight at ages(W)and−1 (W−1) from Von Bertalanffy growth equation ofLee and Yeh (2007):

The length-weight relationship published by Penney (1994) was also obtained:
.
The estimated growth parameters were listed as follows:, 0.126year−1;W,89.53kg; W,16.59kg; andW1, 12.09kg.
In addition to growth assumption, constant natural mortality rate and fishing mortality rate were considered independent of age for fish at recruitment age and older.
2.3 Stock-Recruitment Relationship (SRR)
Schnute (1985) and Fournier and Doonan (1987) suggested a three-parameter SRR model. However, Hilborn and Walters (1992) indicated that this model is unnecessary and suggested the use of Beverton-Holt or Ricker SRR models.
In this study, Ricker SRR model was used to explain the relationship between spawning biomass and recruitment and expressed as follows:

whereandare the parameters in the Ricker SRR model andis the process error term for population. We can identify the equilibrium stock size for a specific harvest rate by using the following equation (Hilborn and Walters, 1992):
,
whereBis the equilibrium stock size,is the harvest rate, andis a growth-survival constant calculated from the following complicated expression:

whereis the constant natural survival rate that can be calculated from the instantaneous natural mortality,.,. We can then calculate the equilibrium catch. MSY can be estimated on the basis of the relationship betweenCand effort, the equilibrium spawning stock, and the equilibrium recruitmentefrom the SRR model, or with.Equilibrium numbers can be calculated as follows:
.
The equilibrium mean body weight is obtained from:

2.4 Population Model
In the delay-difference model, two equations for biomass and numbers are considered and respectively expressed as follows:

,
whereB,N,andRare the biomass, numbers, and recruitment in the year, respectively. The total survival ratesis derived from. We assumed an initial biomass of CPUE/(Hilborn and Walters, 1992) and the mean body weight of 16.7kg in the first year (1975) (Yeh., 1990). A recruitment age of 5 years and an instantaneous natural mortality of0.3 (ICCAT, 2012) were also used in this study.
We applied ASPIC. 5.0 (Prager, 2005) to fit the data using surplus-production models and used Akaike information criterion(AIC, Akaike, 1974) to compare the predictions of CPUE with those from the delay-difference model. Smaller AIC value means better fit.
2.5 Parameter Estimation
The observation error of CPUE is considered as having a lognormal distribution and expressed as follows:

.
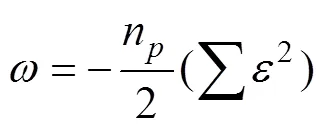
To estimate the parametersandin Ricker SRR model and the catchability, we should maximize the log-likelihood below as the objective function.
We provided the confidence intervals of the three parameters based on the percentiles of the bootstrap distribution (Efron and Tibshirani, 1993).
2.6 Monte Carlo Simulation
The externalenvironmentgreatly affects fisheries. Hilborn and Walters (1992) indicated that estimation biases and sensitivity to parameter estimations can be acquired by Monte Carlo simulations.
In this study, the white noises (CVs) of normally distributed errors were superimposed in the CPUE data at four levels (2%, 10%, 20%, and 30%). Normally distributed random variables were generated using a random number generator, RAN (Press., 1986). A thousand replications were conducted for each CV, and the relative estimate error (REE) was calculated to compare the results of different CVs used to estimate the parameters in Ricker SRR model with catchability. REE is expressed as follows:

3 Results
3.1 Growth
The values ofandin the linear relationship of the mean body weight were calculated fromandW,, 10.74 and 0.88, respectively. Fig.2 shows the prediction of mean body weight in terms of the total survival rate of the southern Atlantic albacore stock. The mean body weight, which increases as the total survival rates increase, can be expressed as follows:

3.2 Predicted CPUE
Fig.3 shows the observed CPUE of the southern Atlan tic albacore fishery from 1975 to 2011 and the predicted CPUE obtained from the delay-difference model and the Fox model (Su and Liu, 1998) in ASPIC.Annual fluctuations in CPUE were captured more efficiently in the delay- difference model than in the Fox model. The values of AIC in delay-difference and Fox models were −309.72 and −293.19, respectively.
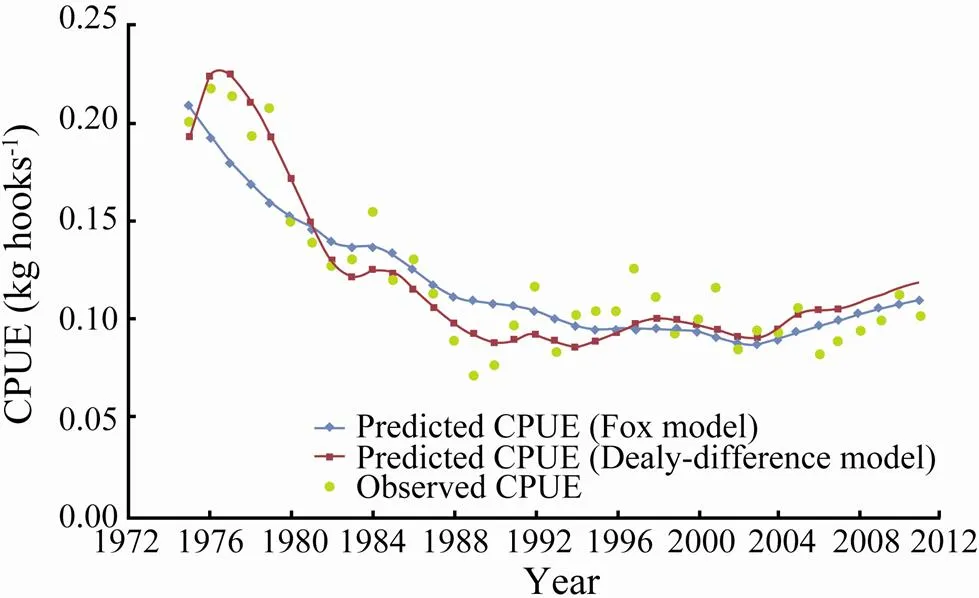
Fig.3 Observed and predicted catch per unit effort (CPUE) of the southern Atlantic albacore (Thunnus alalunga) fishery from 1975 to 2011.
3.3 Estimated Parameters
We obtained the point estimates and 80% percentile confidence intervals ofandin Ricker SRR model andbased on 1000 bootstrap replications. For the southern Atlantic albacore fishery, the median values of the three parameters were 0.0524, 9.653E-09, and 9.588E-10, respectively, and the corresponding 80% percentile confidence intervals were (0.0496, 0.0602), (9.091E-09, 1.166E-08), and (9.061E-10, 1.138E-09), respectively.
Fig.4 shows the boxplots of the percentage relative bias of the estimated,, and. Table 1 summarizes the REEs of the three estimated parameters for 1000 replications at different CVs.is apparently more sensitive to CV thanand. The true values of,, andwere 0.0504, 9.183E-09, and 9.172E-10, respectively.
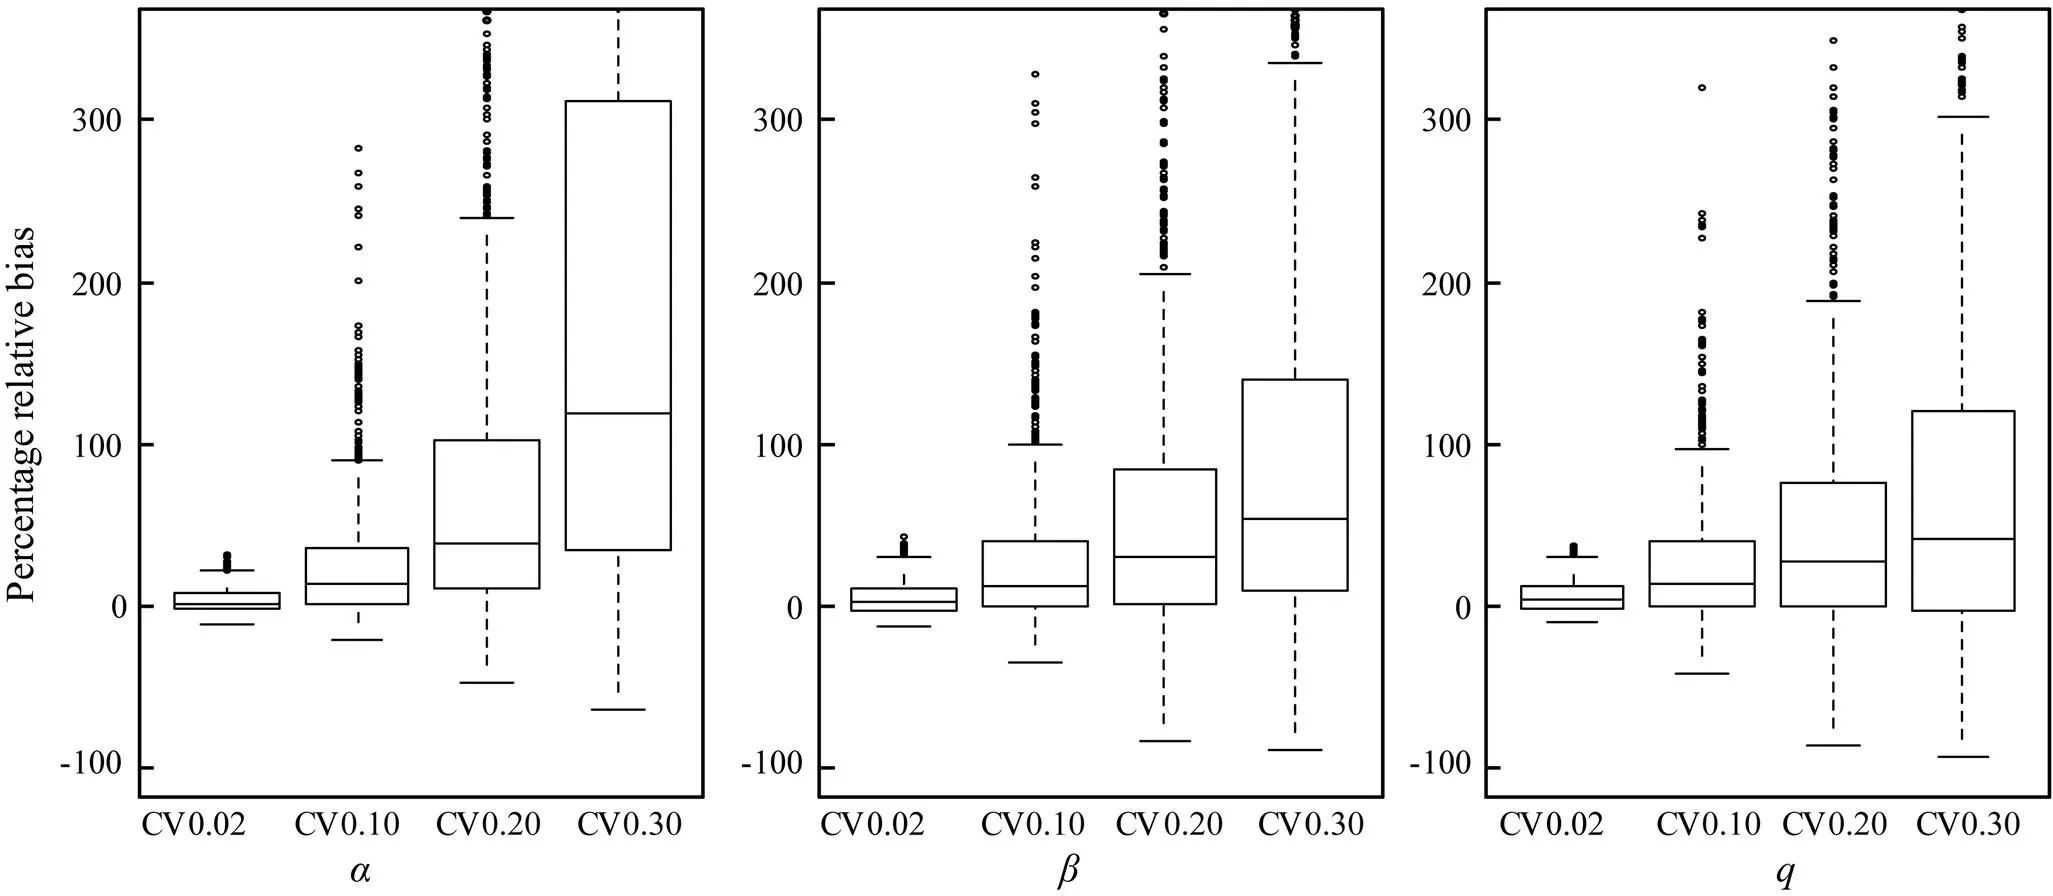
Fig.4 Boxplots of the percentage relative bias of the parameters α and β in Ricker stock-recruitment model and the catchability coefficient q estimatedat different levels of white noise (CV) for catch per unit effort.

Table 1 Relative estimate errors (%) of the estimated α, β, and q for 1000 replications at different levels of white noise (CV) for catch per unit effort
Notes:andare thetwo parameters in Ricker stock-recruit- ment model, andis the catchability coefficient estimatedat different levels of white noise (CV) for catch per unit effort.
3.4 Equilibrium Spawning Stock and Biological Reference Points
Fig.5 shows the equilibrium relationship between stock size and harvest rate of the southern Atlantic albacore stock derived using the median values ofandobtained using the bootstrap procedure. Biomass decreased as harvest rate decreased, whereas recruitment peaked at an approximate harvest rate of 0.15.

Fig.5 Equilibrium relationship between stock biomass, recruits, and harvest rate for the southern Atlantic albacore (Thunnus alalunga) stock (1975–2011) using the median values of α and β obtained using the bootstrapprocedure.
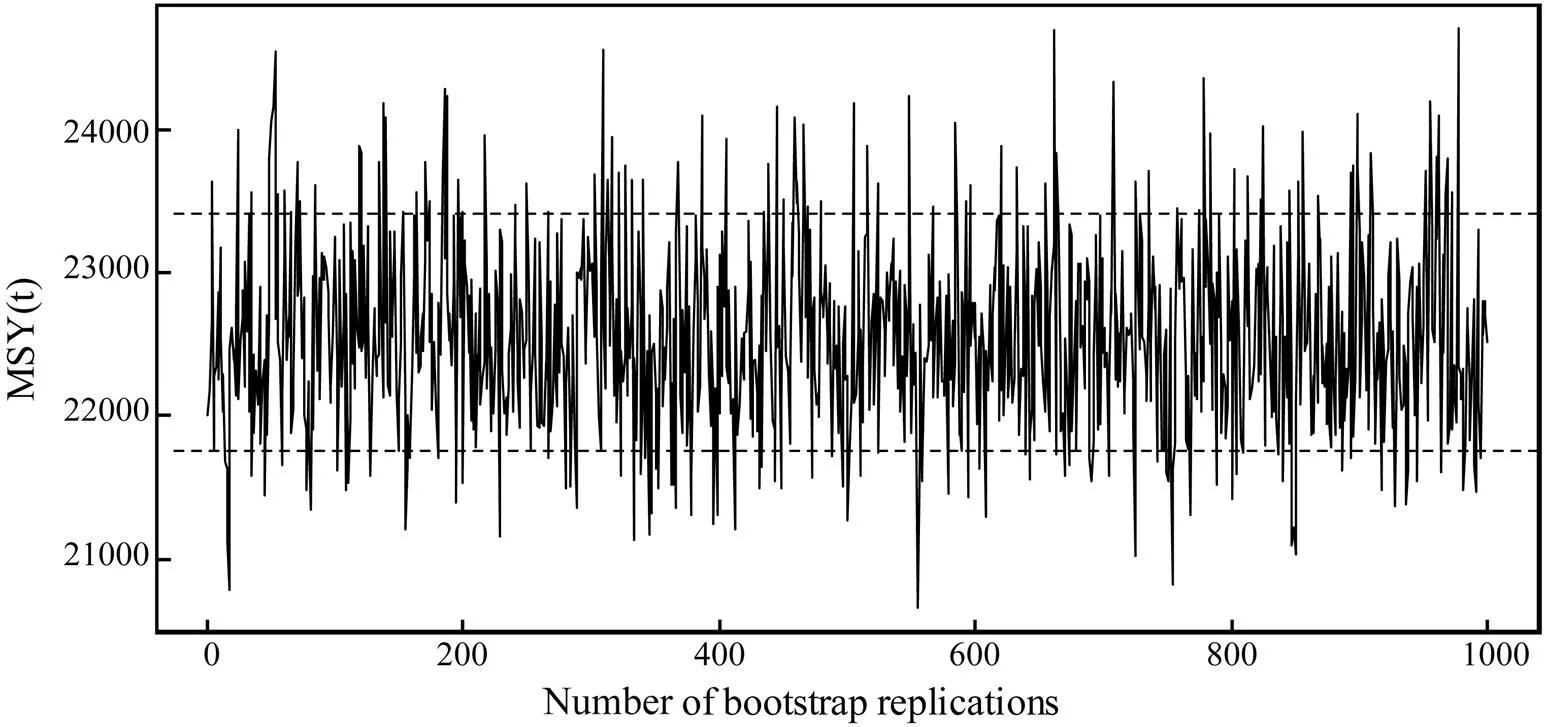
Fig.6 Results of 1000 bootstrap replications of the maximum sustainable yield (MSY) of the southern Atlantic albacore (Thunnus alalunga) stock from 1975–2011. The horizontal dashed lines are drawn at 10% and 90% percentiles.

Fig.7 Estimated trajectories of the ratios of catch against maximum sustainable yield (MSY, C/MSF), fishing mortality coefficient F against F at MSY (F/FMSY), biomass B against B at MSY (B/BMSY), and effort E against E at MSY (E/EMSY) of the southern Atlantic albacore (Thunnus alalunga) stock from 1975–2011. The horizontal dashed lines are drawn at a ratio of 1.0.
4 Discussion
4.1 Estimation of the Mean Body Weight
The equilibrium relationship (Fig.2) can be used to explain the effect of variations in survival rate on mean body weight and to estimate the survival rate for a particular observed mean body weight. However, this relationship is effective only when the stock is sufficiently large to exhibit a continual recruitment rate (Hilborn and Walters, 1992). For the southern Atlantic albacore stock, the mean body weight of the major gear landings was approximately 14.0kg to 20.2kg from 1975 to 2011 (ICCAT, 2013). The difference between the actual values of mean body weight and the estimated values in our study may be attributed to the linear relationship between mean body weight and age in the delay-difference model.
4.2 Predicted CPUE
The results of AIC shows that the delay-difference model exhibits a better fit than the Fox model for the southern Atlantic albacore stock; hence, fluctuations in CPUE were captured to a higher extent in the former than in the latter as shown by visual inspection of Fig.3. Hilborn and Walters (1992) also concluded that a delay-dif- ference model can be used to capture the cyclic trend better than Schaefer model for fitting the catch and CPUE data of Pacific cod (). Walters (1973) indicated that the failure of surplus-production models is attributed to the lack of biological reality and the neglect of time delays between reproduction and recruitment. Thus, we suggest the use of the delay-differ- ence model rather than the surplus-production model for the stock assessment of fish with time delays between reproduction and recruitment.
4.3 Parameter Estimation
We used the bootstrap procedure to obtain the 80% percentile confidence intervals ofandin Ricker SRR model and(Fig.4). Efron and Tibshirani (1993) indicated that the bootstrap confidence interval exhibits good coverage capabilities in theory and rational stability in practice. In this study,was more sensitive to CV thanandfor unknown reason(s).
4.4 Equilibrium Spawning Stock and Biological Reference Points
Our results showed that the recruitment initially increased until the harvest rate reached approximately 0.15 and then decreased because of the overfishing of recruitment; although the equilibrium biomass decreased consistently in the whole process, the biomass decreased slowly until recruitment declined (Fig.5). Many collapsed fish stocks are related to overfishing of recruitment(Murphy, 1966; Saville, 1980). Thus, recruitment is important in the life history of fish because the recruitment of juveniles is closely related to adult populations.
MSY, which has been accepted as the main management goal by numerous fishery organizations, constitutes the foundation of federal fishery management policies in the USA (Mesnil, 2012). Studies have been conducted to estimate the MSY of the southern Atlantic albacore stock by using different methods. For example, Lee and Yeh (2008) obtained an estimated MSY of 28771t in base case using ASPM. ICCAT (2012) provided an estimated MSY at a range of 23630t to 27390t by using ASPIC. In the present study, an 80% percentile confidence interval of MSY of 21756t to 23408t (median 22490t) was obtained using the delay-difference model (Fig.6). Our result is lower than that reported by Lee and Yeh (2008) and that obtained using ASPIC (ICCAT, 2012) primarily because different methods and data were used.
ICCAT (2012) estimated B2009/BMSYand F2009/FMSYas 0.624 to 1.204 and 0.795 to 1.342, respectively, by using ASPIC, and as 1.063 and 0.748, respectively, by using ASPM. These results are comparable to our estimated B2011/BMSYand F2011/FMSYvalues,., 1.18 and 1.42, respectively (Fig.7). The yield of the southern Atlantic albacore stock in 2011 was 24122t, and the estimated ratios of catch against MSY were approximately 1.0 in the past seven years. Therefore, we suggest that care should be taken to regulate the albacore fishery in the southern Atlantic Ocean. Furthermore, continual assessments of this commercial fishery are required for sustainable exploitation (Gray, 2009).
In summary, the delay-difference model provides a good fit to the catch data of the southern Atlantic albacore () stock. This model may also present a useful choice for other regional albacore stock assessments because simple surplus-production models lack biological realism and complicated age-structured models require high-level data.
Acknowledgements
We thank the editor and the anonymous reviewers for their helpful comments. This work was supported by the Fundamental Research Funds for the Central Universities of China (Grant No. 201022001).
Akaike, H., 1974. A new look at the statistical model identification., 19 (6): 716- 723.
Deriso, R. B., 1980. Harvesting strategies and parameter estimation for an age-structured model., 37: 268-282.
Dichmont, C. M., Punt, A. E., Deng, A., Dell, Q., and Venables,W., 2003. Application of a weekly delay-difference model to commercial catch and effort data for tiger prawns in Australia’s Northern Prawn Fishery., 65: 335- 350.
Efron, B., and Tibshirani, R. J., 1993.. Chapman and Hall/CRC, New York, London, 416pp.
Fogarty, M. J., and Murawski, S. A., 1986. Population dynamics and assessment of exploited invertebrate stocks. In:. Jamieson, G. S., and Bourne, N., eds., T & H Printers Ltd., Ottawa, Ontario, 228-244.
Fournier, D. A., and Doonan, I. J., 1987. A length-based stock assessment method utilizing a generalized delay-difference model.,44: 422-437.
Gray, C. A., Silberschneider, V., and Stewart, J., 2009. Age, growth, maturity and the overfishing of the iconic sciaenid,, in south-eastern, Australia., 95: 220-229.
Hall, N. G., 1997. Delay-difference model to estimate the catch of different categories of the western rock lobster () for the two stages of the annual fishing season., 48: 949-958.
Hilborn, R., and Walters, C. J., 1992.. Chap- man and Hall/CRC, New York, London, 449pp.
ICCAT, 1999. Detailed report on albacore.,, 49 (4): 1-92.
ICCAT, 2011.. Madrid, Spain, 156pp.
ICCAT, 2012. Report of the 2011 ICCAT south Atlantic and Mediterranean albacore stock assessment sessions., 68 (2): 387-491.
ICCAT, 2013.. Madrid, Spain, 68pp.
Jensen, O. P., Gilroy, D. J., Hogan, Z., and Allen, B. C., 2009. Evaluating recreational fisheries for an endangered species: A case study of taimen,, in Mongolia., 66: 1707-1718.
Jacobson, L. D., Cadrin, S. X., and Weinberg, J. R., 2002. Tools for estimating surplus production andMSYin any stock assessment model., 22: 326-338.
Kimura, D. K., Balsiger, J. W., and Ito, D. H., 1984. Generalized stock reduction analysis., 41: 1325-1333.
Kimura, D. K., 1985. Changes to stock reduction analysis indicated by Schnute’s general theory., 42: 2059-2060.
Lee, L. K., and Yeh, S. Y., 2007. Age and growth of south Atlantic albacore–A revision after the revelation of otolith daily ring counts.,, 60 (2): 443-456.
Lee, L. K., and Yeh, S. Y., 2008. Assessment of south Atlantic albacore resource based on 1959-2005 catch and effort statistics from ICCAT., 62 (3): 870-883.
Mesnil, B., 2012. The hesitant emergence of maximum sustainable yield (MSY) in fisheries policies in Europe., 36: 473-480.
Murphy, G. I., 1966. Population biology of the Pacific sardine ()., 34: 1-84.
Musick, J. A., Bonfil, R., and Stevens, J. D., 2005.. FAO, Rome, 474pp.
Pallare, P., and Restrepo, V., 2003. Use of delay-difference models to assess the India bigeye stock., 6: 148-150.
Penney, A. J., 1994. Morphometric relationships, annual catches and catch-at-size for South African caught South Atlantic albacore ()., 42 (1): 371-382.
Prager, M. H., 2005. A stock production model incorporating covariates (version 5) and auxiliary programs, CCFHR (NOAA) Miami laboratory document MIA-92/93-55, Beau-fort Laboratory Document BL-2004-01.
Press, W. H., Flannery, B. P., Teukolsky, S. A., and Vetterling, W. T., 1986.Cambridge Press, Cambridge, UK, 848pp.
Quinn II, T. J., and Deriso, R. B., 1999.. Oxford University Press, New York, 542pp.
Ricker, W. E., 1975.. Bulletin of the Fisheries Research Board of Canada, The Blackburn Press, 400pp.
Saville, A., 1980. The assessment and management of pelagic fish stock. A symposium held in Aberdeen, 3–7 July 1978., 177: 517pp.
Schnute, J. T., 1985. A general theory for analysis of catch and effort data.,42: 414-429.
Schnute, J. T., 1987. A general fishery model for a size-struc- tured fish population.,44: 924-940.
Sun, C. L., Ehrhardt, N. M., Porch, C. E., and Yeh, S. Z., 2002. Analyses of yield and spawning stock biomass per recruit for the South Atlantic albacore ()., 56: 193-204.
Su, Z. M., and Liu, Q., 1998. A continuous Fox-form of the surplus production observation-error estimator., 34: 59-76.
Walter, G. G., 1973.Delay-differential equation models for fisheries., 30: 939-945.
Walters, C. J., and Martell, S. J. D., 2004.. Princeton University Press, Princeton, New Jersey, 448pp.
Yeh, S. Y., Liu, H. C., and Tsou, T. S., 1990. Assessment of the south Atlantic albacore resource by using surplus production models, 1967–1988., 31: 236-240.
(Edited by Qiu Yantao)
10.1007/s11802-015-2517-0
(October 18, 2013; revised December 10, 2013; accepted March 8, 2015)
. Tel: 0086-532-82031715 E-mail:qunliu@ouc.edu.cn
ISSN 1672-5182, 2015 14 (3): 557-563
© Ocean University of China, Science Press and Spring-Verlag Berlin Heidelberg 2015
杂志排行
Journal of Ocean University of China的其它文章
- Monte Carlo Simulation of in situ Gamma-Spectra Recorded by NaI (Tl) Detector in the Marine Environment
- Effects of Waterborne Cu and Cd on Anti-oxidative Response,Lipid Peroxidation and Heavy Metals Accumulation in Abalone Haliotis discus hannai Ino
- A General Overview of the Typical18Frontal-Ventral-Transverse Cirri Oxytrichidae s. l. Genera (Ciliophora, Hypotrichia)
- Invasion and Morphological Variation of the Non- Indigenous Barnacle Chthamalus challengeri (Hoek, 1883) in Yangshan Port and its Surrounding Areas
- The Burial of Biogenic Silica, Organic Carbon and Organic Nitrogen in the Sediments of the East China Sea
- Hydrochemistry of the Natural Low pH Groundwater in the Coastal Aquifers near Beihai, China
