基于树轮宽度重建的河南石人山地区1850年以来季节最低温度及20世纪增温
2015-03-28张艳华蔡秋芳宋慧明马永永梅若晨
刘 禹,张艳华,蔡秋芳,宋慧明,马永永,梅若晨
(1. 中国科学院地球环境研究所 黄土与第四纪地质国家重点实验室,西安 710061;
2. 全球变化联合研究中心,北京 100875;3. 西安交通大学 人居环境与建筑工程学院,西安 710049;4. 中国科学院大学,北京100049)
基于树轮宽度重建的河南石人山地区1850年以来季节最低温度及20世纪增温
刘 禹1,2,3,张艳华1,4,蔡秋芳1,宋慧明1,4,马永永1,4,梅若晨1,4
(1. 中国科学院地球环境研究所 黄土与第四纪地质国家重点实验室,西安 710061;
2. 全球变化联合研究中心,北京 100875;3. 西安交通大学 人居环境与建筑工程学院,西安 710049;4. 中国科学院大学,北京100049)
气候变化影响农业生产和相应的管理活动。中原地区位于我国中部,地域广阔,是我国重要的粮食生产基地。了解这一地区的历史气候变化极为重要。目前我们对这一地区过去几百年气候变化历史的了解主要来自于历史文献记载,缺乏自然地质记录的证据。本研究从河南石人山地区获取了一组油松树轮样本,在树轮宽度和现代气象观测记录统计相关分析的基础上,建立转换方程,重建了石人山地区1850 — 2011年上年10月至当年6月的平均最低温度。重建对观测温度(1958 — 2011年)的解释方差达到48.8%。重建中较暖时段有1892 — 1906年和1995 — 2011年;较冷期主要发生在1875 — 1890年、1910 — 1932年和1967 — 1980年。石人山地区自20世纪10年代以来持续增温,20世纪80年代以后增温更为显著(重建的10个高温年中9个都出现在1998年之后),表明石人山地区的温度重建结果能够捕捉20世纪以来的全球变暖信号。树轮宽度和温度的正相关关系也表明如果石人山地区未来持续变暖,将为油松的生长创造有利条件。本文重建中的冷暖时段与研究区附近其他地区温度序列中的冷暖时段较为一致,表明我国中部温度变化在较大区域范围内较为同步。空间场分析进一步证实了上述分析。此外,重建温度与全球海温(SST)的空间场分析表明石人山地区温度变化与西太平洋海温、印度洋和北大西洋海温变化密切相关。
中国石人山;油松(Pinus tabulaeformis);树轮宽度;平均最低温度;重建
Climate change infl uences agriculture production and corresponding management activities. Thus, understanding the characteristics of climate variation on a long-term background is imperative. Tree rings are very important natural archives containing rich climatic information. In addition to genetic factors, tree growth is mainly affected by climatic variables, such as temperature and precipitation. Consequently, annual climatic information can be obtained from tree rings. Tree-ring data have played a crucial role in paleoclimatic research and global climate studies because of their high resolution, precise dating, high continuity and ease of sampling. The knowledge of Northern Hemisphere temperature changes over the past 2000 years was primarily obtained through treering data (Briffa et al, 2001, 2008; Esper et al, 2002; Mann et al, 2008). Integrated temperature studies in Asia have also been conducted (Cook et al, 2013; PAGES 2k Consortium, 2013). Based on tree-ring data, many temperature series have been reconstructed for various regions of China, mainly on the Tibetan Plateau (Gou et al, 2008; Liang et al, 2008; Liu et al, 2009a; Zhu et al, 2011), the Loess Plateau (Liu et al, 2009b; Cai et al, 2010, 2013; Li et al, 2013), northeastern China (Bao et al, 2012; Chen et al, 2013; Liu et al, 2013), and southeastern China (Duan et al, 2013; Chen et al, 2014). The signifi cant warming that occurred in the late 20th century was also detected (Gou et al, 2008; Liu et al, 2009a, 2011). However, most dendroclimatological researches in China have focused on the Tibetan Plateau and the northern arid to semi-arid regions. In other regions, such as the Central Plains of China (CPC; the strict defi nition of CPC is the region bounded by 31°23'~ 36°22'N and 110°21' ~ 116°39'E), few tree-ring studies have been conducted due to the diffi culty in fi nding old trees.
The climate of CPC is very complex. Current knowledge about the past climate of this region is mainly known from historical documents (Ge et al, 2002; Su, 2003). Thus far, only two tree-ring studies have been conducted in this region. The density of tree-ring sites in this area is obviously insuffi cient. The two available tree-ring studies showed different results, even they both involved temperature reconstruction: the December to April mean temperature was reconstructed by Shi et al (2009), and the May to July mean maximum temperature was reconstructed by Tian et al (2009). Thus, it is necessary to investigate the natural climate changes in the CPC using natural archives, such as tree rings.
In this study, we reconstructed the mean minimum temperature from the previous December to the current June (Tmin_DJ) beginning from 1850 AD based on Pinus tabulaeformis tree-ring widths from Shiren Mountains (SRM) in the CPC. The reconstructed Tmin_DJseries was also used to explore the temporal and spatial representativeness of these data on a larger scale. This study added data from an important site, thus increasing the spatial coverage of tree-ring data in the CPC.
1 Materials and methods
1.1 Sampling
SRM is located in western Lushan County, Henan Province (China) at elevations from 1300 m to 2153 m above sea level. The mountain lies in a transition region between the northern subtropical climate and a warm temperate continental monsoon climate. More than 50 years of meteorological observations from Xixia station (33°18'N, 111°30'E, 250.3 m, 1957— 2011) indicate that the average annual precipitation is 823 mm, and most of this rainfall occurs from June to August. The annual mean temperature is approximately 14.8℃. The warmest month is July, exhibiting temperatures from 25.3℃to 28.1℃. The coldest month is January, exhibiting a temperature of approximately -1.9℃. The dominant tree species within the sampling site is Chinese Pine (Pinus tabulaeformis Carr.). According to previous study (Xu, 1993), the cambial cell division of Pinus tabulaeformis begins at a mean temperature of 9.3℃and ceases at 15.9℃. This temperature range occurs from late April to mid-September in the SRM area. Broad-leaf tree species in the area include Quercus aliena var. acuteserrata and Betula albosinensis.
We selected Pinus tabulaeformis Carr. as our study species at a site located at 33°43'N, 112°16'E (elevation, 2010 m) (Fig.1). Two cores were taken from each of 31 tree using 5 mm increment borers. This group of 62 samples was named SRM. All sampled trees had discontinuous canopies. The soil at the sampling site was thick, brown mountain soil of 30 ~ 40 cm depth.

Fig.1 Map of the sampling site (SRM) and nearby meteorological stationsThe dark stars are the tree-ring sites used for comparison with our reconstruction in this paper. SYR: Source region of the Yangtze River; ZA: Zhen’an; FNS: Mt. Funiushan
1.2 Chronology development
In the laboratory, all tree-ring samples were dried, fixed, surfaced and mounted according to standard dendrochronological procedures. After cross-dating and measuring ring widths with 0.01 mm precision, all tree rings were assigned to exact calendar years. The COFECHA program (Holmes, 1983) was used to control the quality of the cross-dating. Each tree-ring measurement not only includes the climatic signal, but also the growth trend related to tree age and stand dynamics. Thus it’s necessary to get rid of such trend during the process of chronology development. Traditionally, negative exponential curve or straight line with negative slope or horizontal line was adopted as fitted curve, the raw data of each ring width was then divided by the corresponding year’s value of the fitted curve to give a dimensionless index. Finally the standard chronology (STD) was generated by averaging all the indices through the ARSTAN programme (Cook, 1990). However, previous studies suggested that such method could possibly cause “trend distortion problem”, while it could be corrected by employing a “signal free” detrending method (Melvin and Briffa, 2008). In this paper, we adopt the “signalfree” method to develop the tree-ring chronology (Fang et al, 2012). To utilize the maximum length of the tree-ring chronology and to assure the reliability of the reconstruction, the chronology was restricted to the period 1892— 2011 with the sub-sample signal strength (SSS) (Wigley et al, 1984) of at least 0.80, corresponding to 17 cores (Fig.2). The statistical characteristics of the chronology are shown in Tab.1.
1.3 Meteorological data
In this study, we used the observed data from the nearest Xixia station, 82 km west of sampling site. Standard methods were used to test the homogeneity and randomness of the observed meteorological data (Potter, 1981; Peterson and Easterling, 1994; Easterling and Peterson, 1995), and Lushi meteorological station (34°03'N, 111°02'E, 568.8 m, 1952 — 2011) was used for reference. The results indicated that the temperature and precipitation data obtained from these two meteorological stations qualified for further analysis. The distributions of monthly mean temperature, mean minimum temperature, mean maximum temperature and precipitation at each station are shown in Fig.3. The climate factor variations from these two stations match each other well.
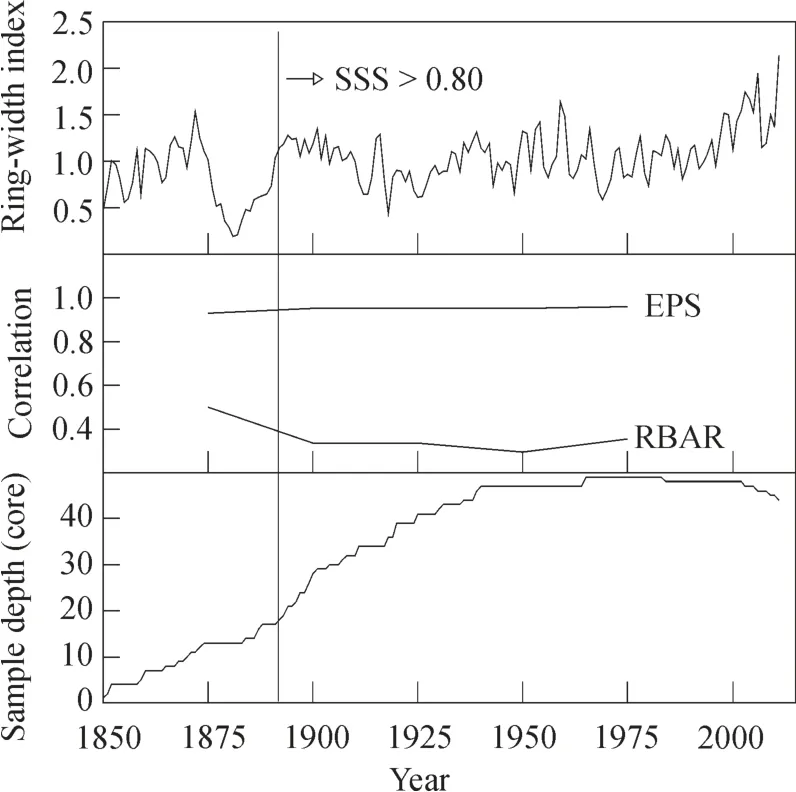
Fig.2 A plot of the tree-ring chronology showing the xpressed population signal (EPS), RBAR statistics and sample depth RBAR: average correlation between the indices for each year over sequential time periods.
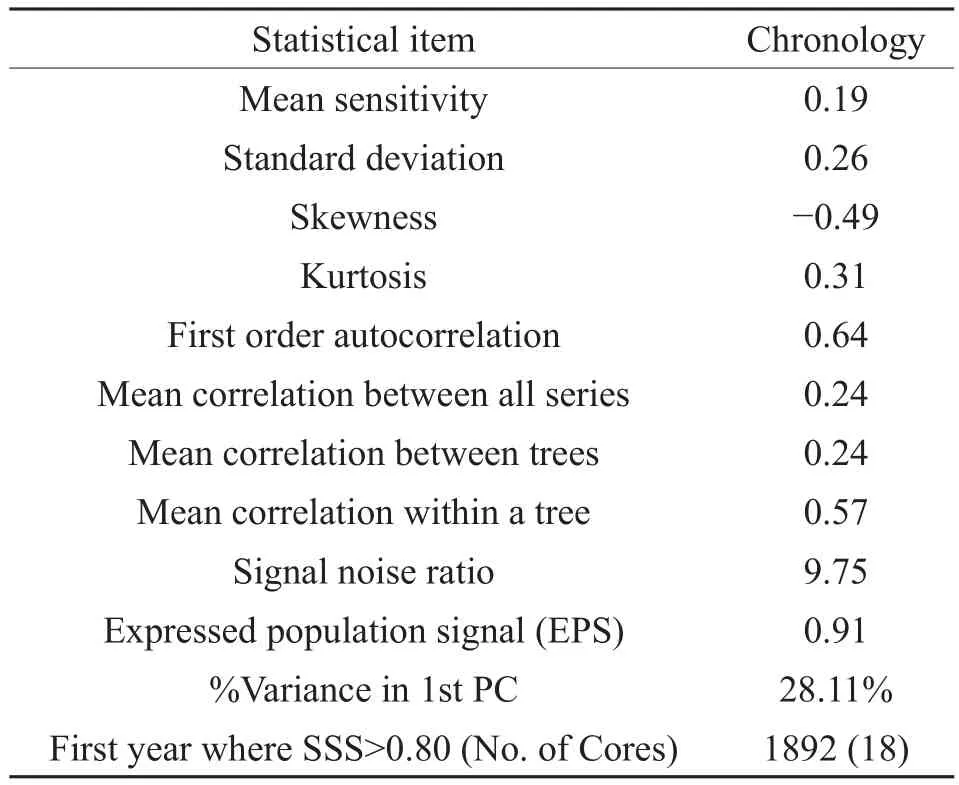
Tab.1 Statistical characteristics of the SRM chronology
1.4 Statistical methods
We used a correlation function to explore the relationship between the tree-ring width index and observed meteorological data. This function was also used to explore the relationships between our reconstruction, alternative temperature proxies andlarge-scale temperature reconstructions.

Fig.3 Monthly mean temperature (a), mean minimum temperature (b), mean maximum temperature (c) and monthly precipitation (d) at Xixia (1957 — 2011) and Lushi (1952 — 2011) meteorological stations.
A split calibration-verifi cation method was used to test the stability and reliability of the regression equation used (Fritts, 1991; Cook et al, 1999). The calibration was independently conducted for both the 1958 — 1987 and 1982 — 2011 periods, and the verifi cation was performed on periods not included in the calibration (i.e., 1988 — 2011 and 1958 — 1981). The parameters used in this method were Pearson’s correlation coefficient (r), the sign test (S), the reduction error (RE) and the coeffi cient of effi ciency (CE). The RE tests whether a reconstruction provides a better estimate of climatic variability than simply using the mean climatology for the calibration period (Cook and Kairiukstis, 1990; Cook et al, 1994). The values of the RE range from negative infi nity to 1.0 (a perfect estimation). The CE is used to determine the model skill during the verifi cation period (rather than the calibration period). The CE can be described as an expression of the true r2of a regression model when applied to a new dataset (Cook and Kairiukstis, 1990; Cook et al, 1994). The CE values also range from negative infi nity to 1.0 (a perfect estimation). Values of the RE and CE that are greater than zero indicate rigorous model skill. Higher positive values of the RE and CE values are more favourable. Typically, CE values are lower than RE values. However, the CE is a more rigorous verifi cation statistic than the RE (Cook et al, 1999).
A spatial correlation analysis was performed to examine the regional representativeness of the temperature reconstruction. We used the datasets from the Meteorological Office Hadley Centre and Climatic Research Unit (CRU TS 3.21) (http:// climexp.knmi.nl). Other tree-ring width-based temperature reconstructions from the source region of the Yangtze River, Zhen’an and Mt. Funiushan were compared with our minimum temperature reconstruction. A spectral analysis was performed using a multi-taper method, which is especially powerful for short time series (Mann and Lees, 1996; Rigozo et al, 2002).
2 Results
2.1 Correlations between ring width and climatic data
Canonical dendroclimatology assumes that the climate in year t-1 affects the ring width in the following year t (Fritts, 1976). Thus, the climatic variables were obtained from the previous September to the current September for this study.
We calculated the Pearson correlation between the ring-width index and the meteorological data to assess the response of tree growth to climatic factors prior to and during the current growing season. The results suggested that tree-ring width and precipitation were not signifi cantly correlated. The sampling site is located in a monsoon area at high elevation; thus, the available precipitation is sufficient for tree growth. The ring-width index was positively correlated with almost all the monthly temperature data from previous September to the current September, except for the previous October (Fig.4). By month combination, thehighest correlation was found between the ring-width index and the seasonal mean minimum temperature of previous December to current June (Tmin_DJ), with r = 0.699 (p < 0.001, N = 54). Clearly, a linear relationship existed between Tmin_DJand tree-ring width (Fig.5).
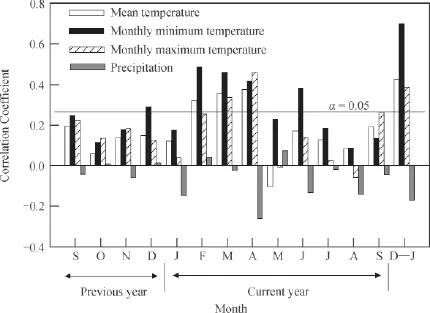
Fig.4 Correlations between the ring-width index and monthly meteorological data from Xixia station during 1957 — 2011 D — J: previous December to current June
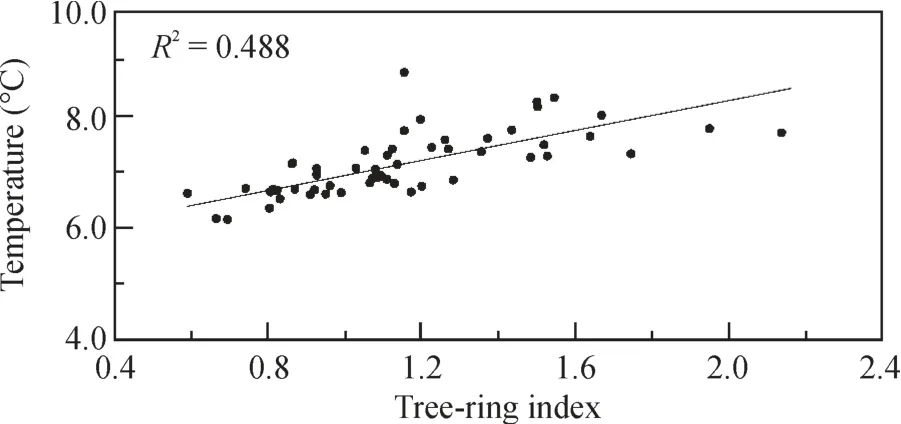
Fig.5 Scatterplot of the tree-ring width index and the averaged MMinT from previous December to current June (1958 — 2011)
2.2 Transfer function and verif cation
Based on the correlation between the tree-ring width index and the observed Tmin_DJof Xixia station, a simple linear regression model was created to reconstruct Tmin_DJof SRM:

(N = 54; r = 0.699; R2= 48.8%; R2adj= 47.9%; F = 49.641; p < 0.0001; D/W = 1.695)
Where Wtis the associated tree-ring width index in the year t. During the calibration period of 1958— 2011, the predictor variable accounted for 47.9% of the variance, after adjustment for the loss of degrees of freedom in the Tmin_DJtemperature data. The Durbin-Watson statistic (D/W), which is used to detect the presence of autocorrelation in the residuals from a regression analysis, was 1.695. This value indicates that autocorrelation did not occur among our residuals (when N = 54, autocorrelation did not occur with the D/W values of 1.57 ~ 2.43) (Durbin and Watson, 1950). The reconstructed and observed values of Tmin_DJduring 1958 — 2011 are compared in Fig.6a, indicating that the reconstructed Tmin_DJtracked the observations very well.
The results of the split calibration-verification method (Tab.2) indicated that the correlation coeffi cient and product means between the actual and reconstructed Tmin_DJin all calibration and verifi cation periods were signifi cant at the 0.01 level. The results of the sign test were statistically significant in all calibration and verification periods ( p < 0.05). The RE and CE values in both verification periods were positive, indicating that the regression model had good predictive performance and was efficient in reconstructing Tmin_DJfor the SRM region.
However, the leave-one-out test results suggested that 2007 was an outlier from the model. If weomit this year, the explained variance of the Tmin_DJtemperature is increased to 58.1%. The observed data indicated that an extremely cold event occurred during April 3 — 4, 2007, with a minimum temperature of -3.1℃ (the mean minimum temperature in April of 2007 was 7.4℃). Clearly, the extremely low temperatures prevailing during April 3 — 4, 2007 affected tree growth. Although 2007 was an unusual year, we did not remove it from model (1) because we cannot discount the possibility that similar events have occurred in the past. It is worth noting that two series remained significantly correlated (r = 0.57, p < 0.0001) after applying linear detrending to both the observation and the reconstruction, indicating that the reconstruction also captured the real climatic signal at high frequency.
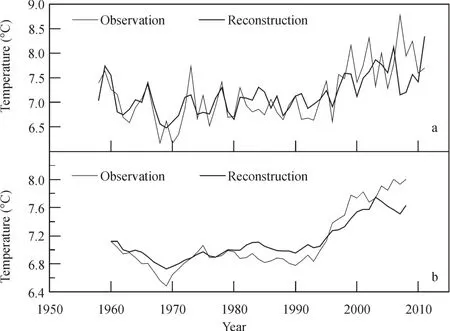
Fig.6 Comparisons between the observed (thin line) and reconstructed (thick line) Tmin_DJ(1958 — 2011) data of the original series (a) and the fi ve-year moving average series (b)
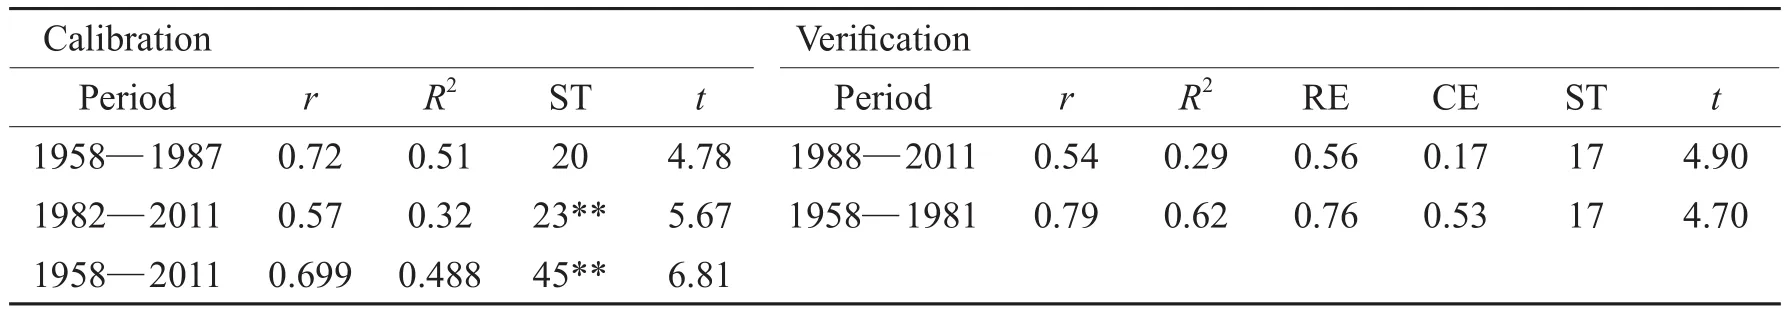
Tab.2 Statistics for a split calibration-verifi cation procedure
After applying a five-year moving average to the reconstructed and observed values (Fig.6b), the correlation coefficient increased (r = 0.965, p < 0.01 and R2= 93.1%). After reducing the number of degrees of freedom, the effective number of degrees of freedom was 10.8, and rp=0.001(10) = 0.823. This fi nding demonstrates that the reconstruction provides more reliable estimates of natural variability on decadal time scales.
2.3 Tmin_DJreconstruction since 1850 at SRM region
Overall, all test results suffi ciently demonstrated the validity of our regression model (1). Therefore, we used the full instrumental period Tmin_DJ, spanning 54 years, to develop the final reconstruction. Based on the regression model (1), the values of Tmin_DJfor 1850 — 2011 at SRM region were reconstructed and are presented in Fig.7. The smoothed line represents 11-year moving average data, and the horizontal line represents the mean for 1892 — 2011, with a value of 7.06℃ and a standard deviation (σ) ± 0.34℃.
2.4 Spatial correlation and periodicities
The spatial correlation between our Tmin_DJreconstruction and the CRU TS 3.21 MMinT datasets for the period 1958 — 2009 is shown in Fig.8. Fig.8a illustrates the spatial correlation between the observed Tmin_DJfrom the Xixia station and the CRU TS 3.21 Tmin_DJdatasets (1958 — 2009). Fig.8b illustrates the correlation between the reconstructed Tmin_DJof SRM region and the Tmin_DJof CRU TS 3.21.
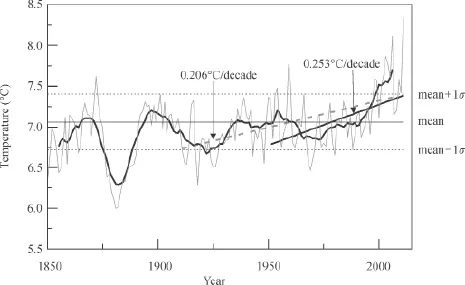
Fig.7 Reconstructed mean minimum temperature from previous December to current June during 1850 — 2011 in the SRM regionThe mean was 7.06℃ from 1892 to 2011, and the standard deviation (σ) was = ± 0.34℃. The bold line denotes the 11-year moving average

Fig.8 Spatial correlations between in the SRM region and CRU TS 3.21: (a) observation; (b) reconstruction
The periodicity test revealed remarkable Tmin_DJtemperature reconstruction quasi-cycles of 26, 3 ~ 7 years at the 99% confidence level for the last 162 years (Fig.9).
3 Discussions
The positive correlation between tree-ring width and minimum temperature can be explained as follows: During the winter, increased minimum temperatures protect the roots and cambial cells from frost damage (Pederson et al, 2004). During spring and early summer, in areas at high elevation, the minimum temperature is a critical factor affecting cambial activity (Deslauriers et al, 2003), and higher minimum temperatures during the growing season would produce wider rings (Bräuning, 2006; Gurskaya and Shiyatov, 2006; Liang et al, 2008).
In the Tmin_DJreconstruction, the 11 year moving average curve exhibited a gradual increasing trend with a slope of 0.206℃/decade from 1911 to 2011. This result was consistent with reports from the Intergovernmental Panel on Climate Change (IPCC, 2007), which found that 20th century global warming began circa 1910. The increase was more obvious from 1951 to 2011 with a slope of 0.253℃/decade. This increasing rate was quite similar to that of Nanwutai(300 km west of SRM, 0.276℃/decade) (Liu et al, 2014). In this study, we defi ned a “high Tmin_DJyear” as values >7.40℃ (mean + 1σ) and a “low Tmin_DJyear”as<6.72℃ (mean - 1σ). 14 and 16 temperature values were above and below these thresholds, respectively, accounting for 11.7% and 13.3% of the entire series (1892— 2011), respectively. The ten highest and ten lowest Tmin_DJvalues since 1892 are listed in Tab.3. Nine of the years exhibiting the highest Tmin_DJwere after 1998.

Fig.9 Spectral density of the Tmin_DJreconstruction in the SRM regionThe bold line represents the 95% confi dence level
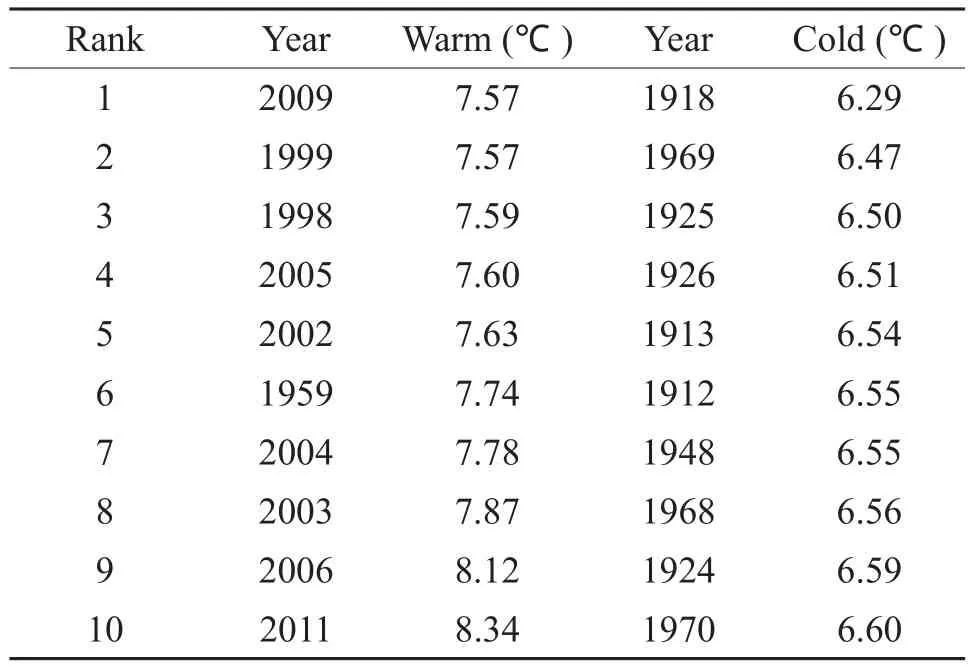
Tab.3 The ten highest and ten lowest Tmin_DJyears in the reconstruction
At the decadal scale, three cold periods were apparent during 1875— 1890, 1910— 1932 and 1967 — 1980, with Tmin_DJvalues lower than the 120 year mean from 1892 to 2011 (Fig.7). However, the cold interval of 1875— 1890 should be viewed with caution because the number of sample replications in the earliest part of the record was small. Two distinct warm intervals exhibiting Tmin_DJvalues higher than the 120 year mean occurred during the periods 1892— 1906 and 1995— 2011. Warming during the 20th century was well represented in the Tmin_DJtemperature reconstruction at SRM region. These results indicate that the mean minimum temperature increase in the CPC was synchronized with the rise in global temperature and that the CPC is sensitive to global climate change. Previous studies revealed that recent warming trends in China occurred not only in winter (Chen et al, 2012; Shi et al, 2013), but also in summer (i.e., May to July) (Liu et al, 2014). Thus, it is logical that the values of Tmin_DJfor the CPC tended to increase because this parameter represents both winter and early summer (June). We observed that the ring widths were much larger in the recent decade than previous years. It means that the high Tmin_DJbenefi ts plant growth not only for tree rings, but may also to local crops and forest coverage.
The Tmin_DJreconstruction at SRM can be compared with several other temperature series from other regions of China, such as the March—April mean temperature in Zhen’an in the south-central Qinling Mountains (Liu et al, 2001), the previous December to current April mean temperature at Mt. Funiushan (Shi et al, 2009) and the June — August minimum temperature at the source region of the Yangtze River (Liang et al, 2008) (Fig.10 a, b, c). All these series exhibit synchronized variations and similar warm-cold intervals, indicating that the temperature variations at SRM were consistent over a signifi cantly large spatial scale. Although these comparison regions are far from the sampling site (Fig.1), they exhibited highly synchronous warming trends since the late 20th century. Another notable feature was that all curves exhibited signifi cantly low temperatures circa 1870s. The Tmin_DJreconstruction and Asian summer minimum temperatures were also compared (Cook et al, 2013) (Fig.10d), and the two curves also exhibit similar variation patterns.
The comparisons mentioned above (Fig.10 a, b,c) are valid because Tmin_DJwas signifi cantly correlated with the temperature during other seasons in the Xixia meteorological records. Correlation analysis indicated that the Tmin_DJwas significantly correlated (1) with the mean temperature from March to April (N = 54, r = 0.70, p < 0.01), (2) with the mean temperature from the previous December to the current April (N=53, r = 0.83, p < 0.001) and (3) with the mean minimum temperature from June to August (N=54, r = 0.31, p < 0.05). These calculations indicate that Tmin_DJwas consistent with other temperature variables in different seasons. Thus, the Tmin_DJreconstruction in this study can be compared with the temperature series used in Fig.10.
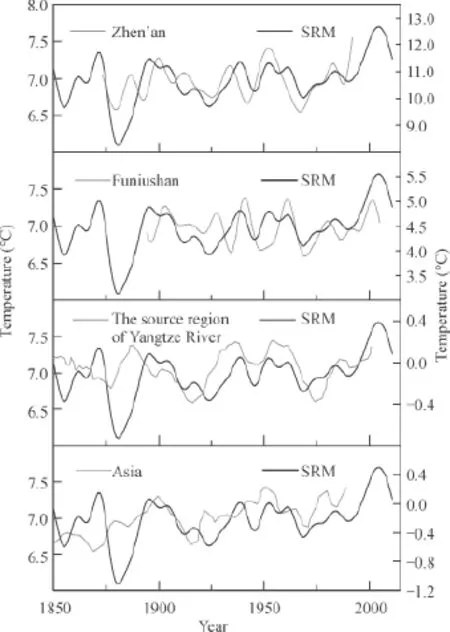
Fig.10 Comparisons of the Tmin_DJreconstruction at SRM with an alternate temperature series reconstructed using tree-ring widths (a ~ c): (a) March — April mean temperature in Zhen’an, South-Central Qinling Mountains (Liu et al, 2001); (b) Previous December to current April mean temperature at Mt. Funiushan (Shi et al, 2009); (c) June — August minimum temperature at the source region of the Yangtze River (Liang et al, 2008); (d) June — August minimum temperature in Asia (Cook et al, 2013) All lines denoted the ten-year low-pass data.
The close spatial relationship that our original Tmin_DJreconstruction exhibited as described above could be demonstrated using CRU TS 3.21 MMinT datasets to calculate the correlation for the period 1958 — 2009. The instrumental and reconstructed data (Fig.8 a, b) exhibited very similar patterns, indicating that our temperature reconstruction represented reliable climate variations on a large scale. The reconstruction exhibited a significant positive correlation with most part of China. Together, these fi ndings indicated that our Tmin_DJreconstruction captured real climatic signals and was well spatially representative.
The spatial calculation also indicated that observed and reconstructed Tmin_DJat SRM region were significantly correlated with the mean December — June SSTs of the western Pacifi c, Indian and North Atlantic Oceans. We also found that there was a weak correlation between Tmin_DJand El Niño variabilities (Fig.11).
Many previous studies revealed that ENSO events affect atmospheric circulation in mediumhigh latitudes through Hadley meridional circulation; consequently ENSO events affect winter temperatures in China (Han et al, 2014). The temperature from winter to spring is usually higher than normal in most parts of China during El Niño phases, when the sea surface temperature is high in the eastern equatorial Pacific. Conversely, during La Niña phases, the temperature is low in the eastern equatorial Pacifi c, and so is the temperature during the winter-spring season in China (Zhao et al, 2000; Xu et al, 2007). According to the result of spectral analysis, the 3~7 a periodicities resembled the ENSO cycle (Torrence and Webster, 1999), again indicating that the Tmin_DJvariation in the SRM region was possibly affected by ENSO. The 26 a cycle probably corresponds to sunspot activity (Han and Han, 2002). However, we do not found signifi cant correlation between the reconstructed Tmin_DJand sunspot number series (http://www.ngdc.noaa.gov/), it’s hard to say that solar activity certainly influence the temperature variation in SRM region.
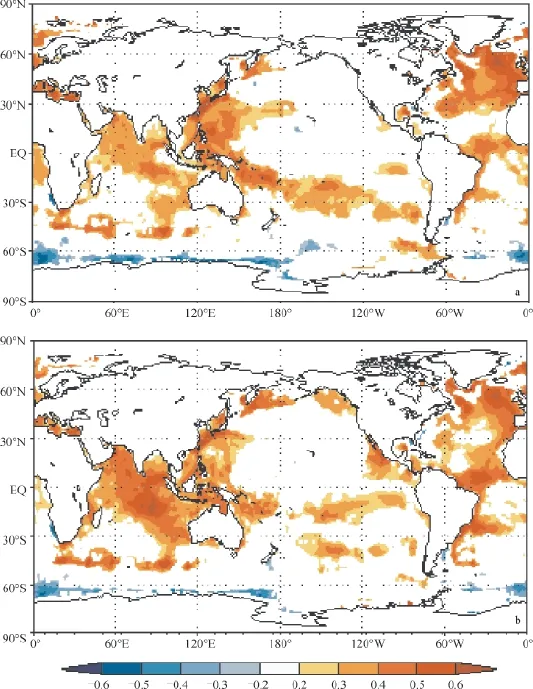
Fig.11 Spatial correlations between the Tmin_DJand the December—June SSTs from 1958—2011
4 Conclusions
Using Pinus tabulaeformis tree-ring widths, the mean minimum temperature of the previous December to the current June has been reconstructed for the SRM area in the CPC since 1850 AD. The reconstruction explained 48.8% of the instrumental variance during the calibration period (47.9%, when adjusted for the loss of degrees of freedom). Warming during the 20th century was well represented in the SRM Tmin_DJreconstruction. Tmin_DJexhibited a gradually increasing trend since the 1910s (and a distinct increasing trend after the end of 1980s), which is consistent with the IPCC report that modern global warming began in the 1910s. Therefore, the temperature increase in the CPC was synchronized with changes in global temperature. It is also apparent that the CPC is sensitive to changes in global temperature. Over the entire time series, nine years with the highest values of Tmin_DJoccurred after 1998. The spatial correlations showed that the values of Tmin_DJat SRM refl ected climate change on a larger spatial scale. The values of Tmin_DJat Mt. SRM were mainly influenced by the mean December — JuneSSTs of the western Pacifi c, Indian and North Atlantic Oceans. ENSO activity may play a rule as well. Finally, we realized the high Tmin_DJis benefi t for plant growth not only for tree rings, but may also to local crops and forest coverage.
Acknowledgments:We thank SHEN Baofa for his valuable help in fi eld work and sample preparation.
韩文韬, 卫 捷, 沈新勇. 2014. 近50年中国冬季气温对ENSO响应的时空稳定性分析研究[J]. 气候与环境研究, 19(1): 97 - 106. [Han W T, Wei J, Shen X Y. 2014. Stability analysis in space-time on the response of winter temperature in China to ENSO in the past 50 years [J]. Climatic and Environmental Research, 19(1): 97 - 106.]
刘 禹, 马利民, 蔡秋芳, 等. 2001. 依据陕西秦岭镇安树木年轮重建3—4月份气温序列 [J]. 自然科学进展, 11(2): 157 - 162. [Liu Y, Ma L M, Cai Q F, et al. 2001. March to April Mean tempeture reconstruction from tree rings for Zhen’an region [J]. Advances in Nature Science, 11(2): 157 - 162.]
史江峰, 鹿化煜, 万建东,等. 2009. 采用华山松树轮宽度重建秦岭东缘近百年冬半年温度[J]. 第四纪研究, 29(4): 831 - 836. [Shi J F, Lu H Y, Wan J D, et al. 2009. Winterhalf year temperature reconstruction of the last century using Pinus armandii Franch tree-ring width chronology in the eastern Qinling Mountains [J]. Quaternary Sciences, 29(4): 831 - 836.]
苏全有. 2003. 有关近代河南灾荒的几个问题[J]. 殷都学刊, 4: 55 - 59. [Su Q Y. 2003. Some issues about disasters in Henan in modern times [J]. Yindu Journal, 4: 55 - 59.]
田沁花, 刘 禹, 蔡秋芳, 等. 2009. 油松树轮记录的过去134年伏牛山5—7月平均最高温度[J]. 地理学报, 64(7): 879 - 887. [Tian Q H, Liu Y, Cai Q F, et al. 2009. The maximum temperature of May—July inferred from tree-ring in Funiu Mountain since 1874 AD [J]. Acta Geographica Sinica, 64(7): 879 - 887.]
徐化成. 1990. 油松[M].北京:中国林业出版社. [Xu H C. 1990. Chinese pine [M]. Beijing: China Forest Industry Press.]
徐 同, 郭品文. 2007. 中国冬季气温对ENSO的非线性响应特征[J]. 气象与减灾研究, 30(4): 9 - 13. [Xu T, Guo P W. 2007. Nonlinear response characteristics of winter temperature to ENSO [J]. Meteorology and Disaster Reduction Research, 30(4): 9 - 13.]
赵振国, 蒋伯仁, 陈国珍, 等. 2000. ENSO事件对中国气候的可能影响[J]. 山东气象, 20(1): 4 - 12. [Zhao Z G, Jiang B R, Chen G Z, et al. 2000. Impact of ENSO event on the climate in China [J]. Journal of Shandong Meteorology, 20(1): 4 - 12.]
Bao G, Liu Y, Linderholm H W. 2012. April-September mean maximum temperature inferred from Hailar pine (Pinus sylvestris var mongolica) tree rings in the Hulunbuir region, Inner Mongolia, back to 1868 AD [J]. Palaeogeography, Palaeoclimatology, Palaeoecology, 313: 162 - 172.
Bräuning A. 2006. Tree-ring evidence of ‘Little Ice Age’glacier advances in southern Tibet [J]. The Holocene, 16: 369 - 380.
Briffa K R, Osborn T J, Schweingruber F H, et al. 2001. Lowfrequency temperature variations from a northern tree ring density network [J]. Journal of Geophysical Research, 106(D3): 2929 - 2941.
Briffa K R, Shishov V V, Melvin T M, et al. 2008. Trends in recent temperature and radial tree growth spanning 2000 years across northwest Eurasia [J]. Philosophical Transactions of the Royal Society of London. Series B, Biological sciences, 363(1501): 2271 - 2284.
Cai Q F, Liu Y, Bao G, et al. 2010. Tree-ring-based May-July mean temperature history for Luliang Mountains, China, since 1836 [J]. Chinese Science Bulletin, 55(26): 3008 - 3014.
Cai Q F, Liu Y, Tian H. 2013. A dendroclimatic reconstruction of May-June mean temperature variation in the Heng Mounatins, north China, since 1767 AD [J]. Quaternary International, 283: 3 - 10.
Chen F, Yuan Y J, Chen F H, et al. 2014. Reconstruction of spring temperature on the southern edge of the Gobi Desert, Asia, reveals recent climatic warming [J]. Palaeogeography, Palaeoclimatology, Palaeoecology, 409: 145 - 152.
Chen Z J, Zhang X L, He, X Y, et al. 2013. Extension of summer (June—August) temperature records for northern Inner Mongolia (1715—2008), China using tree rings [J]. Quaternary International, 283: 21-29.
Cook E R, Briffa K R, Jones P D. 1994. Spatial Regression Methods in Dendroclimatology—a review and comparison of two techniques [J]. International Journal of Climatology, 14(4): 379 - 402.
Cook E R, Buckley B M, D’Arrigo R D, et al. 2000. Warmseason temperatures since 1600 BC reconstructed from Tasmanian tree rings and their relationship to large-scale sea surface temperature anomalies [J]. Climate Dynamics, 16(2 - 3): 79 - 91.
Cook E R, Kairiukstis L A. 1990. Methods of Dendrochronology [M]. Dordrecht: Kluwer Academic Publishers.
Cook E R, Krusic P J, Anchukaitis K J, et al. 2013. Treering reconstructed summer temperature anomalies for temperate East Asia since 800 CE [J]. Climate Dynamics, 41(11 - 12): 2957 - 2972.
Cook E R, Meko D M, Stahle D W, et al. 1999. Drought reconstructions for the continental United States [J]. Journal of Climate, 12(4): 1145 - 1162.
Deslauriers A, Morin H, Begin Y. 2003. Cellular phenology of annual ring formation of Abies balsamea in the Quebec boreal forest (Canada) [J]. Canadian Journal of Forest Research, 33(2): 190 - 200.
Duan J P, Zhang Q B, Lv L X. 2013. Increased variability in cold-season temperature since the 1930s in subtropical China [J]. Journal of Climate, 26(13): 4749 - 4757.
Durbin J, Watson G S. 1950. Testing for Serial Correlation in Least Squares Regression I [J]. Biometrika, 37(3 - 4): 409 - 428.
Easterling D R, Peterson T C. 1995. A new method for detecting and adjusting for undocumented discontinuities in climatological time series [J]. International Journal of Climatology, 15: 369 - 377.
Esper J, Cook E R, Schweingruber F H. 2002. Low-frequency signals in long tree-ring chronologies for reconstructing past temperature variability [J]. Science, 295(5563): 2250 - 2253.
Fang K Y, Gou X H, Chen F H, et al. 2012. Precipitation variability during the past 400 years in the Xiaolong Mountain (central China) inferred from tree rings [J]. Climate Dynamics, 39(7 - 8): 1697 - 1707.
Fritts H C. 1976. Tree Rings and Climate [M]. New York: Academic Press.
Fritts H C. 1991. Reconstructing large-scale climatic patterns from tree-ring data [M]. The University of Arizona Press, Tucson.
Ge Q S, Zheng J Y, Man Z M, et al. 2002. Reconstruction and analysis on the series of winter-half-year temperature changes over the past 2000 years in eastern China [J]. Earth Science Frontiers, 9: 169 - 181.
Gou X H, Peng J F, Chen F H, et al. 2008. A dendrochronological analysis of maximum summer half-year temperature variations over the past 700 years on the northeastern Tibetan Plateau [J]. Theoretical and Applied Climatology, 93(3 - 4): 195 - 206.
Gurskaya M A, Shiyatov S G. 2006. Distribution of frost injuries in the wood of conifers [J]. Russian Journal of Ecology, 37(1): 7 - 12.
Han Y B, Han Y G. 2002. Wavelet analysis of sunspot relative numbers [J]. Chinese Science Bulletin, 47(7): 609 - 612.
Holmes R L. 1983. Computer-assisted quality control in treering dating and measurement [J]. Tree-Ring Bulletin, 43: 69 - 78.
IPCC. 2007. Climate Change 2007: The Physical Science Basis [R]. United Kingdom: Cambridge University Press.
Li Q, Liu Y, Song, H M, et al. 2013. Long-term variation of temperature over North China and its links with large-scale atmospheric circulation [J]. Quaternary International, 283: 11 - 20.
Liang E Y, Shao X M, Qin N S. 2008. Tree-ring based summer temperature reconstruction for the source region of the Yangtze River on the Tibetan Plateau [J]. Global and Planet Change, 61(3 - 4): 313 - 320.
Liu Y, An Z S, Linderholm H W, et al. 2009a. Annual temperatures during the last 2485 years in the mid-eastern Tibetan Plateau inferred from tree rings [J]. Science in China Series D: Earth Sciences, 52(3): 348 - 359.
Liu Y, Cai Q F, Song H M, et al. 2011. Amplitudes, rates, periodicities and causes of temperature variations in the past 2485 years and future trends over the central-eastern Tibetan Plateau [J]. Chinese Science Bulletin, 56(28 - 29): 2986 - 2994.
Liu Y, Linderholm H W, Song H M, et al. 2009b. Temperature variations recorded in Pinus tabulaeformis tree rings from the southern and northern slopes of the central Qinling Mountains, central China [J]. Boreas, 38(2): 285 - 291.
Liu Y, Wang Y C, Li Q, et al. 2014. Tree-ring stable carbon isotope-based May—July temperature reconstruction over Nanwutai, China, for the past century and its record of 20th century warming [J]. Quaternary Science Reviews, 93: 67 - 76.
Liu Y, Wang Y C, Li Q, et al. 2013. Reconstructed May—July mean maximum temperature since 1745 AD based on treering width of Pinus tabulaeformis in Qianshan Mountain, China [J]. Palaeogeography, Palaeoclimatology, Palaeoecology, 388: 145 - 152.
Mann M E, Lees J M. 1996. Robust estimation of background noise and signal detection in climatic time series [J]. Climatic Change, 33(3): 409 - 445.
Mann M E, Zhang Z H, Hughes M K, et al. 2008. Proxybased reconstructions of hemispheric and global surface temperature variations over the past two millennia [J]. PNAS, 105(36): 13252 - 13257.
Melvin T M, Briffa K R. 2008. A signal-free approach to dendroclimatic standardisation [J]. Dendrochronologia, 26(2): 71 - 86.
PAGES 2k Consortium. 2013. Continental-scale temperature variability during the last two millennia [J]. Nature Geoscience, 6(5): 339 - 346.
Pederson N, Cook E R, Jacoby G, et al. 2004. The influence of winter temperatures on the annual radial growth of six northern range margin tree species [J]. Dendrochronologia, 22(1): 7 - 29.
Peterson T C, Easterling D R. 1994. Creation of homogeneous composite ciimatoiogical reference series [J]. International Journal of Climatology, 14: 671 - 679.
Potter K W. 1981. Illustration of a new task for detecting a shift in mean precipitation series [J]. Monthly Weather Review, 109: 2040 - 2045.
Rigozo N R, Nordemann D J R, Echer E, et al. 2002. Solar variability effects studied by tree-ring data wavelet analysis [J]. Advances in Space Research, 29(12): 1985 - 1988.
Shi J F, Cook E R, Li J B, et al. 2013. Unprecedented January—July warming recorded in a 178-year tree-ring width chronology in the Dabie Mountains, southeastern China [J]. Palaeogeography, Palaeoclimatology, Palaeoecology, 381: 92 - 97.
Torrence C, Webste, P J. 1999. Interdecadal changes in the ENSO-monsoon system [J]. Journal of Climate, 12(8): 2679 - 2690.
Wigley T M L, Briffa K R, Jones P D. 1984. On the average value of correlated time series, with applications in dendroclimatology and hydrometeorology [J]. Journal of Climate and Applied Meteorology, 23(2): 201 - 213.
Zhu H F, Shao X M, Yin Z Y, et al. 2011. August temperature variability in the southeastern Tibetan Plateau since AD 1385 inferred from tree rings [J]. Palaeogeography, Palaeoclimatology, Palaeoecology, 305: 84 - 92.
The tree-ring width based seasonal minimum temperature reconstruction at Shiren Mountains, Henan, China since 1850 AD and its record of 20th century warming
LIU Yu1,2,3, ZHANG Yan-hua1,4, CAI Qiu-fang1, SONG Hui-ming1,4, MA Yong-yong1,4, MEI Ruo-chen1,4
(1. State Key Laboratory of Loess and Quaternary Geology, Institute of Earth Environment, Chinese Academy of Sciences, Xi’an 710061, China; 2. Joint Center for Global Change Studies, Beijing 100875, China; 3. School of Human Settlement and Civil Engineering, Xi’an Jiaotong University, Xi’an 710049, China; 4. University of Chinese Academy of Sciences, Beijing 100049, China)
Climate change infl uences agriculture production and corresponding management activities. It is very important to understand climate variation in the vast regions of the Central Plains of China, an important crop production base. Current knowledge of the climate changes that have occurred in the past few hundred years in this region is primarily based on historical documents, and there is a shortage ofevidence from natural archives. Based on a signifi cant correlation between the width of Chinese Pine tree rings and instrumental data obtained at Shiren Mountains (SRM), China, this study formulates a transfer function to reconstruct the mean minimum temperature (MMinT) from the previous December to the current June (Tmin_DJ) for the period of 1850 — 2011. This reconstruction explains 48.8% of the instrumental variance during the calibration period of 1958— 2011. High Tmin_DJintervals occurred during 1892— 1906 and 1995— 2011, and low intervals occurred during 1875— 1890, 1910— 1932 and 1967— 1980. A distinct upward trend in the Tmin_DJseries beginning in the 1910s was apparent, and the distinct warming happened after the 1980s (nine of the top ten years with the highest Tmin_DJvalues occurred after 1998, indicating that 20th century warming signal was captured well by the temperature reconstruction in the SRM region. The positive relationship between tree rings and Tmin_DJindicates that it will benefit plant growth and forest coverage in the SRM region if the warming trend continued. The Tmin_DJreconstruction also matched several other temperature series in China, exhibiting similar warm-cold patterns. The distinct spatial correlation between both observed and reconstructed series and CRU TS 3.21 grid data indicates that our results might represent Tmin_DJchanges on a larger scale. The spatial correlation with sea surface temperature (SST) indicates that observed and reconstructed Tmin_DJtemperatures in the SRM area are closely linked to the SST variability in the West Pacifi c, Indian and North Atlantic Oceans.
Shiren Mountains, China; Pinus tabulaeformis; tree-ring width; mean minimum temperature; reconstruction
LIU Yu, E-mail: liuyu@loess.llqg.ac.cn
P467
A
1674-9901(2015)06-0393-14
10.7515/JEE201506003
Received Date:2015-10-27
Foundation Item:National Natural Science Foundation of China (41171170); Chinese Academy of Sciences (KZZD-EW-04-01); National Basic Research Program of China (2013CB955900); Key Project of the Institute of Earth Environment and Project of State Key Laboratory of Loess and Quaternary Geology (SKLLQG).