月球磁异常区的光学特性探讨*
2015-03-24王晓倩付晓辉李春来
王晓倩,崔 峻,2,李 菡,付晓辉,刘 斌,李春来
(1. 中国科学院月球与深空探测重点实验室 (国家天文台),北京 100012;2. 南京大学,江苏 南京 210093)
CN 53-1189/P ISSN 1672-7673
月球磁异常区的光学特性探讨*
王晓倩1,崔 峻1,2,李 菡1,付晓辉1,刘 斌1,李春来1
(1. 中国科学院月球与深空探测重点实验室 (国家天文台),北京 100012;2. 南京大学,江苏 南京 210093)
月球无全球性磁场,在某些大型撞击坑的对峙区域存在较强的磁场强度。这些磁场异常区域往往与光学异常区域呈地理相关,推断与磁异常诱发的微磁层弱化空间风化效应有关。嫦娥一号卫星携带的干涉成像光谱仪获取了月球表面可见光-近红外波长范围内32个波段的光谱,为研究月球空间风化效应提供了一个可能物理量——月表反射率。通过对几个常见磁异常结构磁场内外区域的平均光谱对比发现,磁场内区域反射率一般高于磁场外区域。这一结果对月球表面空间风化效应的研究产生了新的推动。
空间风化;月球磁异常区域;月球漩涡;微磁层
1 月球表面的空间风化
空间风化是所有暴露在严苛空间环境中的天体表层经历的一系列变化过程的总称,也是太阳系中无大气天体的重要过程[1]。对于月球而言,月球没有大气层,陨石、微陨石、太阳风和宇宙射线等各种粒子可以长驱直入,共同作用于月表,对月球表面的物质成分和化学物理特征造成影响,在一定程度上改变月球表面的性质。这种空间风化作用对月表光学特征的影响主要包括:从可见光到近红外反射率的降低-变暗;矿物吸收特征峰强度减弱;改变光谱斜率,使之变红[2]。模拟实验和月壤样品系统分析的结果表明,不同含量的纳米铁颗粒引起了光谱“变暗”和“变红”的效应。对于月壤中纳米铁的形成机制,目前存在两种认识:一是太阳风离子注入过程中,H+和He2+将月壤中的Fe2+还原成单质铁[3];二是微陨石撞击引起的汽相挥发物,再沉积在月壤表面形成单质铁[4-5]。
迄今为止所有的月球探测结果表明,如今的月球不存在全球性偶极磁场[6],而月球样品存在的剩余磁场特征表明,月球演化的早期可能存在过全球性的偶极磁场。目前通过绕月轨道卫星磁力计测量、月球登陆车携带磁力计的直接测量和返回样品的磁学实验研究这3种观测月球磁场的途径,科学家发现月表具有许多区域性表面剩余磁场,磁场强度比地球低5个数量级,一般仅为nT量级,称之为月表磁异常[7]。阿波罗登月计划中也进行过月表磁场探测的研究[8]。文[9]利用美国勘探者号探测器电子反射仪和磁力计数据对月球1∶100 000比例尺上的磁场特性进行了研究,并绘制了月球磁场分布图;结果表明,月表的最低磁场强度主要集中在月海,强磁场主要集中在大型撞击坑的对峙区域。在此后,包括中国嫦娥二号[10]、日本月亮女神号、印度月船一号[11]在内相继的月球探测中,也对月表磁异常进行了考察。
在这些磁异常区域,空间风化作用又是如何呢?文[12]认为,磁异常诱发形成微磁层,会弱化空间风化效应。原因是微磁层屏蔽了引起空间风化的因素之一——太阳风离子的入射,使得磁异常区域内被还原的纳米单质铁减少,从而一定程度上保持了原有的光学特性。我国首次绕月探测卫星嫦娥一号于2007年10月24日发射,2009年3月1日完成使命撞向月球。其携带的干涉成像光谱仪用于获取月球表面物质成分,可见光近红外32个波段的高分辨率、波长连续的光谱,为确定月表矿物吸收精细光谱位置提供了保障[13]。同时,也为研究月表空间风化效应提供了一个可能的物理量——月表反射率。
本文通过嫦娥一号干涉成像光谱仪数据对月表磁异常的光学特性进行分析,阐述了月表磁异常对空间风化的改造效应,为深入认识磁异常和空间风化的相互关系提供观测依据,进一步增进对月球表面与太阳风相互作用的理解与认识。
2 数据处理
嫦娥一号探月卫星搭载的干涉成像光谱仪用于获取月表元素和矿物信息。它采用基于面阵推扫式的Sagnac干涉型成像光谱仪方案,当卫星高度为200 km时,数据的刈幅为25.6 km,月表地元分辨率为200 m,光谱通道共有32个谱段,谱段范围为480~960 nm[14]。其中一些波段出现了异常或者信噪比很低,如低波段480 nm、488 nm、496 nm、504 nm、513 nm和长波段918 nm、946 nm。这些波段不适宜用于信息提取,甚至会影响正常波段的应用效果,使用时应首先剔除。目前,中国绕月探测工程地面应用系统提供的最高级别成像光谱数据为2C级产品,像元值为月表反射率值,该数据经过了暗电流纠正、平场纠正、辐射亮度转换及光学归一化等预处理,消除了太阳高度角等对光谱的影响,是描述月球表面反射太阳辐射能与入射辐射能之比这一物理性质的重要物理量,数据覆盖了全月球约78%的面积[15]。利用干涉成像光谱仪数据,文[16]作者初步得到了月球表面危海附近的FeO分布图,文[13]作者获得了全月表矿物中心吸收图。
干涉成像光谱仪为验证磁异常区域的光谱特征提供了可能。由于干涉成像光谱仪数据近950 nm谱段的数据质量较差,不适于做近红外光谱比值比较(950 nm/750 nm)来考察空间风化的变红效应。利用干涉成像光谱仪的多波段特性和反射率数据,选取了如表1的4个磁异常结构——格拉西莫维奇、戈达德、哥伦布和赖纳伽马区域,在这些磁异常结构的内外各选取几个临近的小区域,通过随机采样相同数量的点,计算绘制平均光谱考察空间风化是否带来变暗效应。文中所使用的磁场数据来源于美国月球勘探者号磁力计和电子反射仪数据[17]。
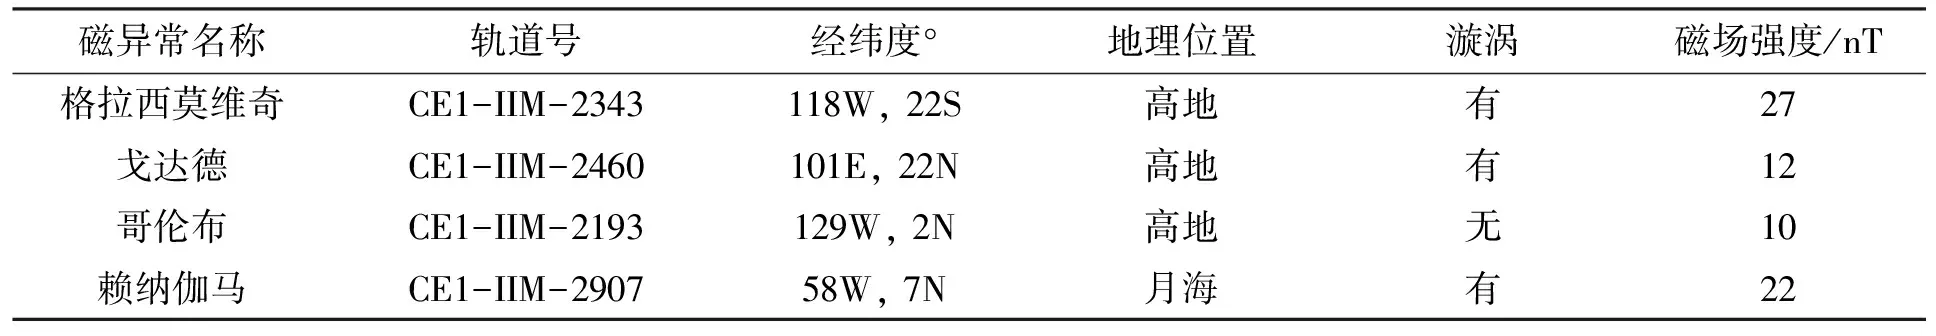
表1 备选磁异常结构
3 典型月球磁异常的光学特性讨论
月球长期处于无大气保护状态,其发生空间风化作用的主要地质营力是微陨石撞击和太阳风离子的注入。太阳风主要通过离子注入和溅射与月表物质发生相互作用;陨石和微陨石撞击导致月表物质破碎、混合,并使其熔融、气化。空间风化会改变月壤的光谱特征,特别是反射率变低(变暗)及随波长增加而增大(变红),其主要原因是纳米铁导致[18],月壤中纳米铁含量与样品全岩的铁含量比值通常用作衡量月壤成熟度的指标[19],空间风化程度越高的月壤,其成熟度也越高。有研究指出纳米铁的形成机制为太阳风中的H+和He2+将撞击熔融矿物中的Fe2+还原为游离铁[20],或太阳风离子溅射和微陨石撞击产生的气相在沉淀过程中,Fe2+被还原成纳米铁。目前还难以区分太阳风离子溅射和微陨石撞击作用在改变月壤反射光谱和形成纳米铁中各自的贡献。考虑到微磁层对太阳风的屏蔽作用,推测微磁层会弱化空间风化的效应,从而磁异常区域的光谱特征得以保护,因而没有周围区域显得变黑及变红。在月球表面存在一种光学异常的现象——月球漩涡,是月球上一种具有高反射率、形态蜿蜒的月表特征,在月海与高地均有分布[21]。探测数据表明,月球漩涡往往和月球磁异常的空间位置存在一定的相关性,有漩涡的地方常会有磁异常存在,相反,月球磁异常的周围未必存在月球漩涡[22]。研究月球漩涡形成的过程与机制,为何与月球磁异常相关有助于理解行星表面与太阳风的相互作用。基于此,本文采用嫦娥一号干涉成像光谱仪数据对月球漩涡及其附近区域的平均反射光谱结合磁异常特征进行比较研究。
3.1 格拉西莫维奇撞击坑
格拉西莫维奇撞击坑位于月球背面的高地,东海的西部。美国月球勘探者号磁场数据探明在此存在磁场较强的磁异常结构,并且是目前月球上发现的磁场强度最强的区域。该磁异常结构在危海的对峙区,有两个较强的磁场峰值,北边的峰值位于(20.5°S, 237°E),南边的峰值位于(23°S, 239°E),30 km高度的磁场值分别为28 nT和23 nT[22]。在磁异常区域内有一个著名的漩涡结构,位于赫维留撞击坑的边缘[23],在图1白色箭头标识处。
利用印度月神一号的亚千电子伏原子反射分析仪(Sub-keV Atom Reflecting Analyzer, SARA)在格拉西莫维奇磁异常区探测的微磁层结果显示:该区域存在跨度约360 km、厚度约300 km的密度增厚的等离子体流[24],应为受磁场屏蔽而堆积的太阳风离子所致。

图1 格拉西莫维奇磁异常区。图1(a)为该区域缩略图,底图使用嫦娥二号CCD立体相机数据叠加嫦娥一号IIM光谱仪数据。图幅以118°W,25°S为中心。由于IIM光谱仪数据覆盖不够全面,在图中呈现栅格状态,并绘制磁场等高线。图中白色箭头指示漩涡所在区域,黑色箭头为撞击坑格拉西莫维奇D撞击坑(CratorGerasimovich D)。右侧为磁场等高线颜色取值表。图1(b)为图1(a)中所选4个小区域的详细图,标注为A、B、C、D
Fig.1 The Gerasimovich lunar magnetic anomaly. The image in (a) is a top view of the relevant region. The image is from the stacking of a CCD image taken by the stereo camera of the Chang’E-2 and an image taken by the IIM spectrometer of the Chang’E-1. The image center is at (118°W, 25°S), and the image is overlaid with contours of magnetic-field strengths. The darker line-like intervals are where IIM data do not cover. The white arrows denote the local magnetic centers and the black arrow denotes the Crator Gerasimovich D. The contour levels for different colors are labelled on the right-hand side of the image. The image in (b) is a mosaic of the zoomed-in displays of the image in (a) for four small regions marked in (a) as A, B, C, and D
本文使用嫦娥一号IIM 2008年5月30日至6月1日途经格拉西莫维奇磁异常区期间的光谱数据进行分析。该磁场有两个磁场峰值,在磁场内选取两个区域B(123.14°W~122.52°W,20.46°S~19.8°S)和C(123.14°W~122.52°W,23.75°S~23.10°S),磁场外选取两个区域A(123.06°W~122.43°W,15.77°S~15.11°S)和D(123.20°W~122.58°W,27.31°S~26.65°S),磁场内区域B和C的磁场较高,特别是B区,约为25~27 nT,磁场外区域A和D磁场值低于8 nT。
在这4个区域随机采样1 000个点,将其光谱值进行累加平均并绘制光谱图(图2)。可以看出,磁场内区域B和区域C的平均光谱要高于磁场外区域A和区域D,显示该磁异常区域内的表面反射率高于非磁异常区。
3.2 戈达德
戈达德是危海对峙区的磁异常区域,临近月球正面的界海,磁场强度最高为12 nT,出现在戈达德A撞击坑附近。该区域内部也存在已确认的月球漩涡,分布在磁场中心附近。文[25]对该地区进行地质学分析后认为该区域的高反射率归因于未被风化的物质,但不能确认究竟由磁场屏蔽还是彗星撞击冲刷作用引起。
图3是戈达德磁异常结构。该磁场结构峰值区域位于(16°N,95°E)。

图2 格拉西莫维奇中所选4个区域的平均光谱图
Fig.2 The average reflectance curves for the four small regions marked in Fig.1(a)
同样选取磁场内区域F(94.14°E~94.78°E, 16.30°N~16.94°N),磁场外区域E(94.14°E~94.78°E, 18.45°N~19.10°N)和G(194.14°E~94.78°E, 14.37°N~15.02°N)。通过采样相同点数对比其平均光谱,结果如图4,显示磁场内区域的平均光谱略高于磁场外区域。

图3 戈达德磁异常区。图3(a)为该区域缩略图,底图使用嫦娥二号CCD立体相机数据叠加嫦娥一号IIM光谱仪数据。图幅以101°E,22°N为中心。磁场等高线情况同图1。图中白色箭头指示漩涡所在区域,黑色箭头为戈达德A撞击坑(Crator Goddard A)。图3(b)为图3(a)中所选3个小区域的详细图,标注为E、F、G
Fig.3 The Goddard lunar magnetic anomaly. The image in (a) is a top view of the relevant region. The image is from the stacking of a CCD image taken by the stereo camera of the Chang’E-2 and an image taken by the IIM spectrometer of the Chang’E-1. The image center is at (101°E, 22°N), and the image is overlaid with contours of magnetic-field strengths. The white arrows denote the local magnetic centers and the black arrow denotes the Crater Goddard A. The image in (b) is a mosaic of the zoomed-in displays of the image in (a) for three small regions marked in (a) as E, F, and G
3.3 哥伦布
哥伦布磁异常区位于月球正面赤道附近的高地,北临丰富海,西临哥伦布撞击坑,是赫茨普龙撞击坑的对峙区。图5显示了哥伦布磁异常区域的情况。>磁场强度最高为10 nT,内部没有明显可辨的漩涡结构。但有东南侧斯蒂文撞击坑的辐射纹通过。图5(b)为所选磁场内外的区域分别为H和I。其中,H(47.92°E~48.66°E, 15.79°S~14.93°S)位于磁场外;I(51.41°E~52.15°E, 15.79°S~14.93°S)位于磁场内,所在位置伸向丰富海深处。
所选区域的平均光谱如图6,磁场内区域平均光谱高于磁场外区域。
3.4 赖纳伽马

图4 戈达德磁异常区中所选3个区域的平均光谱图
Fig.4 The average reflectance curves for the three small regions marked in Fig.3(a)
赖纳伽马磁异常区域位于月球正面风暴洋西部的月海内,磁场强度可达22 nT。没有撞击坑在其对峙区,但与磁场重叠的区域有一个典型的光学异常——赖纳伽马漩涡[26],其具有环状、蜿蜒、高亮,内部有一条暗带的形态,是月球目前唯一形态发展较为成熟的漩涡,已经被广泛地研究[27-33]。

图5 哥伦布磁异常区。图5(a)为该区域缩略图,底图使用嫦娥二号CCD立体相机数据叠加嫦娥一号IIM光谱仪数据。图幅以49°E,12°N为中心。磁场等高线情况同图1,黑色箭头指示哥伦布撞击坑(Crator Colombo)。图5(b)为图5(a)中所选两个小区域的详细图,标注为H、I
Fig.5 The Colombo lunar magnetic anomaly. The image is from the stacking of a CCD image taken by the stereo camera of the Chang’E-2 and an image taken by the IIM spectrometer of the Chang’E-1. The image center is at (49°E, 12°N), and the image is overlaid with contours of magnetic-field strengths. The black arrow denotes the Crater Colombo. The image in (b) is a mosaic of the zoomed-in displays of the image in (a) for two small regions marked in (a) as H and I
文[22]作者提出该区域中心地带的成熟度远低于背景区域,中心地带的平均氧化铁含量为16 wt.%,略低于其南北临近区域的背景值19 wt.%,因此该区域的光学异常更多来源于月壤成熟度差异而非物质成分不同。
采用同样方法绘制了磁场内外的平均光谱,如图8,结果显示磁场内反射率值高于磁场外。
4 结 论
磁异常结构通过磁重连等过程使入射太阳风粒子减速偏转并加热,会在月表附近形成微磁层结构。对于微磁层的存在,文[34]作者通过二维磁流体动力学(Magneto Hydro Dynamics, MHD)模拟太阳风与磁异常结构的相互作用演示了微磁层形成的可能,文[24, 35]作者等分别给出了观测支持。微磁层的屏蔽作用使得诱发空间风化效应的重要成因之一——太阳风离子注入减少,被还原的纳米铁减少,从而使磁场内部的月壤成熟度低于周围背景环境,月表的光谱特征受到干扰,反射率高于未受磁场保护的邻近区域。
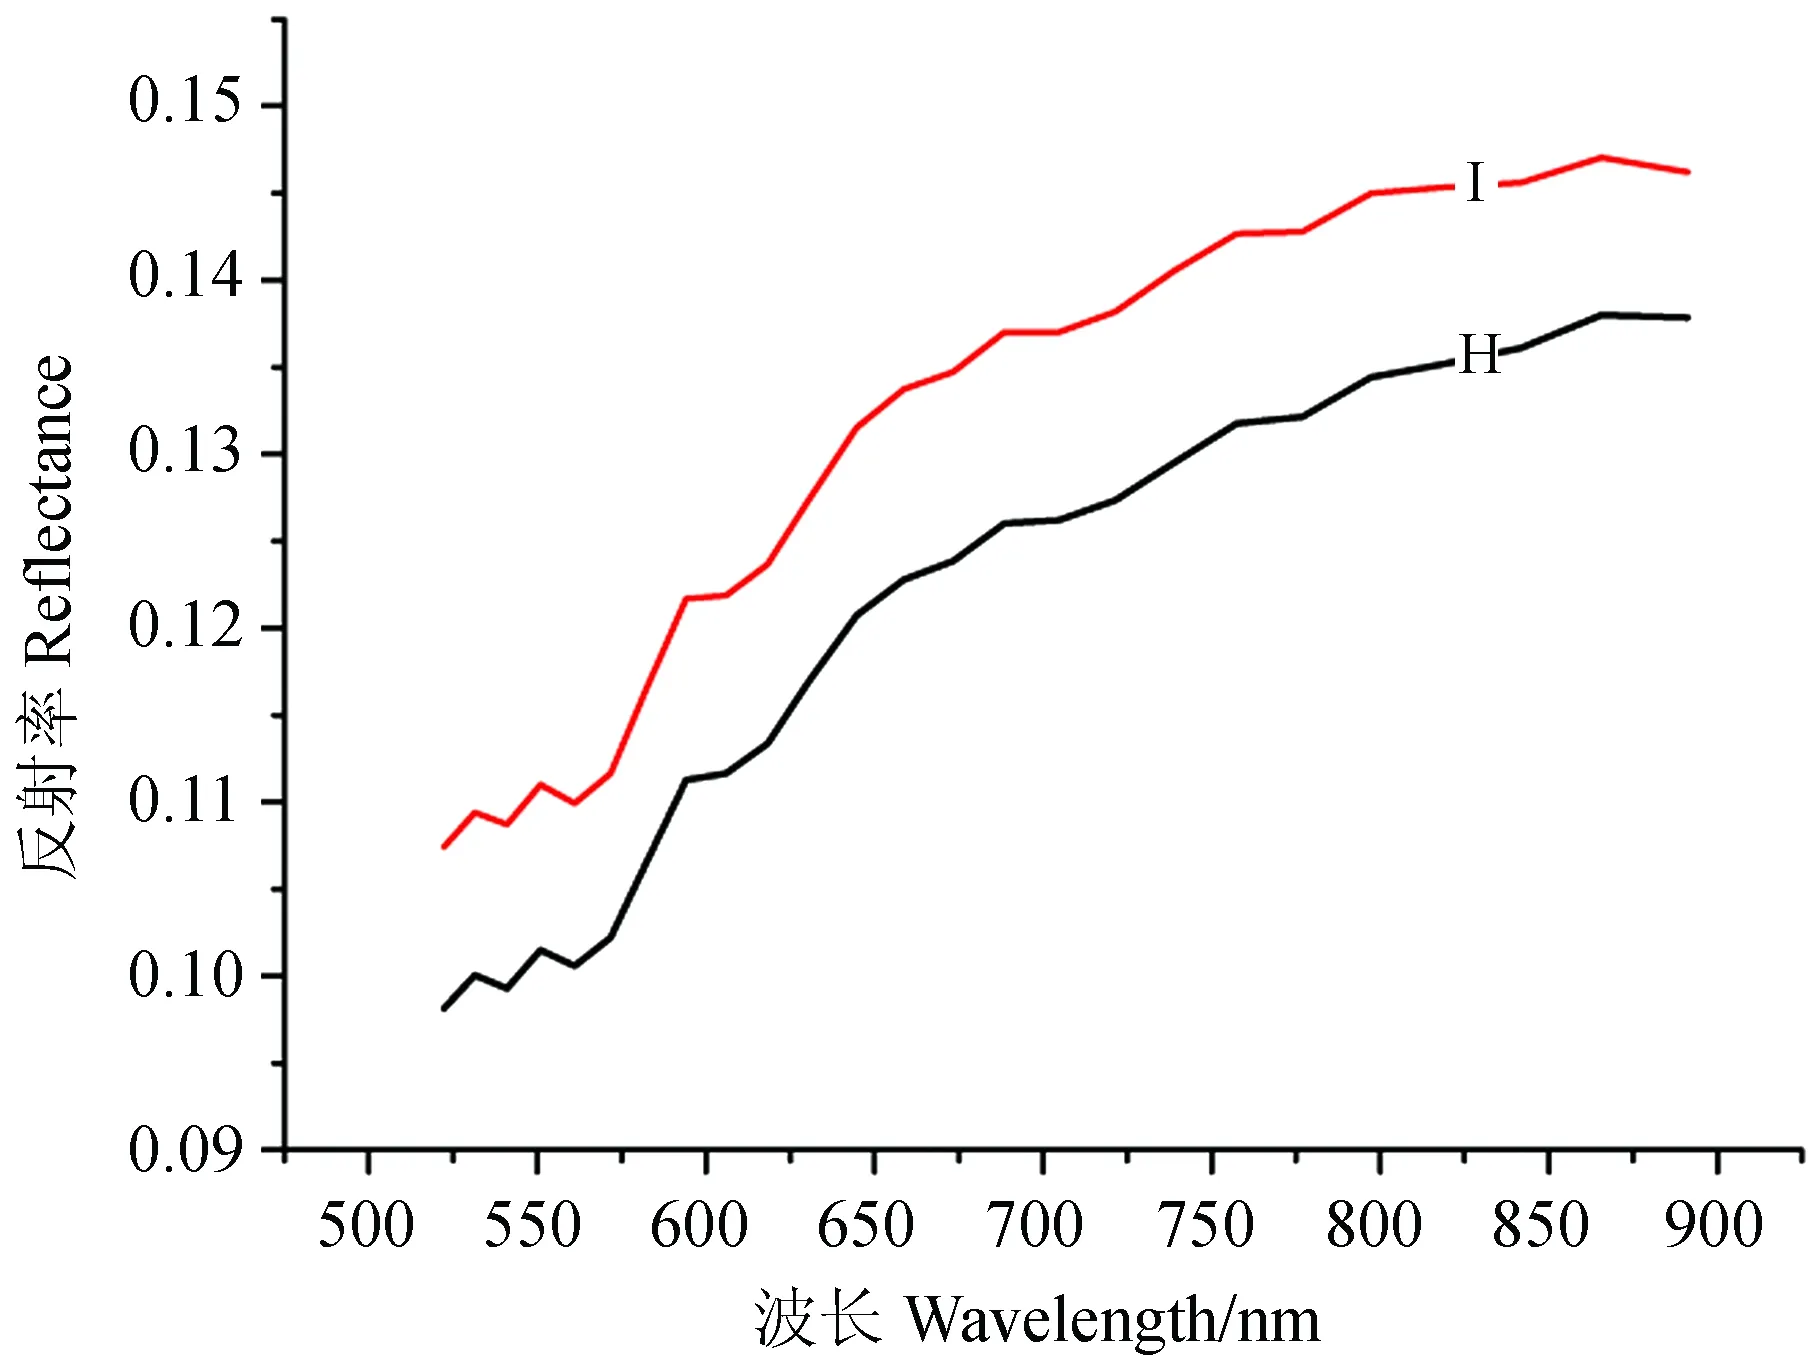
图6 哥伦布磁异常区中所选两个区域的平均光谱图
Fig.6 The average reflectance curves for the two small regions marked in Fig.5(a)

图7 赖纳伽马磁异常区。图7(a)为该区域缩略图,底图使用嫦娥二号CCD立体相机数据叠加嫦娥一号IIM光谱仪数据。图幅以(58°W,8°N)为中心。磁场等高线情况同图1。白色箭头指示漩涡所在,黑色箭头指示赖纳伽马撞击坑(Crator Reiner Gamma)。图7(b)为图7(a)中所选3个小区域的详细图,标注为J、K、L
Fig.7 The Reiner lunar magnetic anomaly. The image is from the stacking of a CCD image taken by the stereo camera of the Chang’E-2 and an image taken by the IIM spectrometer of the Chang’E-1. The image center is at (58°W, 8°N), and the image is overlaid with contours of magnetic-field strengths. The white arrows denote the local magnetic centers and the black arrow denotes the Crater Reiner. The image in (b) is a mosaic of the zoomed-in displays of the image in (a) for three small regions marked in (a) as J, K, and L
本文选取了月球磁场强度较高的4个区域,其中3个磁异常区内存在光学异常——漩涡结构。通过对比其磁场内外的反射率特性,希望提供磁异常结构对空间风化弱化效应的新信息。结果显示,不论在磁异常结构内存在漩涡的区域,如格拉西莫维奇、戈达德和赖纳伽马磁异常区域,还是不存在漩涡的区域,如哥伦布磁异常区,都有一个共同的规律,即磁场内区域的平均反射率值要高于磁场外区域。特别是对于磁场内没有明显光学异常的哥伦布磁异常区,选取的磁场内外两块区域中心相距约70 km,均位于月球正面的高地,东侧毗邻丰富海,从肉眼判断其地形地貌较为接近,难以区分反射率高低。但IIM的平均反射率结果显示,磁场内平均反射率值略高。

图8 赖纳伽马磁异常区中所选3个区域的平均光谱图
Fig.8 The average reflectance curves for the three small regions marked in Fig.7(a)
造成不同区域的光谱特性不同的因素有多种:地形、物质成分、光照条件、磁场等。本文选取磁场内外的区域时,尽量选择地形一致的区域,以减弱不同地形带来的影响;同时,干涉成像光谱仪2C级数据已经过太阳高度角的归一化处理,光照条件已一致;利用文[22]的结论,认为磁场内外的物质成分差异不大;排除以上因素,分析磁场是影响月表光学特性的重要因素之一。正如前文所述,在磁场诱发形成微磁层的影响下,由于入射太阳风离子的减少,和月壤的相互作用减少,被还原的纳米铁减少,月表被空间风化的程度减弱,因此磁场区域的光学特性得以保持。本文利用嫦娥一号干涉成像光谱仪数据给出了观测证实,支持了月表磁异常区的光谱特性和磁场屏蔽作用直接相关的理论推测。
嫦娥一号携带的干涉成像光谱仪在绕月期间共获取了711轨数据,覆盖了月球表面大部分磁异常区域,为全面考察磁异常区域的光谱特性提供了大样本支持。后续工作将基于这些数据继续考察月球不同磁场强度区域内的光谱特性。
[1] Pieters C M, Taylor L A, Noble S K, et al. Space weathering on airless bodies: resolving a mystery with lunar samples[J]. Meteoritics & Planetary Science, 2000, 35(5): 1101-1107.
[2] Pieters C M, Fischer E M, Rode O, et al. Optical effects of space weathering: the role of the finest fraction[J]. Journal of Geophysical Research: Planets, 1993, 98(E11): 20817-20824.
[3] Housley R M, Grant R W, Paton N E. Origin and characteristics of excess Fe metal in lunar glass welded aggregates[C]// Proceedings of the Fourth Lunar Science Conference. 1973: 2737-2749.
[4] Moroz L V, Fisenko A V, Semjonova L F, et al. Optical effects of regolith processes on S-Asteroids as simulated by laser shots on ordinary chondrite and other mafic materials[J]. Icarus, 1996, 122(2): 366-382.
[5] Sasaki S, Nakamura K, Hamabe Y, et al. Production of iron nanoparticles by laser irradiation in a simulation of lunar-like space weathering[J]. Nature, 2001, 410(6828): 555-557.
[6] Russell C T, Coleman Jr P J, Schubert G. Lunar magnetic field: permanent and induced dipole moments[J]. Science, 1974, 186(4166): 825-826.
[7] Lin R P, Mitchell D L, Curtis D W, et al. Lunar surface magnetic fields and their interaction with the Solar Wind: results from Lunar Prospector[J]. Science, 1998, 281(5382): 1480-1484.
[8] 欧阳自远. 我国月球探测的总体科学目标与发展战略[J]. 地球科学进展, 2004, 19(3): 351-358. Ouyang ziyuan. Scientific objectives of Chinese lunar exploration project and development strategy[J]. Advance in Earth Sciences, 2004, 19(3): 351-358.
[9] Halekas J S, Mitchell D L, Lin R P, et al. Mapping of crustal magnetic anomalies on the lunar near side by the Lunar Prospector electron reflectometer[J]. Journal of Geophysical Research: Planets, 2001, 106(E11): 27841-27852.
[10]Wang X Q, Cui J, Wang X D, et al. The Solar Wind interactions with Lunar Magnetic Anomalies: a case study of the Chang’E-2 plasma data near the Serenitatis antipode[J]. Advances in Space Research, 2012, 50(12): 1600-1606.
[11]Futaana Y, Barabash S, Wieser M, et al. Protons in the near-lunar wake observed by the Sub-keV Atom Reflection Analyzer on board Chandrayaan-1[J]. Journal of Geophysical Research: Space Physics, 2010, 115(A10): A10248.
[12]Richmond N C, Hood L L, Mitchell D L, et al. Correlations between magnetic anomalies and surface geology antipodal to lunar impact basins[J]. Journal of Geophysical Research: Planets, 2005, 110(E5): E05011.
[13]Wu Y Z, Zheng Y C, Zou Y L, et al. A preliminary experience in the use of Chang’E-1 IIM data[J]. Planetary and Space Science, 2010, 58(14-15): 1922-1931.
[14]Wu Y Z, Xu X S, Xie Z D, et al. Absolute calibration of the Chang’E-1 IIM camera and its preliminary application[J]. Science in China Series G:Physics, Mechanics and Astronomy, 2009, 52(12): 1842-1848.
[15]Ling Z C, Zhang J, Liu J Z, et al. Preliminary results of TiO2mapping using imaging interferometer data from Chang’E-1[J]. Chinese Science Bulletin, 2011, 56(20): 2082-2087.
[16]Ling Z C, Zhang J, Liu J Z, et al. Preliminary results of FeO mapping using imaging interferometer data from Chang’E-1[J]. Chinese Science Bulletin, 2011, 56(4-5): 376-379.
[17]Purucker M E, Nicholas J B. Global spherical harmonic models of the internal magnetic field of the Moon based on sequential and coestimation approaches[J]. Journal of Geophysical Research: Planets, 2010, 115(E12): E12007.
[18]Keller L P, Wentworth S J, Mckay D S, et al. Space weathering in the fine size fractions of lunar soils: soil maturity effects[C]// Workshop on New Views of the Moon 2: Understanding the Moon Through the Integration of Diverse Datasets.1999: 32-34.
[19]Morris R V. Origins and size distribution of metallic iron particles in the lunar regolith[C]// Lunar and Planetary Science Conference, 11th, Houston, TX, March 17-21, Proceedings. New York: Pergamon Press. 1980: 1697-1712.
[20]Loeffler M J, Dukes C A, Baragiola R A. Irradiation of olivine by 4keV He+: simulation of space weathering by the solar wind[J]. Journal of Geophysical Research: Planets, 2009, 114(E3): E03003.
[21]Blewett D T, Hawke B R, Richmond N C, et al. A magnetic anomaly associated with an albedo feature near Airy crater in the lunar nearside highlands[J]. Geophysical Research letters, 2007, 34(24): 1-5.
[22]Blewett D T, Coman E I, Hawke B R, et al. Lunar swirls: examining crustal magnetic anomalies and space weathering trends[J]. Journal of Geophysical Research: Planets, 2011, 116(E2): E02002.
[23]Scott D H, Diaz J M, Watkins J A. Lunar farside tectonics and volcanism[C]// Lunar Science Conference, 8th, Houston, Tex., March 14-18, 1977, Proceedings. New York: Pergamon Press. 1977: 1119-1130.
[24]Wieser M, Barabash S, Futaana Y, et al. First observation of a mini-magnetosphere above a lunar magnetic anomaly using energetic neutral atoms[J]. Geophysical Research Letters, 2010, 37(5): L05103.
[25]Gillis J J, Spudis P D. Geology of the Smythii and Marginis region of the Moon: using integrated remotely sensed data[J]. Journal of Geophysical Research: Planets, 2000, 105(E2): 4217-4233.
[26]McCauley J F. The nature of the lunar surface as determined by systematic geologic mapping[J]. Mantles of the Earth and Terrestrial Planets, 1967: 431-460.
[27]Bell J F, Hawke B R. The Reiner Gamma Formation-composition and origin as derived from remote sensing observations[C]// Lunar and Planetary Science Conference, 12th, Houston, TX, March 16-20, Proceedings. New York and Oxford: Pergamon Press. 1982: 679-694.
[28]Bell J F, Hawke B R. Recent comet impacts on the moon: the evidence from remote-sensing studies[J]. Publications of the Astronomical Society of the Pacific, 1987, 99: 862-867.
[29]Hood L L, Williams C R. The lunar swirls-distribution and possible origins[C]// Lunar and Planetary Science Conference, 19th, Houston, TX, Mar. 14-18, 1988, Proceedings. Lunar and Planetary Institute: Cambridge University Press. 1989: 99-113.
[30]Hood L L, Schubert G. Lunar magnetic anomalies and surface optical properties[J]. Science, 1980, 208(4439): 49-51.
[31]Pinet P C, Shevchenko V V, Chevrel S D, et al. Local and regional lunar regolith characteristics at Reiner Gamma Formation: optical and spectroscopic properties from Clementine and Earth-based data[J]. Journal of Geophysical Research: Planets, 2000, 105(E4): 9457-9475.
[32]Shkuratov Y, Opanasenko N, Opanasenko A, et al. Polarimetric mapping of the Moon at a phase angle near the polarization minimum[J]. Icarus, 2008, 198(1): 1-6.
[33]Starukhina L V, Shkuratov Y G. Swirls on the Moon and Mercury: meteoroid swarm encounters as a formation mechanism[J]. Icarus, 2004, 167(1): 136-147.
[34]Harnett E M, Winglee R. Two-dimensional MHD simulation of the solar wind interaction with magnetic field anomalies on the surface of the Moon[J]. Journal of Geophysical Research: Space Physics, 2000, 105(A11): 24997-25007.
[35]Halekas J S, Delory G T, Brain D A, et al. Density cavity observed over a strong lunar crustal magnetic anomaly in the solar wind: A mini-magnetosphere?[J]. Planetary and Space Science, 2008, 56(7): 941-946.
A Study of Reflectance Characteristics in Regionsof Several Lunar Magnetic Anomalies
Wang Xiaoqian1, Cui Jun1,2, Li Han1, Fu Xiaohui1, Liu Bin1, Li Chunlai1
(1. Key Laboratory of Lunar and Deep-Space Exploration, National Astronomical Observatories, Chinese Academy of Sciences,Beijing 100012, China, Email: wangxq@bao.ac.cn; 2 Nanjing Univesity, Nanjing 210093, China)
The Moon does not have a global magnetic-field pattern. However, at anitpodes of some large lunar craters there are magnetic fields of high strengths. The lunar magnetic anomalies are also regions of unusual lunar albedo features, which has been hypothesized to be due to the local weakening of space weathering by mini-magnetospheres induced by magnetic anomalies. The Interference Imaging Spectrometer (IIM) onboard the Chang’E-1 lunar exploration spacecraft obtained optical spectra of various parts of the lunar surface in 32 bandpasses covering visible to near-infrared wavelengths. The IIM data allow us to study effects of lunar space weathering through local reflectance curves of the lunar surface. By comparing average reflectance curves within regions of four selected magnetic anomalies to those in their close vicinities (outside the magnetic anomalies), we have found that the reflectance values within the regions of magnetic anomalies are consistently larger than in the vicinities. Considering that mini-magnetospheres shield the regions within the anomalies against space winds, our result supports the hypothesis that lunar mini-magnetospheres reduce influences of space weathering. Our study could provide new insights into effects of space weathering on the lunar surface.
Space weathering; Lunar magnetic anomalies; Lunar local magnetic centers; Mini-magnetosphere
国家自然科学基金 (41304021) 资助.
2014-03-21;修定日期:2014-04-01 作者简介:王晓倩,女,硕士. 研究方向:行星科学. Email: wangxq@bao.ac.cn
P184.5+3
A
1672-7673(2015)02-0219-09
