2009—2011年我国西南地区旱灾程度及其对植被净初级生产力的影响
2015-03-10赵志平吴晓莆李俊生
赵志平,吴晓莆,李 果,李俊生
中国环境科学研究院, 北京 100012
2009—2011年我国西南地区旱灾程度及其对植被净初级生产力的影响
赵志平,吴晓莆,李 果,李俊生*
中国环境科学研究院, 北京 100012
2009—2011年,我国西南地区遭受了极端干旱气候影响。利用1980—2011年气象站点观测数据和基于光能利用率的植被净初级生产力估算模型GloPEM,研究了2009—2011年西南地区干旱灾害过程和程度及其对植被净初级生产力的影响,结果显示:2009—2011年西南地区年均降水量和湿润指数明显低于1980—2008年均值。受干旱气候影响,研究区植被净初级生产力比2001—2011年均值低12.55 gC m-2a-1,总计低0.017 PgC/a,造成的碳损失约占我国总碳汇的7.91%。2001—2011年西南地区植被净初级生产力与蒸散量变化显著相关(R2= 0.44,P< 0.05),而降水量和湿润指数变化过程与植被净初级生产力和蒸散量不同步,可能是由于该地区森林覆盖率较高,具有较强的涵养水源功能,导致土壤湿度变化滞后于降水量和湿润指数变化,从而使降水量变化过程与植被净初级生产力变化不同步。
西南干旱;湿润指数;净初级生产力;GloPEM模型
干旱是一种表现为降水减少、偏离正常状况并持续一段时间的灾害性天气现象[1- 2],分为天气干旱、土壤干旱和生理干旱。这3种干旱都会对生态系统结构和功能产生不同程度的影响[3]。近年来,受全球气候变化的影响,我国干旱等极端气候出现的频率明显增加[4]。严重的干旱会导致农业生产无法正常进行[5]、植被生产力急剧下降[6- 8]、河流断流、湖泊干涸[9],使区域生态环境进一步退化。
2009年秋季以来,我国西南地区遭受了极端干旱气候影响,降水量自2009年8月以来较多年同期偏少50%以上,气温也较常年同期偏高[10],受影响区域包括云南、广西、贵州、四川和重庆5省(直辖市、自治区)。干旱已造成较大的粮食减产、经济林和天然植被大面积枯死[11]。西南地区是我国重要的生态屏障区,也是全球生物多样性保护的热点地区[12]。该地区拥有干热河谷、溶岩地貌等复杂地理环境下孕育的多种脆弱生态系统类型[13- 16]。极端干旱事件将改变区域水、热条件,影响农、林、草等植被生长,进而影响生态系统结构和功能,威胁区域生态系统安全[17]。因此,科学评估干旱程度及其导致的生态影响,对进一步避免和预防干旱造成的损失具有重要意义。
有关西南地区干旱灾害特征及其影响,目前已有一些研究,如李强子等[18]利用遥感技术对2010年春季西南地区干旱灾害影响程度进行了监测与评估,杞金华[19]以哀牢山森林生态系统为例,研究了常绿阔叶林水源涵养功能及其在应对西南干旱中的作用,穆兴民等[20]则分析了人类活动对干旱灾害程度的影响,并认为生态系统水源涵养功能较差、矿产开发破坏地质水文环境、水利设施功能减退等加剧了旱情;其它有关的干旱灾害影响评估研究则主要是利用MODIS遥感数据分析2009年秋至2010年春西南地区旱灾对地表植被覆盖影响的时空变化特征[17,21- 22]。有关西南地区干旱状况和程度的时空过程及其对植被净初级生产力的影响尚未见相关报道。
本研究利用1980—2011年气象站点观测数据和基于光能利用率的NPP (Net Primary Productivity)估算模型GloPEM,通过与研究区历史状况进行对比,揭示2009—2011年西南地区干旱灾害过程和程度,及其对植被净初级生产力的影响。
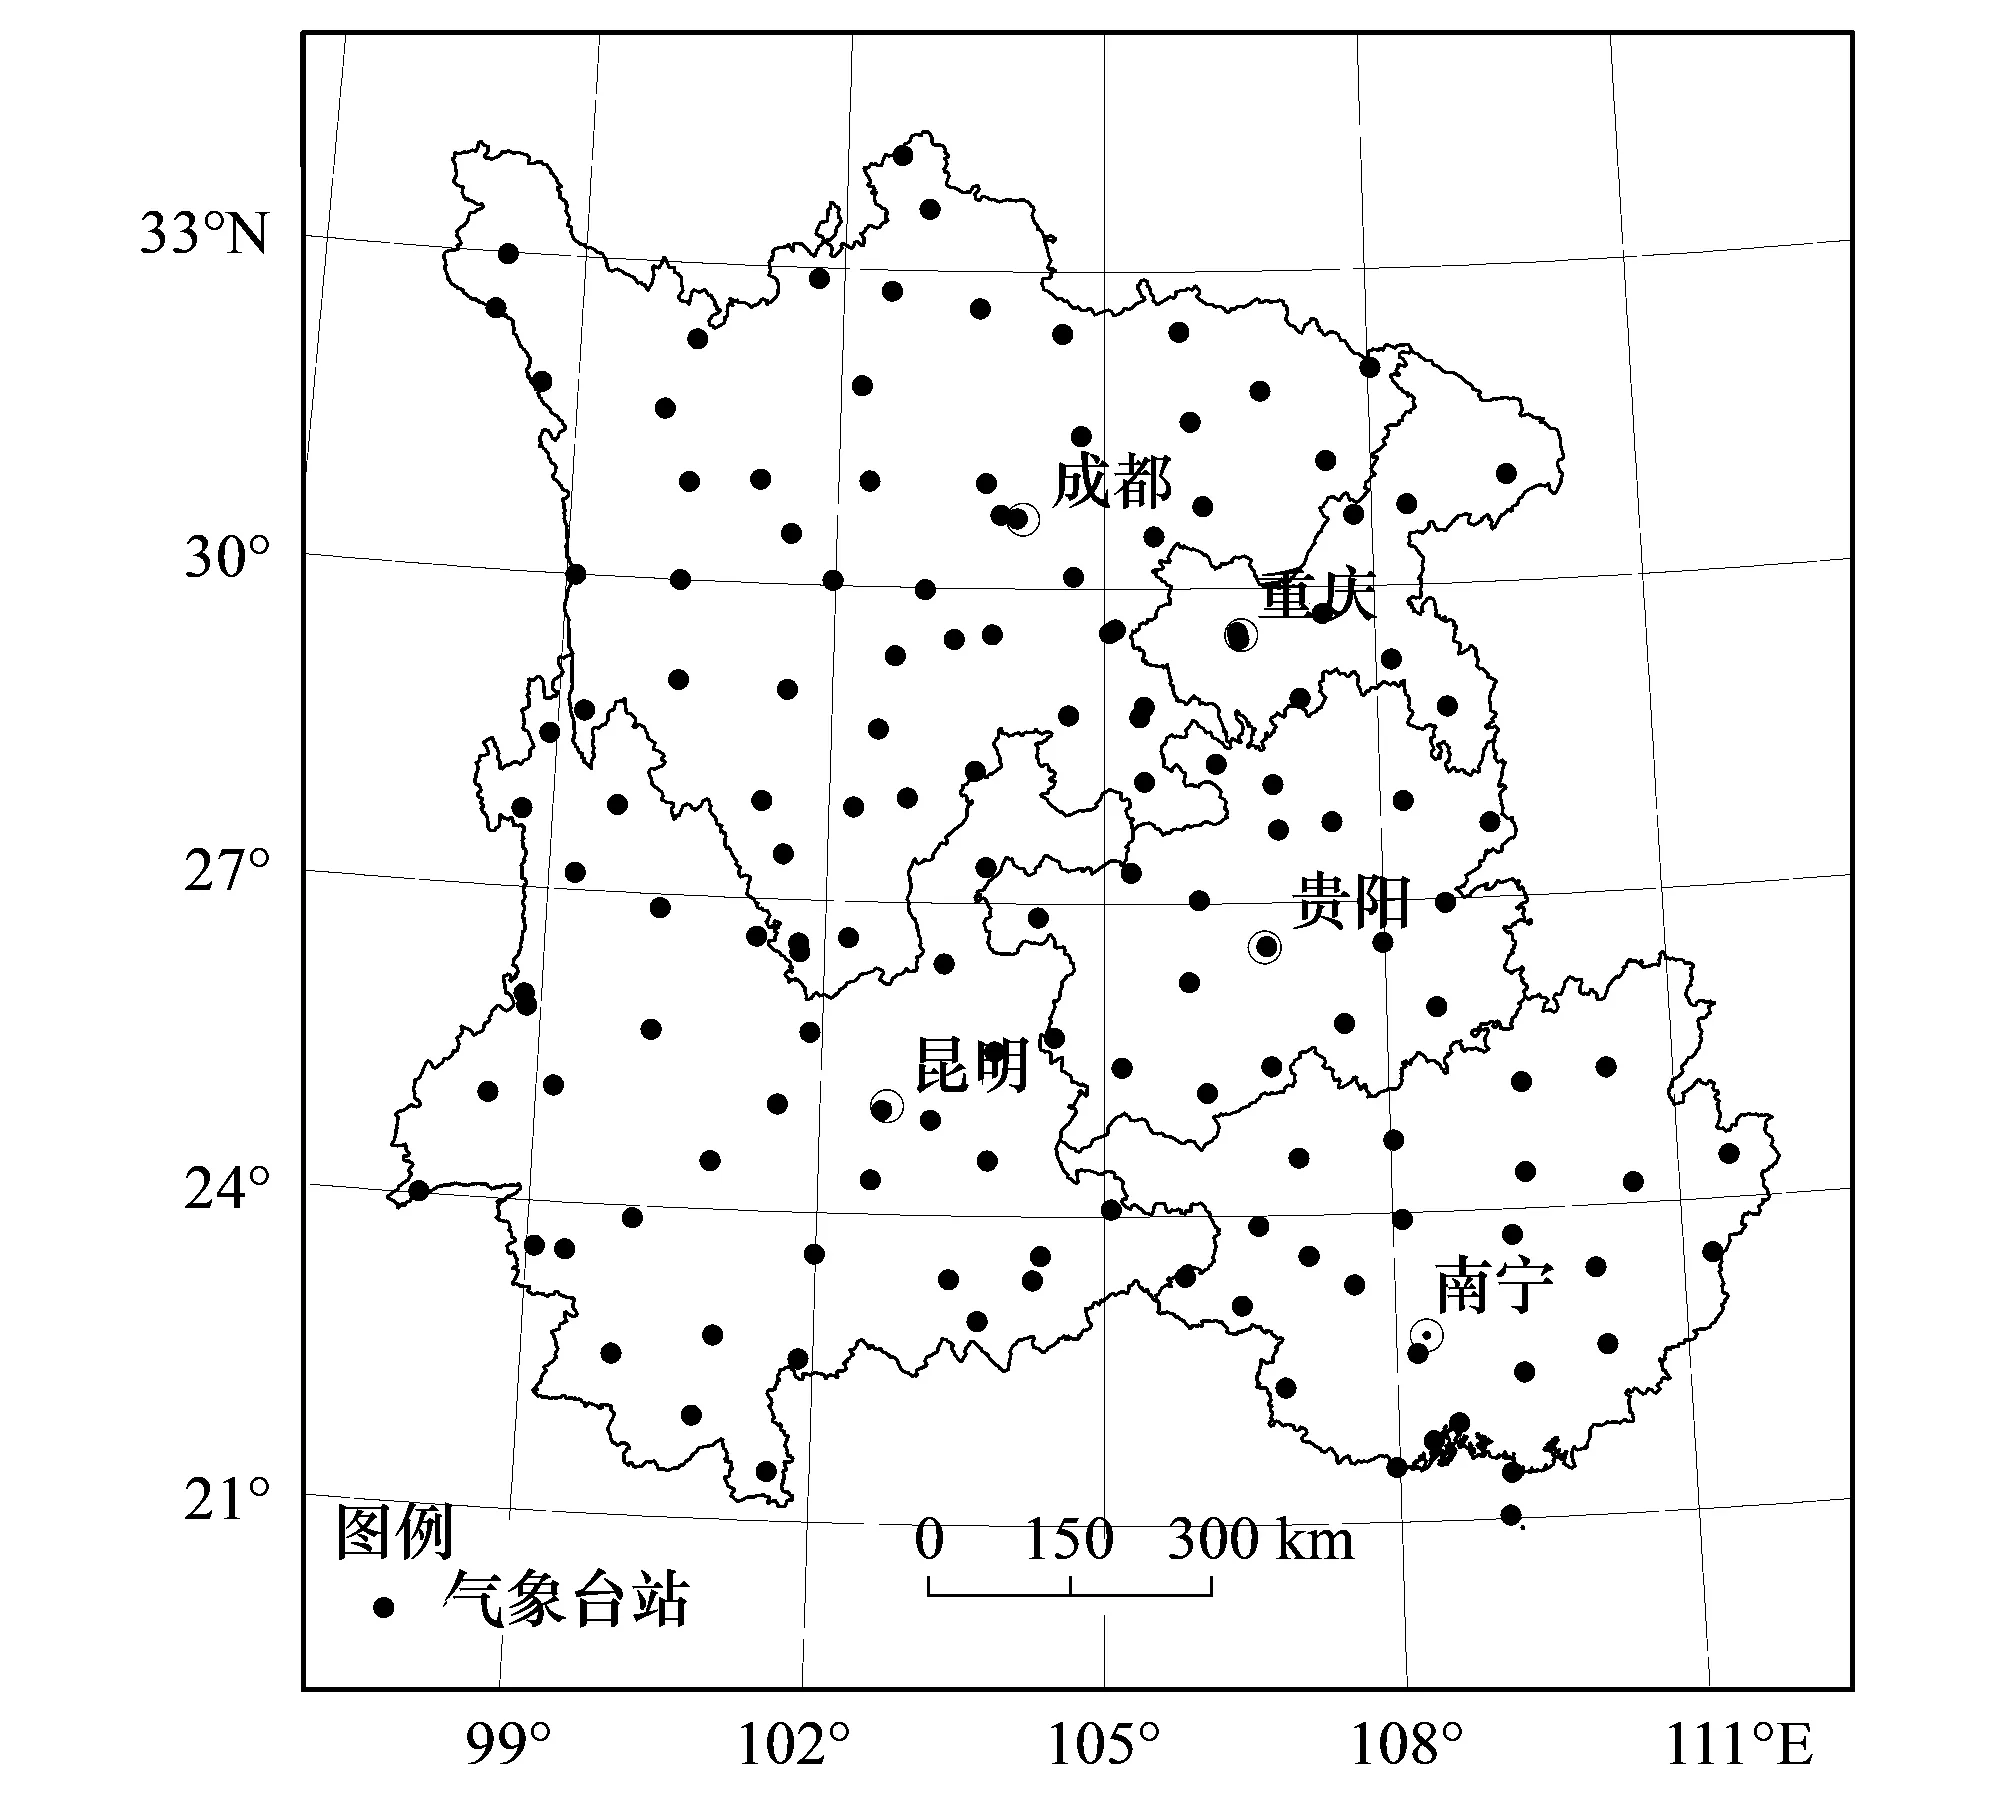
图1 研究区位置及气象站点分布示意图 Fig.1 Location and meteorological observatory distribution of research area
1 研究区概况
研究区域包括贵州省、云南省、广西壮族自治区、四川省和重庆市5省(市、自治区)(图1),西部属青藏高原边缘地带,云贵高原属于我国第2阶梯,广西和四川盆地属于3三阶梯,地理上介于东经96°21′—112°04′、北纬20°54′—34°19′之间,总面积136.40×10⁴km2,占全国总面积的14.20%[11]。该区以亚热带季风气候和热带季雨林气候为主,水热条件良好,适合生物生长发育,是我国生物种类和生态系统类型最为丰富的地区之一,中国44%的树种和北半球主要生态系统类型均分布在该区域[23]。
2 数据和方法
2.1 数据
本研究中的气象数据来源于中国气象局气象科学数据共享服务网中1980—2011年西南地区141个气象站点的观测数据(http://cdc.cma.gov.cn),包括日平均温度、日最高温度、日最低温度、风速、相对湿度、降水和日照时数等。经计算得到各气象站点1980—2011年间每16d总辐射、月降水、年降水、年潜在蒸散和湿润指数后,利用ANUSPLIN软件插值生成1 km分辨率空间栅格数据[24- 26]。本研究采用基于光能利用率的GloPEM模型估算植被NPP,其中植被吸收的光合有效辐射比率(FPAR)是模型的重要参数,其结果直接影响模型的精度。MODIS产品始于2000年第49天,用于计算该参数的MODIS NDVI产品自2001年以来数据序列完整,因此本研究模拟的植被NPP时间跨度为2001—2011年。
2.2 方法
2.2.1 湿润指数
潜在蒸散值(ET0)计算是利用联合国粮农组织(FAO)1998年对Penman-Monteith的修订模型[27- 30],计算公式为:
式中,Rn为净辐射(MJ m-2d-1),G为土壤通量(MJ m-2d-1),γ为干湿常数(kPa/℃),Δ为饱和水气压曲线斜率(kPa/℃),U2为2m高处的风速(m/s),ea为实际水汽压(kPa),es为平均饱和水汽压(kPa)。
土壤热通量
Gmonth=0.14(Tmonth,i-Tmonth,i-1)
其中Tmonth,i为第i月的平均气温(℃),Tmonth, i-1为第i-1月的平均气温(℃)。
2m高处的风速U2=0.75U10,其中U10为观测到的10m风速。
大气压强
式中,h为海拔高度(m)。
干湿常数
γ=CpP/ελ
其中,Cp为空气比热容1.013×10⁻³(MJ kg-1℃-1),ε为水汽分子量与干空气的分子量之比,其值为0.622,蒸发潜热λ=2.501-0.002361T。
平均温度
Tmean=(Tmax+Tmin)/2
饱和水汽压
eo(T)=0.6108exp[17.27T/(T+237.3)]
饱和水气压曲线斜率
Δ=4098eo(Tmean)/(Tmean+237.3)2
平均饱和水汽压
es=[eo(Tmax)+eo(Tmin)]/2
实际水汽压
ea=RHmeanes/100
净辐射Rn的计算公式如下:
式中,σ为Stefan-Boltzmann常数(4.903×10⁻⁹MJ K-4m-2d-1),Tmax,k、Tmin,k分别为绝对温标的最高和最低气温,n为实际日照时数,N为可照时数,Rso为晴天辐射,Rso=(0.75+2×10⁻⁵h)Ra,可照时数N=24ωs/π,天文辐射Ra由太阳常数Gsc(0.082MJ/m2min)、日地相对距离dr、太阳日落角ωs(rad)、纬度φ(rad)、太阳赤纬δ(rad)和天数J计算:

在计算潜在蒸散的基础上,可用湿润指数来划分气候的湿润程度,并采用下列计算湿润指数(Im)的公式来定量表示区域湿润程度[31]:
式中,P为年降水量(mm/a),ET0为年潜在蒸散(mm/a)。
2.2.2 植被净初级生产力模拟
GloPEM是一个基于光能利用率的NPP估算模型,由冠层辐射吸收、利用、自养呼吸以及环境限制因子等几个相互联系的部分组成[32- 34]。GloPEM模型中NPP可以表示为
NPP=PAR×FPAR×ε-Ra
式中,PAR为光合有效辐射,根据气候学辐射计算方法估算[28]。本研究利用西南地区141个气象站点观测数据运用ANUSPLIN软件插值成1km栅格数据来计算PAR。FPAR是植被吸收的光合有效辐射比率,采用下式计算[35]。
FPAR=α×EVI
式中,ε是现实光能利用率,Ra是植被自养呼吸(包括维持性呼吸Rm和生长性呼吸Rg)。
其中现实光能利用率的计算公式如下:
ε=ε*×σT×σE×σS
式中,ε*为植被潜在光能利用率;T为空气温度对植被生长的影响系数[36];E为大气水汽对植物生长的影响系数[37];S为植被和土壤水分缺失对植物生长的影响系数[38- 39]。
空气温度对植被生长的影响系数σT按下式计算:
式中,T为空气温度,Tmin,Topt和Tmax分别为光合作用的最低,最优和最高温度。在模型中C3植物的最高和最低温度分别为50℃和-1℃,C4植物的最高和最低温度分别为50℃和0℃,最适温度被定义为生长季多年平均温度。大气水汽对植物生长的影响系数E按下式计算:
σE=1-0.05δq0<δq≤15
σE=0.25δq>15
δq=Qw(T)-q
式中,Qw(T)是在指定温度条件下的饱和湿度,q为当前大气下湿度。
式中,ρnir和ρswir为近红外和短波红外波段的反射率,LSWImax是该区域生长季最大的LSWI。
本研究中将植物的自养呼吸Ra区分为维持性呼吸Rm和生长性呼Rg[40]。
式中,i表示不同的植物器官,i=1、2、3分别为叶、茎、根。维持性呼吸Rm和温度相关:
Mi=VGC×ra,i×(1-1/Turnover)
式中,Mi为植物的第i器官的生物量,可由碳分配系数(ra,i)及碳周转比率(Turnoveri)得到,分配系数及碳周转比率由BGC模型获得[41],VGC是植被碳库。γ是植物器官i的维持性呼吸系数;Q10是温度影响因子,Tb是积温。
植物的生长性呼吸(Rg)一般认为和温度无关,而只与总初级生产力(GPP)成比例关系,分植被器官(叶、茎、根)给定维持性呼吸系数:
Rg=rg×GPP
式中,rg为植物总的生长性呼吸占总生长量的比例,本文采用Chen的研究结果[42]取值0.35。
3 结果
3.1 降水量时空变化特征
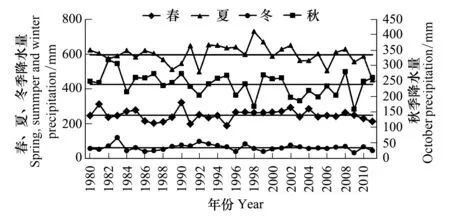
图2 1980—2011西南地区季节降水量变化 Fig.2 Seasonal precipitation variations in southwestern China from 1980 to 2011
利用ArcGIS软件统计区域降水量均值,结果显示1980—2011年西南地区年均降水量为1147 mm,2009年年降水量为992 mm,相对多年均值减少156mm,其中夏、秋、冬三季降水量低于多年均值(图2)。2010年年降水量为1128 mm,相对多年均值减少19 mm,其中春、夏季略低于多年均值,秋、冬季略高于多年均值。2011年年降水量为967 mm,相对多年均值减少180 mm,为近32年来最低值,其中春、夏、冬三季低于多年均值,秋季略高于多年均值。
2009年云南、贵州和广西地区降水量较多年均值(1980—2008年)减少幅度较大(图3),大部分地区减少幅度达200—300 mm,部分地区在300 mm以上,四川南部、成都平原地区降水量减少幅度为100—200 mm,局部地区达200—300 mm;2010年贵州大部分地区年降水量较多年均值减少0—100 mm,云南省大部分地区年降水量减少100—200 mm,而四川、重庆和广西局部地区年降水量则有所增加;2011年西南地区干旱程度和范围有所增加,除四川和重庆北部地区外,大部分地区年降水量均较多年均值减少。
3.2 湿润指数时空变化特征
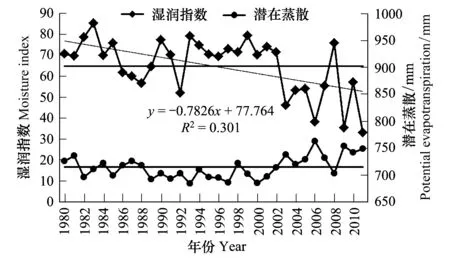
图4 西南地区1980—2011年潜在蒸散和湿润指数变化 Fig.4 Potential evapotranspiration and Moisture index variations in southwestern China from 1980 to 2011
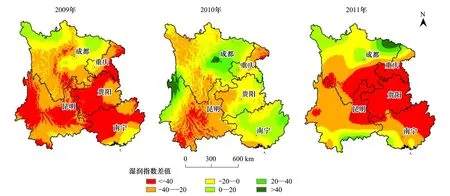
图5 2009—2011年西南地区湿润指数相对于1980—2008年均值的差值Fig.5 Moisture index of southwestern China from 2009 to 2011 different from the average of 1980 to 2011
1980—2011年西南地区均值为65,近32年来该地区湿润指数呈极显著下降趋势(P< 0.01),年均下降0.78(图4)。2009—2011年年均湿润指数则分别为36、 57和33,均低于近32年均值。2009—2011年西南地区潜在蒸散值分别为754、742和749 mm,均高于近32年均值。
图5显示,2009年西南大部分地区湿润指数均低于多年均值(1980—2008年),其中云南、贵州和广西部分地区湿润指数比多年均值的差值低40以上,此3个区域的干旱程度较为严重;2010年西南地区湿润指数总体回升,大部分地区比多年均值低0—20,但云南大部分地区低20—40,局部低40以上;2011年西南大部分地区湿润指数比多年均值低40以上,部分地区低20—40。
3.3 干旱对植被净初级生产力的影响
2001—2011年西南地区植被净初级生产力均值为540.33 gC m-2a-1(图6)。2009年该地区植被净初级生产力比近11年均值(2001—2011年)高13.69 gC m-2a-1,2010年该地区植被净初级生产力比近11年均值低35.36 gC m-2a-1,2011年该地区植被净初级生产力比近11年均值低16.00 gC m-2a-1。因此,2009—2011年干旱期间西南地区植被净初级生产力与年降水量和湿润指数变化过程并不同步。总体上2009—2011年干旱发生期间,西南地区植被净初级生产力比近11年均值低12.55 gC m-2a-1,累积生物量低0.051 PgC,其中2010年生物量低0.048 PgC。

图6 西南地区2001—2011年植被净初级生产力变化Fig.6 Net primary productivity variations in southwestern China from 2001 to 2011
2009年四川省和重庆市大部分地区NPP比近11年均值(2001—2011年)低(图7);云南省、广西壮族自治区和贵州省大部分地区NPP比近11年均值高,只有部分地区NPP低于近11年均值。2010年西南大部分地区NPP比近11年均值低,只有四川北部、云南西南部、广西南部和西南地区中部地区NPP比近11年均值高。2011年西南地区NPP比2010年高,其中四川省和重庆市NPP明显上升。

图7 2009—2011年西南地区植被净初级生产力相对于2001—2011年均值的差值Fig.7 Net primary productivity of southwestern China from 2009 to 2011 different from the average of 2001—2011
4 讨论
基于光能利用率的NPP估算模型,总辐射是模型的重要参数,其模拟结果直接影响模型的精度。2001—2011年西南地区共有17个数据序列完整的辐射观测站点,本研究总辐射模拟结果与之进行对比,结果显示模拟年总辐射与观测结果具有极显著相关关系(P< 0.01)(图8),表明本研究总辐射估算方案可行。本研究模拟的NPP与实测结果[43]进行对比,结果显示模拟NPP与实测结果具有极显著相关关系(P< 0.01)(图9),表明本研究利用GloPEM模型模拟的NPP结果是合理的。
统计年鉴结果[44- 46]显示(图10),2010年西南地区农业旱灾受灾面积和成灾面积均最大,分别是2009和2011年的1.93、3.13倍和1.39、1.75倍。蒸散量是衡量植被生命旺盛程度的指标之一。MODIS蒸散量产品[47]分析结果显示,干旱期间研究区2009年蒸散量最大,其次为2011年,2010年蒸散量最小,本研究模拟的研究区NPP变化过程与之同步,相关分析显示本研究2001—2011年NPP模拟结果与MODIS蒸散量产品具有显著相关性(P< 0.05)(图11)。因此本研究NPP模拟结果基本能够反映2009—2011年西南地区NPP变化特征以及极端干旱气候对其影响。

图8 模拟年总辐射与观测值对比结果 Fig.8 Total radiation comparison between simulation and observed value
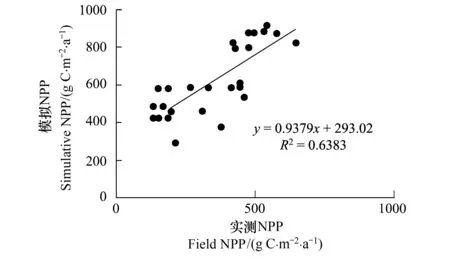
图9 本研究模拟NPP与实测NPP对比结果Fig.9 NPP comparison between simulation and field value
干旱灾害会影响植被生产力,导致植被碳汇功能降低[48]。Ciais[49]发现2003年干旱天气导致欧洲植被总初级生产力降低30%;Phillips等人[50]的研究则表明2005年极端干旱天气使亚马逊热带雨林失去了1.2—1.5 PgC,该区当年由碳汇转变为碳源。本次研究发现2009—2011年干旱期间西南地区植被NPP较近11年均值低0.017 PgC/a,朴世龙[51]认为我国碳汇大小在0.19—0.24 PgC/a之间,按此值计算,由于2009—2011年西南地区极端干旱导致的该地区碳汇大量损失,其损失量约占我国总碳汇的7.91%,其中2010年碳汇损失22.33%。
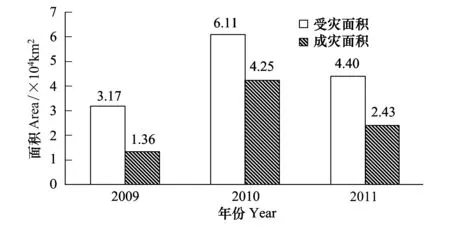
图10 2009—2011西南地区年农业旱灾受灾和成灾面积统计Fig.10 Statistical result of areas covered and affected by drought from 2009 to 2011

图11 本研究模拟NPP与MODIS 蒸散量相关分析Fig.11 Correlation analysis of simulated NPP and MODIS evapotranspiration
Pasho等[52]研究干旱对森林植被生长的影响发现,干旱地区的森林生长与气候干旱指数变化一致,而湿润地区的森林生长受干旱影响时间较短,这可能与湿润地区的森林生态系统自身具有较高的涵养水源功能以减缓气候干旱影响有关。在西南地区,杞金华[21]研究了哀牢山常绿阔叶林水源涵养功能及其在应对西南干旱中的作用,并证实了常绿阔叶林主要树种自干旱发生后至2010年初并未遭受水分胁迫,其充足的地下水和土壤水储存使得常绿阔叶林中的树木在百年一遇的干旱中依然有足够的水分供应。本次研究也发现在干旱气候胁迫下,西南地区NPP(图6)和蒸散量与降水量和湿润指数变化(图4)并不同步,即NPP和蒸散量最低值出现在降水量(图12)和湿润指数最高的2010年,而不是降水量和湿润指数较低的2009年和最低的2011年。NPP和蒸散量与土壤湿度关系紧密[7],本研究获取了AMSR-E地表土壤2cm湿度数据(2002年第170天至2011年第270天),经过处理得到2009—2011年研究区土壤湿度与多年均值差(图12),并与月降水量结果进行对比发现干旱发生期间二者变化并不同步,相关分析显示二者没有显著相关关系。同时把2009—2011年每16d NPP模拟结果和土壤湿度与多年均值差进行相关分析,发现二者具有极显著相关关系(P< 0.001)(图13),因此我们可以判定西南地区干旱发生期间,该地区森林覆盖率较高,具有较强的涵养水源功能,可能导致土壤湿度变化滞后于降水量和湿润指数变化,从而使降水量变化过程与NPP变化不同步。
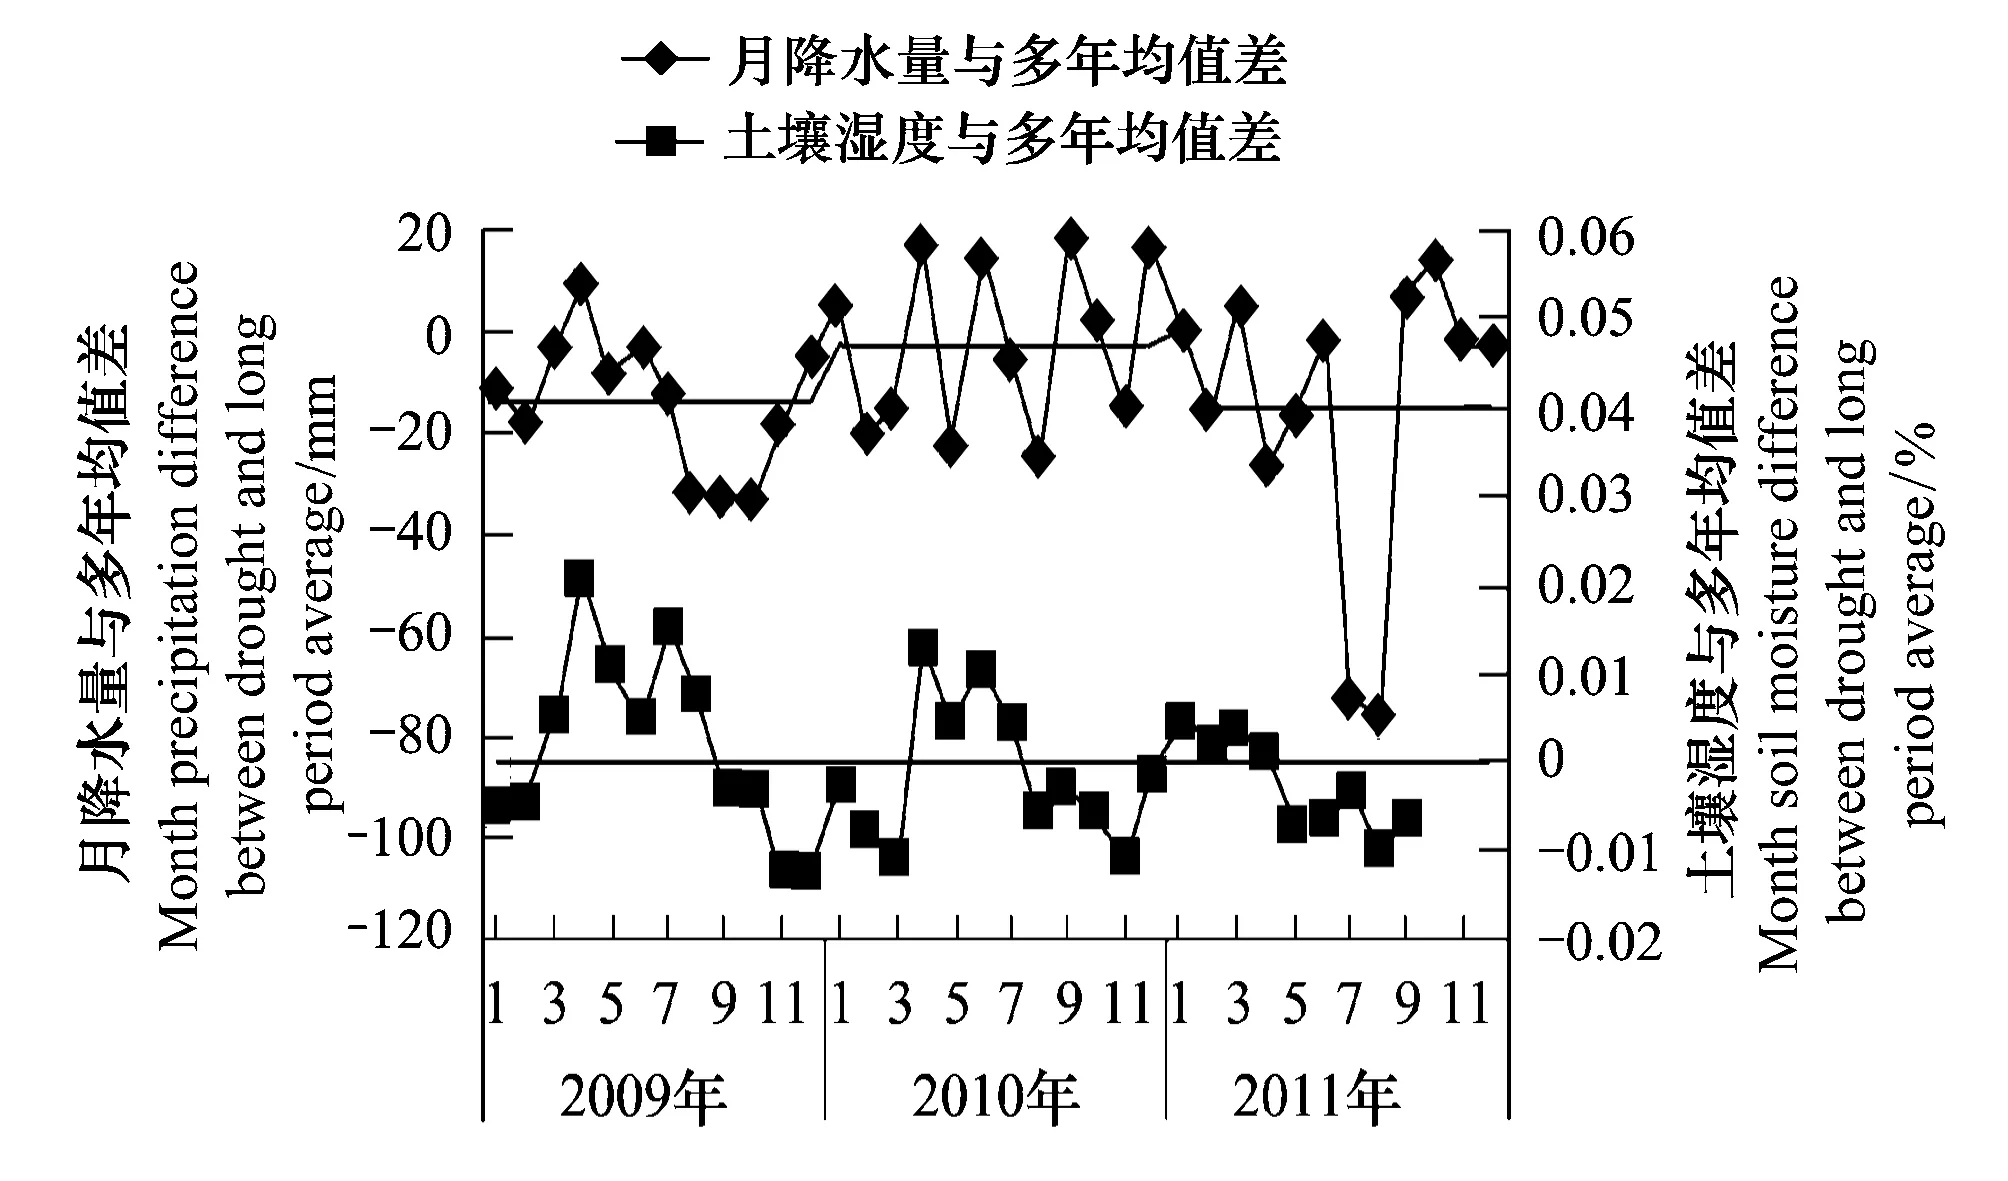
图12 西南地区干旱期间月降水量和土壤湿度与多年(1980—2008年)均值差Fig.12 Month precipitation and soil moisture difference between drought and long period average
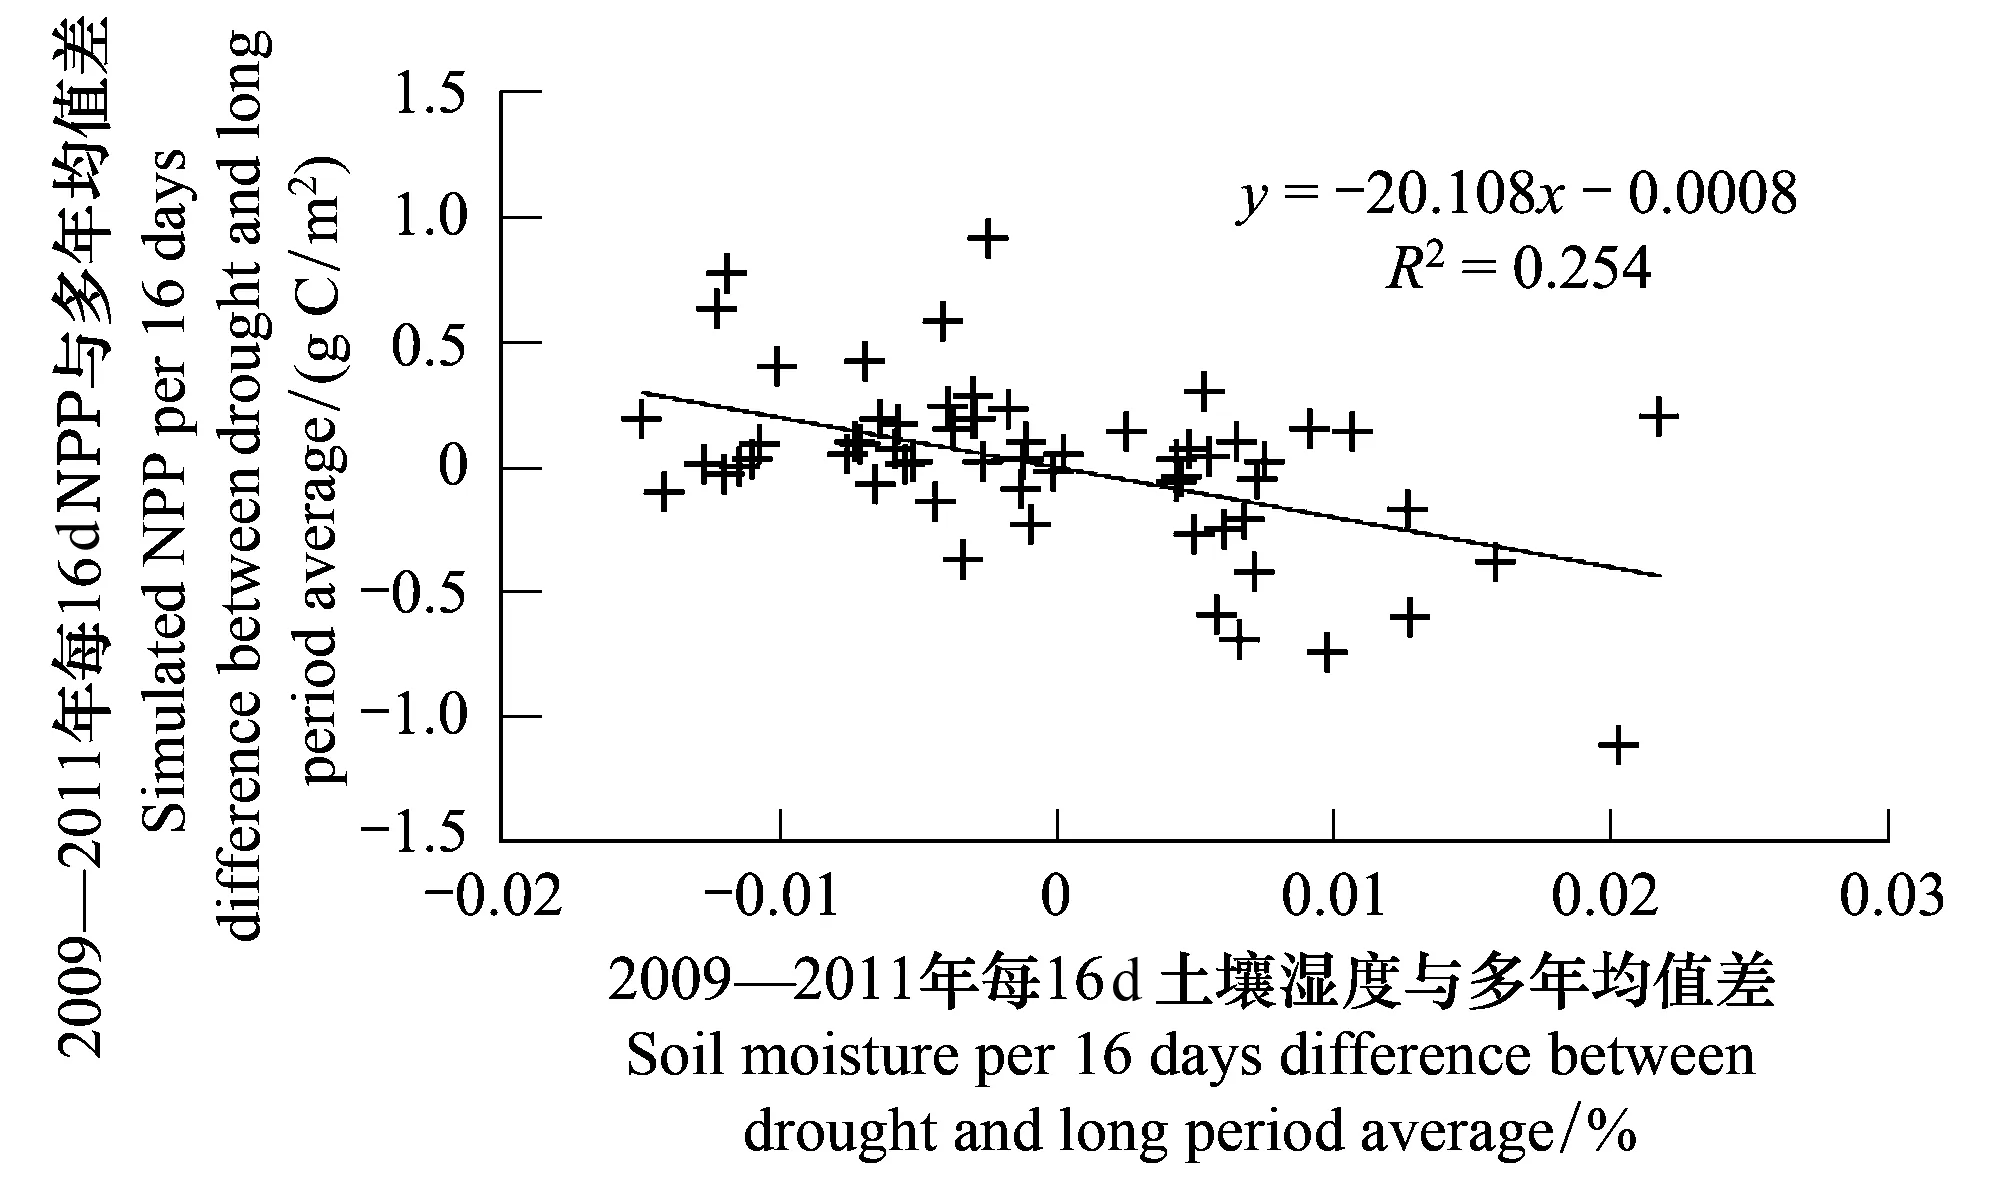
图13 2009—2011年每16d NPP和土壤湿度与多年均值差的相关分析Fig.13 Correlation analysis of simulated NPP and soil moisture per 16 days difference between drought and long period average
5 结论
(1)2009—2011年西南地区遭受了罕见的干旱灾害,其中云南、贵州、广西西北部和四川南部干旱灾害严重。2009年西南地区年降水量和湿润指数大幅下降,2010年该地区年降水量和湿润指数有所上升,2011年该地区年降水量和湿润指数又降至近32年最低值。
(2)受干旱灾害影响,西南地区植被净初级生产力比近11年均值低12.55 gC m-2a-1,总计低0.017 PgC/a。按照我国碳汇大小0.19—0.24 PgC/a计算,干旱期间我国每年损失碳汇约占总碳汇的7.91%,其中2010年损失碳汇22.33%。
(3)干旱期间西南地区植被净初级生产力变化与蒸散量显著相关(P< 0.05),而降水量和湿润指数变化过程与植被净初级生产力和蒸散量不同步,很可能与生态系统水分涵养功能导致土壤湿度变化滞后于降水量和湿润指数变化有关。
[1] 顾颖, 刘静楠, 林锦. 近60年来我国干旱灾害特点和情势分析. 水利水电技术, 2010, 41(1): 71- 74.
[2] 《第二次气候变化国家评估报告》编写委员会. 第二次气候变化国家评估报告. 北京: 科学出版社, 2011.
[3] 田汉勤, 徐小锋, 宋霞. 干旱对陆地生态系统生产力的影响. 植物生态学报, 2007, 31(2): 231- 241.
[4] IPCC. Climate Change 2007: Synthesis Report // Core Writing Team, Pachauri R K, Reisinger A, eds. Contribution of Working Groups I, II and III to the Fourth Assessment Report of the Intergovernmental Panel on Climate Change. Geneva, Switzerland: IPCC, 2007: 104- 104.
[5] 徐联. 干旱对我国农业的影响及应对措施. 广东农业科学, 2011, 38(12): 201- 203.
[6] Krishnan P, Black T A, Grant N J, Barr A G, Hogg E H, Jassal R S, Morgenstern K. Impact of changing soil moisture distribution on net ecosystem productivity of a boreal aspen forest during and following drought. Agricultural and Forest Meteorology, 2006, 139(3): 208- 223.
[7] Granier A, Reichstein M, Bréda N, Janssens I A, Falge E, Ciais P, Grünwald T, Aubinet M, Berbigier P, Bernhofer C, Buchmann N, Facini O, Grassi G, Heinesch B, Ilvesniemi H, Keronen P, Knohl A, Köstner B, Lagergren F, Lindroth A, Longdoz B, Loustau D, Mateus J, Montagnani L, Nys C, Moors E, Papale D, Peiffer M, Pilegaard K, Pita G, Pumpanen J, Rambal S, Rebmann C, Rodrigues A, Seufert G, Tenhunen J, Vesala T, Wang Q. Evidence for soil water control on carbon and water dynamics in European forests during the extremely dry year: 2003. Agricultural and Forest Meteorology, 2007, 143(1): 123- 145.
[8] Zhao M S, Running S W. Drought-induced reduction in global terrestrial net primary production from 2000 through 2009. Science, 2010, 329(5994): 940- 943.
[9] Piao S L, Ciais P, Huang Y, Shen Z H, Peng S S, Li J S, Zhou L P, Liu H Y, Ma Y C, Ding Y H, Friedlingstein P, Liu C Z, Tan K, Yu Y Q, Zhang T Y, Fang J Y. The impacts of climate change on water resources and agriculture in China. Nature, 2010, 467(7311): 43- 51.
[10] 王素琴. 西南部分地区气象干旱呈三大特点. 中国气象报, 2010-03-04(3) [2013-03- 27]. http://www.zgqxb.com.cn/xwbb/yw/201003/t20100302_5831.htm.
[11] 马建华. 西南地区近年特大干旱灾害的启示与对策. 人民长江, 2010, 41(24): 7- 12.
[12] Myers N, Mittermeier R A, Mittermeier C G, da Fonseca G A B, Kent J. Biodiversity hotspots for conservation priorities. Nature, 2000, 403(6772): 853- 858.
[13] 黄秋昊, 蔡运龙, 王秀春. 我国西南部喀斯特地区石漠化研究进展. 自然灾害学报, 2007, 16(2): 106- 111.
[14] 杨兆平, 常禹. 我国西南主要干旱河谷生态及其研究进展. 干旱地区农业研究, 2007, 25(4): 90- 93, 99- 99.
[15] 倪雪波, 刘荣高, 王世杰. 干旱影响石漠化地区植被生长的遥感观测. 西南大学学报: 自然科学版, 2009, 31(12): 140- 144.
[16] 苏维词, 杨汉奎. 贵州岩溶区生态环境脆弱性类型的初步划分. 环境科学研究, 1994, 7(6): 35- 41.
[17] Wang W, Wang W J, Li J S, Wu H, Xu C, Liu T. The impact of sustained drought on vegetation ecosystem in Southwest China based on remote sensing. Procedia Environmental Sciences, 2010, 2: 1679- 1691.
[18] 李强子, 闫娜娜, 张飞飞, 常胜, 吴炳方. 2010年春季西南地区干旱遥感监测及其影响评估. 地理学报, 2010, 65(7): 771- 780.
[19] 杞金华, 章永江, 张一平, 刘玉洪, 杨秋云, 宋亮, 巩合德, 鲁志云. 哀牢山常绿阔叶林水源涵养功能及其在应对西南干旱中的作用. 生态学报, 2012, 32(6): 1692- 1702.
[20] 穆兴民, 王飞, 冯浩, 张睿, 鲁向晖, 高鹏. 西南地区严重旱灾的人为因素初探. 水土保持通报, 2010, 30(2): 1- 4.
[21] 白开旭, 刘朝顺, 施润和, 高炜. 2010年中国西南旱情的时空特征分析——基于MODIS数据归一化干旱指数. 地球信息科学学报, 2012, 14(1): 32- 40, 48- 48.
[22] Zhang J H, Jiang L G, Feng Z M, Li P. Detecting effects of the recent drought on vegetation in Southwestern China. Journal of Resources and Ecology, 2012, 3(1): 43- 49.
[23] 李文华. 我国西南地区生态环境建设的几个问题. 林业科学, 2000, 36(5): 10- 11.
[24] Hustchinson M F. Anusplin Version 4. 2 User Guide. Canberra: Centre for Resource and Environment Studies, Australian National University, 2002.
[25] Hutchinson M F. Interpolation of rainfall data with thin plate smoothing splines Part I: two dimensional smoothing of data with short range correlation. Journal of Geographic Information Decision Analysis, 1998, 2(2): 153- 167.
[26] 王英, 曹明奎, 陶波, 李克让. 全球气候变化背景下中国降水量空间格局的变化特征. 地理研究, 25(6): 1031- 1040.
[27] Penman H L. Natural evaporation from open water, bare soil and grass. Proceedings of the Royal Society A, 1948, 193(1032): 120- 145.
[28] Richard G A, Luis S P, Dirk R, Martin S. Crop evapotranspiration-guidelines for computing crop water requirements. FAO irrigation and drainage paper 56, 1998,Rome, Italy,http://www.fao.org/docrep/X0490E/X0490E00.htm
[29] Wu S H, Yin Y H, Zheng D, Yang Q Y. Moisture conditions and climate trends in China during the period 1971- 2000. International Journal of Climatology, 2006, 26(2): 193- 206.
[30] Yin Y H, Wu S H, Zheng D, Yang Q Y. Radiation calibration of FAO56 Penman-Monteith model to estimate reference crop evapotranspiration in China. Agricultural Water Management, 2008, 95(1): 77- 84.
[31] Thornthwaite C W. An approach toward a rational classification of climate. Geographical Review, 1948, 38(1): 55- 94.
[32] Prince S D, Goward S N. Global primary production: a remote sensing approach. Journal of Biogeography, 1995, 22(4): 815- 835.
[33] Goetz S J, Prince S D, Goward S N, Thawley M M, Small J. Satellite remote sensing of primary production: an improved production efficiency modeling approach. Ecological Modelling, 1999, 122(3): 235- 255.
[34] Wang J B, Liu J Y, Cao M K, Liu Y F, Yu G R, Li G C, Qi S H, Li K R. Modelling carbon fluxes of different forests by coupling a remote-sensing model with an ecosystem process model. International Journal of Remote Sensing, 2011, 32(21): 6539- 6567.
[35] Yan H M, Fu Y L, Xiao X M, Huang H Q, He H L, Ediger L. Modeling gross primary productivity for winter wheat-maize double cropping system using MODIS time series and CO2eddy flux tower data. Agriculture, Ecosystems and Environment, 2009, 129(4): 391- 400.
[36] Raich J W, Rastetter E B, Melillo J M, Kicklighter D W, Steudler P A, Peterson J. Potential net primary productivity in south America: application of a global model. Ecological Application, 1991, 1(4): 399- 429.
[37] Cao M, Prince S D, Small J, Goetz S J. Satellite remotely sensed interannual variability in terrestrial net primary productivity from 1980 to 2000. Ecosystems, 2004, 7(3): 233- 242.
[38] Xiao X M, Hollinger D, Aber J, Goltz M, Davidson E A, Zhang Q Y, Moore B. Satellite-based modeling of gross primary production in an evergreen needle leaf forest. Remote Sensing of Environment, 2004, 89(4): 519- 534.
[39] Xiao X M, Zhang Q Y, Braswell B, Urbanski S, Boles S, Wofsy S, Moore B, Ojima D. Modeling gross primary production of temperate deciduous broadleaf forest using satellite images and climate data. Remote Sensing of Environment, 2004, 91(2): 256- 270.
[40] Ryan M G. A simple method for estimating gross carbon budgets for vegetation in forest ecosystems. Tree Physiology, 1991, 9(1): 255- 266.
[41] Running S W, Coughlan J C. A general model of forest ecosystem processes for regional application I. Hydrological balance, canopy gas exchange and primary production processes. Ecological Modelling, 1988, 42(2): 125- 154.
[42] Chen J M, Liu J, Cihlar J, Goulden M L. Daily canopy photosynthesis model through temporal and spatial scaling for remote sensing applications. Ecological Modelling, 1999, 124(2): 99- 199.
[43] 史军, 刘纪远, 高志强, 崔林丽. 造林对土壤碳储量影响的研究. 生态学杂志, 2005, 24(4): 410- 416.
[44] 国家统计局. 中国统计年鉴2010. 北京: 中国统计出版社, 2010.
[45] 国家统计局. 中国统计年鉴2011. 北京: 中国统计出版社, 2011.
[46] 国家统计局. 中国统计年鉴2012. 北京: 中国统计出版社, 2012.
[47] Mu Q Z, Zhao M S, Running S W. Improvements to a MODIS global terrestrial evapotranspiration algorithm. Remote Sensing of Environment, 2011, 115(8): 1781- 1800.
[48] Pan Y, Richard B, Fang J, Houghton R, Kauppi P E, Kurz W A, Phillips O L, Shvidenko A, Lewis S L, Canadell J G, Ciais P, Jackson R B, Pacala S W, McGuire A D, Piao S, Rautiainen A, Sitch S, Hayes D. A large and persistent carbon sink in the world′s forests. Science, 2011, 333(6045): 988- 993.
[49] Ciais P, Reichstein M, Viovy N, Granier A, Ogée J, Allard V, Aubinet M, Buchmann N, Bernhofer C, Carrara A, Chevallier F, De Noblet N, Friend A D, Friedlingstein P, Grünwald T, Heinesch B, Keronen P, Knohl A, Krinner G, Loustau D, Manca G, Matteucci G, Miglietta F, Ourcival J M, Papale D, Pilegaard K, Rambal S, Seufert G, Soussana J F, Sanz M J, Schulze E D, Vesala T, Valentini R. Europe-wide reduction in primary productivity caused by the heat and drought in 2003. Nature, 2005, 437(7058): 529- 533.
[50] Phillips O, Aragäo L E O C, Lewis S L, Fisher J B, Lloyd J, López-González G, Malhi Y, Monteagudo A, Peacock J, Quesada C A, van der Heijden G, Almeida S, Amaral I, Arroyo L, Aymard G, Baker T R, Bánki O, Blanc L, Bonal D, Brando P, Chave J, de Oliveira A C A, Cardozo N D, Czimczik C I, Feldpausch T R, Freitas M A, Gloor E, Higuchi N, Jiménez E, Lloyd G, Meir P, Mendoza C, Morel A, Neill D A, Nepstad D, Patio S, Peuela M C, Prieto A, Ramírez F, Schwarz M, Silva J, Silveira M, Thomas A S, Steege H T, Stropp J, Vásquez R, Zelazowski P, Dávila E A, Andelman S, Andrade A, Chao K J, Erwin T, Di Fiore A C E H, Keeling H, Killeen T J, Laurance W F, Cruz A P, Pitman N C A, Vargas P N, Ramirez-Angulo H, Rudas A, Salamäo R, Silva N, Terborgh J, Torres-Lezama A. Drought sensitivity of the Amazon rainforest. Science, 2009, 323(5951): 1344- 1347.
[51] 朴世龙, 方精云, 黄耀. 中国陆地生态系统碳收支. 中国基础科学, 2010, 12(2): 20- 22.
[52] Pasho E, Camarero J J, de Luis M, Vicente-Serranoa S. Impacts of drought at different time scales on forest growth across a wide climatic gradient in north-eastern Spain. Agricultural and Forest Meteorology, 2011, 151(12): 1800- 1811.
Drought in southwestern China and its impact on the net primary productivity of vegetation from 2009—2011
ZHAO Zhiping,WU Xiaopu,LI Guo,LI Junsheng*
ChineseResearchAcademyofEnvironmentalSciences,Beijing100012,China
Droughts are weather patterns involving prolonged reductions in precipitation that are distinct from normal weather cycles. They can be accompanied by extreme heat. There are three types of drought that affect vegetation: weather, soil, and physiology. In recent years, global climate change has significantly increased the frequency of drought and other extreme weather in China. Severe drought interferes with agricultural production and has caused a sharp decline in the net primary productivity of vegetation. It has decreased the total volume of rivers, dried up lakes, and degraded local environments. Southwestern China has suffered from a long-term drought that began in the autumn of 2009. Precipitation is half of what it was years ago. In this study, meteorological station data was used to analyze the process and magnitude of this drought from 2009—2011. Then a light-use-efficiency-based model for calculating net primary productivity called GloPEM was used to determine the impact of drought on the net primary productivity of vegetation during this time. The study area included Guizhou, Yunnan, and Sichuan Provinces, the Guangxi Zhuang Autonomous Region, and Chongqing City. The results showed that the drought was severe in Yunnan, Guizhou, northwestern Guangxi, and in southern Sichuan. And the precipitation and moisture index of 2009—2011 were obviously lower than the average of 1980—2011 in southwestern China. In 2009, the precipitation and moisture index declined sharply. In 2010, the precipitation and moisture index returned to near-normal levels. In 2011, the precipitation and moisture index fell to the lowest point in the past 32 years. For light-use-efficiency-based model, the total radiation is an important parameter. In this study, variations in simulated total radiation were closely correlated with observation results (R2= 0.84,P< 0.01). This drought may have reduced the net primary productivity of vegetation, decreasing plant′s ability to create a carbon sink. In the study area, the average of net primary productivity from 2009—2011 was 12.55 gC m-2a-1lower than the average value from 2001—2011. It was 0.017 PgC/a in total. This reduced China′s total carbon sink by 7.91%. In 2010 alone, this loss reduced China′s total carbon sink by 22.33% for that year. Variations in simulated net primary productivity were closely correlated with observation results (R2= 0.64,P< 0.01), which indicated that simulation of net primary productivity from GloPEM model was reliable and the parameters of GloPEM model were suitable in southwestern China. From 2001—2011, variations in net primary productivity were closely correlated with evapotranspiration (R2= 0.44,P< 0.05) in southwestern China. From 2009—2011, variations in net primary productivity and evapotranspiration were synchronized, but variations in precipitation and moisture index were not synchronous with those in net primary productivity or evapotranspiration. Statistical analysis of areas covered and affected by drought from 2009—2011 confirmed this. Variations of soil moisture levels were closely correlated with net primary productivity (R2= 0.25,P< 0.01). This phenomenon might have a relationship with the water conservation function of the ecosystem, which causes a delayed correlation between soil moisture levels and precipitation.
drought in southwestern China; moisture index; net primary productivity; GloPEM model
环保公益性行业科研专项项目(201209031)
2013- 04- 04;
日期:2014- 03- 25
10.5846/stxb201304040604
*通讯作者Corresponding author.E-mail: lijsh@craes.org.cn
赵志平,吴晓莆,李果,李俊生.2009—2011年我国西南地区旱灾程度及其对植被净初级生产力的影响.生态学报,2015,35(2):350- 360.
Zhao Z P,Wu X P,Li G,Li J S.Drought in southwestern China and its impact on the net primary productivity of vegetation from 2009—2011.Acta Ecologica Sinica,2015,35(2):350- 360.
