蒙古中南部地区噪声层析成像
2015-03-01潘佳铁吴庆举李永华余大新高孟潭UlziibatDemberel
潘佳铁, 吴庆举, 李永华, 余大新,高孟潭, M. Ulziibat, S. Demberel
1 中国地震局地球物理研究所, 北京 100081 2 中国地震局地球物理研究所地震观测与地球物理成像重点实验室, 北京 100081 3 中国地震局第一监测中心, 天津 300180 4 蒙古科学院天文与地球物理研究中心, 蒙古乌兰巴托 210351
蒙古中南部地区噪声层析成像
潘佳铁1,2, 吴庆举1,2, 李永华1,2, 余大新1,3,高孟潭1, M. Ulziibat4, S. Demberel4
1 中国地震局地球物理研究所, 北京 100081 2 中国地震局地球物理研究所地震观测与地球物理成像重点实验室, 北京 100081 3 中国地震局第一监测中心, 天津 300180 4 蒙古科学院天文与地球物理研究中心, 蒙古乌兰巴托 210351
依托中蒙国际合作项目“远东地区地磁场、重力场及深部构造观测与模型研究”,我们首次获取了蒙古中南部地区密集的地震台阵观测资料.本研究收集了69套宽频带台站 2011年8月至2013年7月间的垂直向连续记录,利用噪声互相关方法计算了台站间的经验格林函数,并采用基于连续小波变换的频时分析方法,提取了1478条周期6 ~30 s的瑞雷波的相速度频散曲线.利用Ditmar & Yanovskaya方法,我们构建了研究区6~30 s瑞雷波的高分辨率(0.5°×0.5°)相速度分布图.结果表明,蒙古中南部地区的地壳上地幔速度结构存在横向非均匀性,但并不显著(相对变化~±2%).短周期(如6 s)的相速度分布与地表地质构造具有明显的相关性,具体来说,北部山盆显示为高速,南部盆地、戈壁滩均显示为低速;随着周期的增大(如15 s,20 s),地形的控制作用相对减弱.较长周期(30 s)的相速度分布图上,南部的高速区进一步扩大,与南部地壳厚度较薄有关.蒙古主构造线南北两侧相速度分布有明显差异,暗示它不仅是地表地形和构造的分界线,而且还是地壳结构的分界线.从6~30 s中戈壁一直显示为低速,可能与该区新生代火山活动有关;研究区北部杭爱山—肯特盆地一直显示为相对的高速,与该区具有较老、稳定的地层有关.
蒙古中南部地区; 噪声成像; Rayleigh波; 相速度; 高分辨率
1 引言
蒙古中南部地区(103.5°E—111.5°E, 43°N—49°N)位于中亚造山带(Central Asian Orogenic Belt,CAOB)的中心.CAOB是地球上最大的大陆造山带之一,北邻西伯利亚克拉通和贝加尔裂谷,南接塔里木—中朝克拉通,西端延伸到俄罗斯的乌拉尔山,向东至西太平洋海岸,呈向南突出的巨大弧形带(图1).该造山带是全球显生宙陆壳增生与改造最显著的大陆造山带.早古生代至晚古生代中期,古亚洲洋向南北两侧俯冲消减,洋盆闭合,该区域微陆块相互碰撞拼贴构成联合板块.至喜山期,受到印度—欧亚板块碰撞影响,广泛发育NE-SW走向的挤压转换构造,是地球上现今构造运动最为活跃的地区之一,在亚洲大陆构造格局中占据非常重要的地位(陈岳龙等,2013).作为地质历史时期构造运动和壳幔相互作用最强烈的区域,CAOB发育了复杂的变质变形和岩浆活动(图1),一直以来都是地球科学研究的前沿热点之一,引起世界众多地质学家、地球化学家和地球物理学家的关注(engör et al.,1993; Xiao et al., 2003; Windley et al., 2007; Kröner et al., 2008; Rojas-Agramonte et al., 2011 ; Zorin et al, 2002; Gao et al., 1994, 1997, 2004; Zhao et al., 2006; Lebedev et al., 2006; Tian et al., 2011; Zhang et al., 2014).获取该地区的壳幔结构,对于研究板内火山形成机理、大陆造山带的壳幔变形机制、壳幔耦合方式等有重要的科学意义.

图1 研究区台站分布与构造分区示意图左下角插图红色方框内为研究区,阴影区为中亚造山带.A.杭爱—肯特山盆地;B.中戈壁;C. Ldermeg;D. Tamsag盆地.构造线(L1、L2、L3)源自Badarch et al.(2002);玄武岩、火山出露位置源自(Whitford-Stark, 1987; http:∥www.colcano discovery.com/ mongolia. html).Fig.1 Seismic station distribution and tectonic sketch map in study area The red rectangle in the inset map located at the lower left corner denotes the study region. The shaded region represents the Central Asia Orogenic Belt. A. Hangay-Hentey Mountain basin; B. Middle Gobi belt; C. Ldermeg; D. Tamsag basin. The geologic unit boundaries (L1, L2, L3) are from Badarch et al. (2002). The basalt and volcanoes locations are from Whitford-Stark (1987) and a webpage (http:∥www.volcanodiscovery.com/mongolia.html)
地震学方法是认识地球内部结构的有力手段之一.自20世纪90年代初开始,研究人员在相邻地区(贝加尔裂谷、杭爱高原)开展了流动地震观测.通过地震学研究,前人在蒙古中南部周边地区的上地幔中发现了重要的地学构造存在的迹象,如杭爱山地幔柱(Bushenkova et al., 2002;Koulakov et al., 2002)或者穹窿(Petit et al., 2002;Barruol et al., 2008)、贝加尔地幔柱(Gao et al., 2003;Zhao et al., 2006;Si et al., 2013)、肯特山地幔柱(Zorin et al., 2003).Zorin等(2002)通过接收函数研究,发现西伯利亚—蒙古地震剖面(Bratsk-Irkutsk-Ulanbaatar-Undurshil)下方普遍存在壳内低速层,被认为是壳内部分熔融的表现.由于该测线位于研究区东南部,对于该区内未见火成岩出露的地方是否存在壳内低速异常仍不得而知.面波对S波速度比较敏感,对低速层有一定的约束能力,但已有的面波研究(如Ritzwoller and Levshin, 1998;易桂喜等,2008;Li et al., 2013)都是大尺度上的,无法分辨研究区的结构变化.
依托中蒙合作项目“远东地区地磁场、重力场及深部构造观测与模型研究”,我们首次获得了该地区密集的地震台阵观测资料.该项目在蒙古开展了地磁、重力和地震等多种地球物理观测,其中地震观测在蒙古中部地区架设了69套宽频带地震仪(图1).密集的、长时间的中蒙地震台阵观测,为我们采用地震学方法研究该地区精细的地壳上地幔结构提供了很好的基础资料.
利用该台阵的资料,近期已经采用不同地震学手段开展了壳幔结构的相关研究(如张风雪等,2014;何静等,2014;余大新等,2015).其中体波成像有较好的横向分辨率,但垂向分辨率不好且在地震发生较少的地区因近震事件少而缺乏对浅部结构的约束;接收函数对速度界面的约束较好,但对绝对速度不敏感;天然地震面波成像有较好的垂向分辨率,但受震源、台站位置的影响,射线路径数量、方位受限且较难提取到短周期(<10 s)的频散,对地壳浅部缺乏约束.与天然地震面波成像方法相比,背景噪声层析成像摆脱了对震源的依赖,射线路径更为丰富,同时还能很容易提取到较短周期的频散,对地球浅部结构具有良好的分辨能力,构成对天然地震面波成像方法的有益补充.近年来,噪声成像得到了越来越广泛的应用(如,Shapiro et al.,2005; Bensen et al.,2007; Zheng et al,2008;Yang et al,2010;潘佳铁等,2014).
本文利用中蒙台阵 69个流动台站记录的垂向连续观测资料,通过互相关计算了台站间的经验格林函数,然后采用面波层析成像方法,构建了蒙古中南部地区周期6~30 s的瑞雷波的相速度分布图,并结合已有地质与地球物理研究成果,对其速度分布、横向变化及其可能存在的地质含义进行了探讨,为下一步开展三维S波速度结构和方位各向异性的研究奠定了基础.
2 研究区地质概况
蒙古中南部地区由近东西向的蒙古主构造线(Main Mongolian Lineament,MML)将研究区分为北、南两个主要的地质单元(图1).该构造线不仅是蒙古国境内地形和构造的分界线,还是一条板块消减的缝合带(Windley et al., 2007).MML以北是加里东造山带,以南是海西造山带.北部造山带由二叠-三叠纪火山深成岩带、泥盆-石炭浊流岩盆地、大陆增生边缘带等次级地质单元拼合而成,发育有杭爱—肯特山盆地、中戈壁火山及Bus-obo火山(Whitford-Stark, 1987)等.晚古生代至晚中生代,研究区内发生了一重要的地质事件——由于西伯利亚板块和阿穆尔板块沿蒙古—鄂霍茨克缝合线的碰撞,古蒙古—鄂霍茨克海消亡于CAOB东部,但关于消亡的具体时间和位置,目前仍无定论(Zonenshain et al., 1991;Zorin,1999;Badarch et al., 2002;Parfenov et al., 2010;Yang et al., 2014).南部造山带则由新生代盆地、岛弧、弧前/弧后盆地组成,发育有Tamsgan盆地和大面积的戈壁滩(Badarch et al., 2002).
3 数据资料和处理方法
3.1 资料数据
本研究收集了中蒙台阵69个台站2011年8月—2013年7月间的垂直向连续记录.每个台站配备了Refteck-130B数据采集器和CMG-3ESPC宽频带地震计,频带范围为0.02~60 s.台站仪器统一采用GPS授时,保证了较为一致的时间服务.单台数据处理方法与Bensen等(2007)一文的叙述基本一致,简要概括如下:
(1)对原始连续波形数据重采样到1 s,去倾斜、去均值.因所用仪器都是相同型号的,故不必去除仪器响应.随后进行4~50 s的带通滤波;(2)使用滑动绝对平均的时间域归一化方法,以去除天然地震、仪器畸变信号带来的干扰.然后进行频谱白化处理,这样能够拓宽信号的频带范围,减小某个固定频率成分带来的影响;(3)在噪声互相关函数(Noise Cros-correlation function,NCF)的计算中,以天为长度单位,对之前预处理后两个台站的连续记录做互相关运算并叠加,得到双台间的NCF;(4)每个NCF都有一个正的和一个负的分支,分别代表了向两个相反方向传播的波.若噪声源在时间、空间上是均匀分布的,这两个分支则应该是对称的.但在实际观测中,由于噪声源分布并不是很均匀,经常会出现正负分支并不完全对称的情形.与Lin等(2008)一样,我们把正负分支反序后叠加再除以2,形成对称分量,以提高信噪比,然后对时间微分求得经验格林函数(公式(1)).从波形上看,本文得到的格林函数具有很好的频散特征,面波信号的到时也具有很好的一致性(图2).

图2 台站间的经验格林函数(信噪比大于15).绘图时使用了绝大部分台站对,波形进行了4~50 s带通滤波Fig.2 Interstation Empirical Green Functions (SNR>15).Most of the inter-station paths were used to plot this figure. A band pass filter between 4 s and 50 s was applied
(1)
3.2 频散曲线的测量以及质量控制
在远场近似的条件下,相速度CAB可以由下式计算得到(Yao et al.,2006),
CAB(T)=Δ/(t-T/8),
(2)
Δ为台站间距,T为周期,t是对周期T窄带滤波后波峰的到时.
本文利用基于连续小波变换的频时分析方法测量瑞雷波的相速度频散(Wu et al.,2009),测量频段为5~30 s.频散曲线是人工一条一条拾取的,与自动测算相比,人工拾取可以将大部分明显异常的、不光滑的虚假频散及时排除掉,以保证频散数据的可靠性.
理论上,任意双台路径上都可以通过互相关计算得到经验格林函数,但并不是每个经验格林函数都具有较好的波形和频散特征,提取出的频散可能会是虚假频散.为了保证成像结果的可靠性,对频散曲线进行质量控制即在大量的经验格林函数、频散曲线中挑选出优质、可靠的部分显得十分重要.本文通过如下三个准则来控制频散曲线的质量:(1)选取高信噪比(>15)的经验格林函数进行频散测量.信噪比的定义同Bensen等(2007),即为信号窗内的最大振幅值与噪声窗内的均方差之比.我们选取经验格林函数尾段100 s作为噪声窗口;(2)为满足远场近似条件,只选取台站间距大于3倍波长的数据;(3)移除拟合残差较大的路径上的频散.这一步需要进行初步的反演,只保留反演残差较小的75%的路径.经此处理后,偏离平均速度较大的路径数据被剔除了,称为“outliers移除”(处理结果如图4a).我们可以看到,outliers移除后每个周期的速度分布更为集中.
经过准则(1),我们最初测量得到1599条光滑连续的6~30 s的相速度频散曲线.通过之后两个准则筛选后,最终参与反演的各周期的总路径数为1478,路径分布见图3,各周期对应的路径数量见图4b.我们可以看到,在6~30 s频段,路径数目最多时超过1000条,最少时也超过了400条,对于本研究区覆盖面而言路径覆盖可以说是十分的均匀、密集,这为我们开展高分辨率的噪声成像提供了很好的前提保证.
4 瑞雷波噪声层析成像
4.1 面波层析成像方法以及分辨率测试不再赘述.
本文采用Ditmar和Yanovskaya (1987)、Yanovskaya和Ditmar(1990)方法反演获取研究区2D的相速度分布.该方法是面波层析成像中广泛应用的方法之一(如Wu and Levshin, 1994;Ritzwoller and Levshin, 1998; 何正勤等,2009;Fang et al., 2010;Li et al., 2012),其原理参见文献(Wu and Levshin, 1994;潘佳铁等,2011),在此

图3 路径分布图(1478条). UB代表乌兰巴托Fig.3 Coverage of paths (1478). UB represents Ulaanbaatar
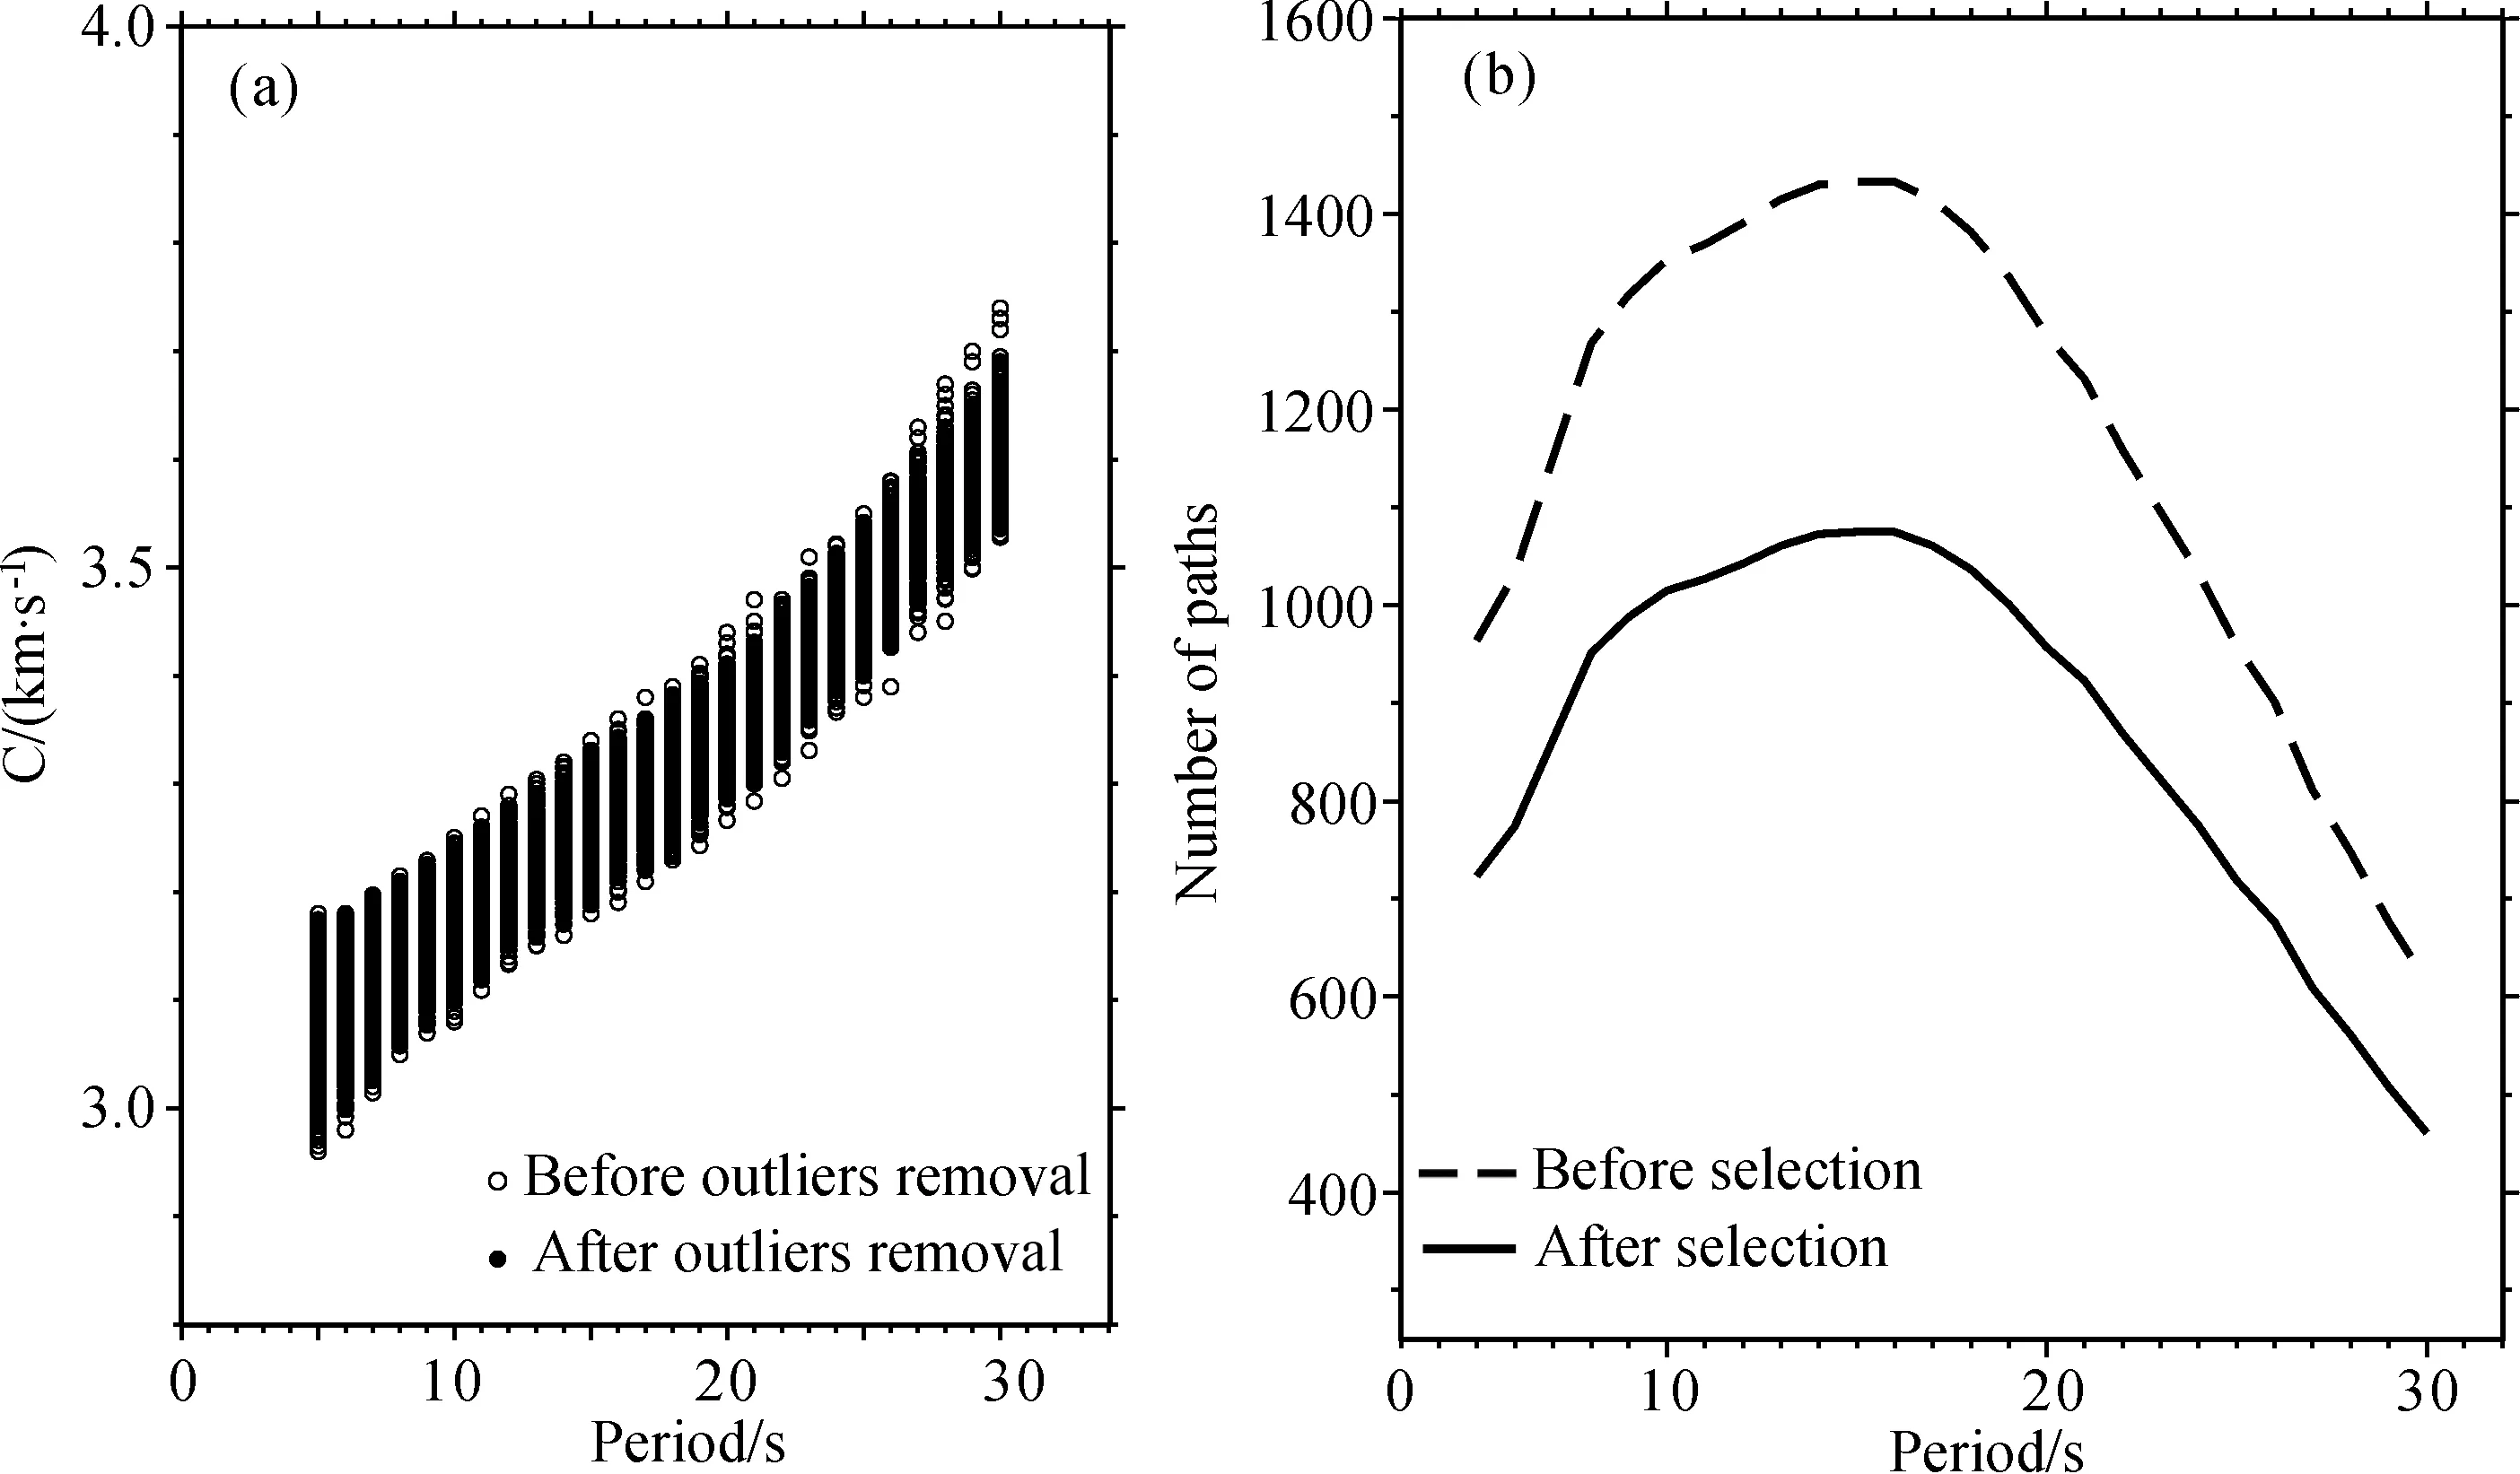
图4 (a)outliers移除(准则3)前后各周期对应的相速度值的分布.空心圆即代表处理过后剔掉的部分,(b)质量控制前后各周期对应的路径数Fig.4 (a) Phase velocities at different periods before and after removing outliers (criterion 3). The empty circles represent the outliers removed after this processing. (b) The number of paths at each period before and after applying the quality control criteria

图5 检测板测试最上为0.5°×0.5°输入模型.各周期初始模型扰动量均为±0.3 km·s-1.黑色三角表示台站.Fig.5 Checkerboard test results The input model with the 0.5° × 0.5° grid spacing is at the top. The velocity perturbation was ±0.3 km·s-1 for all of the periods. The black triangles represent the stations.

图6 不同周期基阶瑞雷波相速度对深度的敏感度核函数.用于计算敏感核的一维模型是在AK135大陆模型的基础上修改得到的,上下地壳厚度按照原比例膨胀,使地壳厚度增加至42 km(根据何静等(2014)接收函数结果)Fig.6 Depth sensitivity kernels of shear wave velocity (Vs) for fundamental Rayleigh wave phase velocities at different periods.The 1-D model used to calculate sensitivity kernels was obtained from the AK135 continental model by making the upper crust and lower crust thicker that its original ratio until the crust thickness was 42 km (this depth is from a previous receiver function study (He et al., 2014)).
在给出反演结果的同时,往往需要给出对解的评价.为了评估数据的分辨能力,我们做了检测板测试(Checkerboard test).将研究区划分成0.5°×0.5°,对几个具有代表性周期(6 s,15 s,20 s,30 s)的数据分别进行测试.不同周期使用了不同的初始模型(即不同的参考速度),速度扰动量均为±0.3 km·s-1.由于实际观测中存在误差,所以在测试过程中我们对理论走时加上了随机的高斯噪声.测试结果表明(如图5),除了台阵覆盖边缘区域外,有效研究区内初始模型的速度值和扰动量均得到较好的恢复,表明本研究分辨能力可达0.5°×0.5°,成像结果中大于0.5°×0.5°的速度异常才是比较可信的.
反演过程中,正则化参数α控制着反演结果的光滑程度和数据拟合程度.α越大,反演结果越光滑,但数据的拟合度越小;反之α越小,反演结果的分辨率越高,但是误差也越大,得到的模型越不光滑.α可以通过几次尝试确定其值,本文使用的α为0.2,得到的结果比较光滑,且误差较小.
4.2 噪声成像结果
在层状地球模型介质中,相对P波速度、层厚、密度等层参数而言,面波相速度对S波速度最为敏感.因不同周期的相速度对不同深度S波速度的敏感程度不一样,故在根据2D相速度分布来分析讨论S波速度的横向变化时,通常需要参考相速度在深度方向上的敏感度核函数.不同模型计算得到的敏感度核函数不一样,其中模型地壳厚度是一个很关键的影响因素.何静等(2014)通过接收函数方法得到蒙古褶皱带的地壳厚度介于39~45 km,因此我们使用了AK135(Kennett et al., 1995)的大陆模型,并使其地壳厚度为42 km.图6是在AK135模型的基础上,按其上、下地壳原比例膨胀,把地壳厚度增加至42 km后得到的模型计算出的敏感度核函数.一般来说,基阶瑞雷波波相速度对大约1/3波长深度附近介质的S波速度结构最为敏感.周期越短,波长就越短,主要对越浅深度的S波速度更敏感;反之周期越长,波长就越长,主要对越深的S波速度更敏感.
采用Yanovskaya-Ditmar方法,我们反演得到了研究区不同周期瑞雷波的相速度分布图(图7).本文只展示了6 s、15 s、20 s和30 s四个具有代表性周期的结果.不同周期相速度的分布图,揭示了蒙古中南部地区地壳上地幔S波速度结构存在横向非均匀性.与中国华北东北部、川西等小范围区域噪声层析成像得到的某一周期(周期<30 s)的相速度的变化幅值相比(0.3~0.5 km·s-1)(Pan,2012;李昱等,2010),研究区相应周期的相速度变化仅~0.15 km·s-1左右(相对变化~±2%),表明蒙古中南部地区的地壳上地幔S波速度结构的横向非均匀性较弱.
周期6 s的相速度分布图主要反映了研究区浅表(5~12 km)S波速度的平均变化情况(图7a).相速度的变化介于2.99~3.17 km·s-1之间,变化幅值约为0.18 km·s-1.以断层F2为界,研究区南、北相速度分布有明显的差异.南部主要显示为低速异常,西南角、北部表现为高速异常.东南部最显著的低速区与Tamsag盆地边界吻合较好.结合地质资料(Badarch et al., 2002),南部戈壁和Tamsag盆地有稍厚的沉积层覆盖,结晶基地埋深较深.西南角为岛弧.北部虽然是杭爱—肯特山盆地,但地表出露晚古生代的岩层,沉积层较薄.这表明短周期的相速度分布跟地表地质构造有明显的相关性.具体而言,高速对应着杭爱—肯特山盆地,低速对应戈壁、Tamsag盆地.前人通过噪声成像(如Shapiro et al., 2005; Zheng et al., 2008)也发现,高速对应着山区和地表隆起区,低速则对应着沉积盆地、坳陷等,本文的结果也符合这一规律.
中等周期(如15 s,20 s)的相速度分布大致反映了研究区15~40 km深度范围内S波速度的平均变化情况(图7b、7c).相速度变化的幅值分别约为0.12、0.1 km·s-1.跟周期6 s的相速度分布相比,中等周期的相速度分布特征与之大体类似:F2以北地区主要显示为高速,中部地区(L1与MML间)显示为大面积的低速;不同的是,Tamsag盆地边界与低速区边界(L3)的吻合度没有6 s那么好,西南角的高速体消失,东南部逐渐有高速体出现,且高速体的范围随着周期的增大有扩大的趋势.这表明中等周期的相速度分布受浅表地质构造的控制作用明显减小,南、北部地区具有较快的中下地壳S波速度.
较长周期(如30 s)的相速度分布大致反映了研究区下地壳及壳幔过渡带S波速度的变化情况(图7d).相速度的变化幅值约为0.1 km·s-1.除西部边缘和中部地区显示为低速外,其他地区主要呈现为高速.与中等周期(如20 s,图7c)相比,南部高速区的范围进一步扩大,而北部地区仍然显示为高速.MML是一条板块消减的缝合带(Windley et al., 2007),其南北两侧相速度有较大差异,呈现出北低南高的分布特征.接收函数结果(如何静等,2014)揭示在MML南北两侧,地壳厚度北厚南薄,有4 km的变化.这表明较长周期的相速度分布跟地壳厚度密切相关,同时也揭示出MML不仅是地表地形和构造单元的分界线,而且还是地壳厚度、S波速度的分界线.
前人在其它地区开展的天然地震面波成像(如何正勤等,2009;潘佳铁等,2011)和噪声成像(如Yang et al., 2010;李昱等,2010;Zheng et al., 2011)也类似地发现,在莫霍面不是特别深的大陆地区(如,<45 km),瑞雷波25~30 s的相速度分布和地壳厚度密切关联.因为地壳厚度较小的地区该频段的瑞雷波探测深度已达上地幔顶部,其相速度便呈现为高速;地壳厚度较大的地区该频段的瑞雷波探测深度还在下地壳内,其相速度便显示为低速.根据何静等(2014)P波接收函数的结果,从研究区北部到南部,地壳厚度从45 km减小至39 km.那么依照前述规律,较长周期的相速度的分布应该是北低南高,但是7d上北部并非显示为低速异常(跟中等周期的图一样仍然显示为高速异常),表明北部杭爱山—肯特山下方的中、下地壳S波速度较快,这可能与该区古老的地层有关(Badarch et al., 2002).
5 讨论
5.1 与天然地震面波成像的对比
利用天然地震面波层析成像,余大新等(2015)获得了蒙古中南部地区15 s的瑞雷波的相速度分布图(图8a).对于天然地震和背景噪声成像这两种方法而言,周期15 s的射线均较丰富,因此我们把15 s的成像结果做了对比(图8b).
从整体上看(图8a),天然地震方法与噪声方法得到的相速度分布特征很相似(南、北部高速,中戈壁带低速),绝大部分地区二者相速度的差值在±1%以内(图8b).显而易见地,除了乌兰巴托东部以及研究区东南部局部地区天然地震方法得到的相速度稍微偏低以外,在研究区绝大部分地区天然地震方法得到的相速度均要偏高.两种成像方法得到的相速度偏差较小,在误差允许的范围内.关于天然地震方法较噪声方法得到的面波频散(相速度、群速度)略微偏高的现象,前人研究已有类似的报道(如Yao et al.,2006;潘佳铁等,2014).造成这种系统偏差的主要原因有:(1)面波偏离大圆路径传播,导致天然地震双台法面波的实际传播时间偏短,得到的相速度也就稍微偏高;噪声方法面波的实际传播时间偏长,得到的相速度也就稍微偏低;(2)噪声源在时间、空间上不均匀分布对噪声方法提取格林函数的影响;(3)面波的有限频率效应,使天然地震方法的敏感区域不只限于两个台站间的区域,较噪声方法更大.
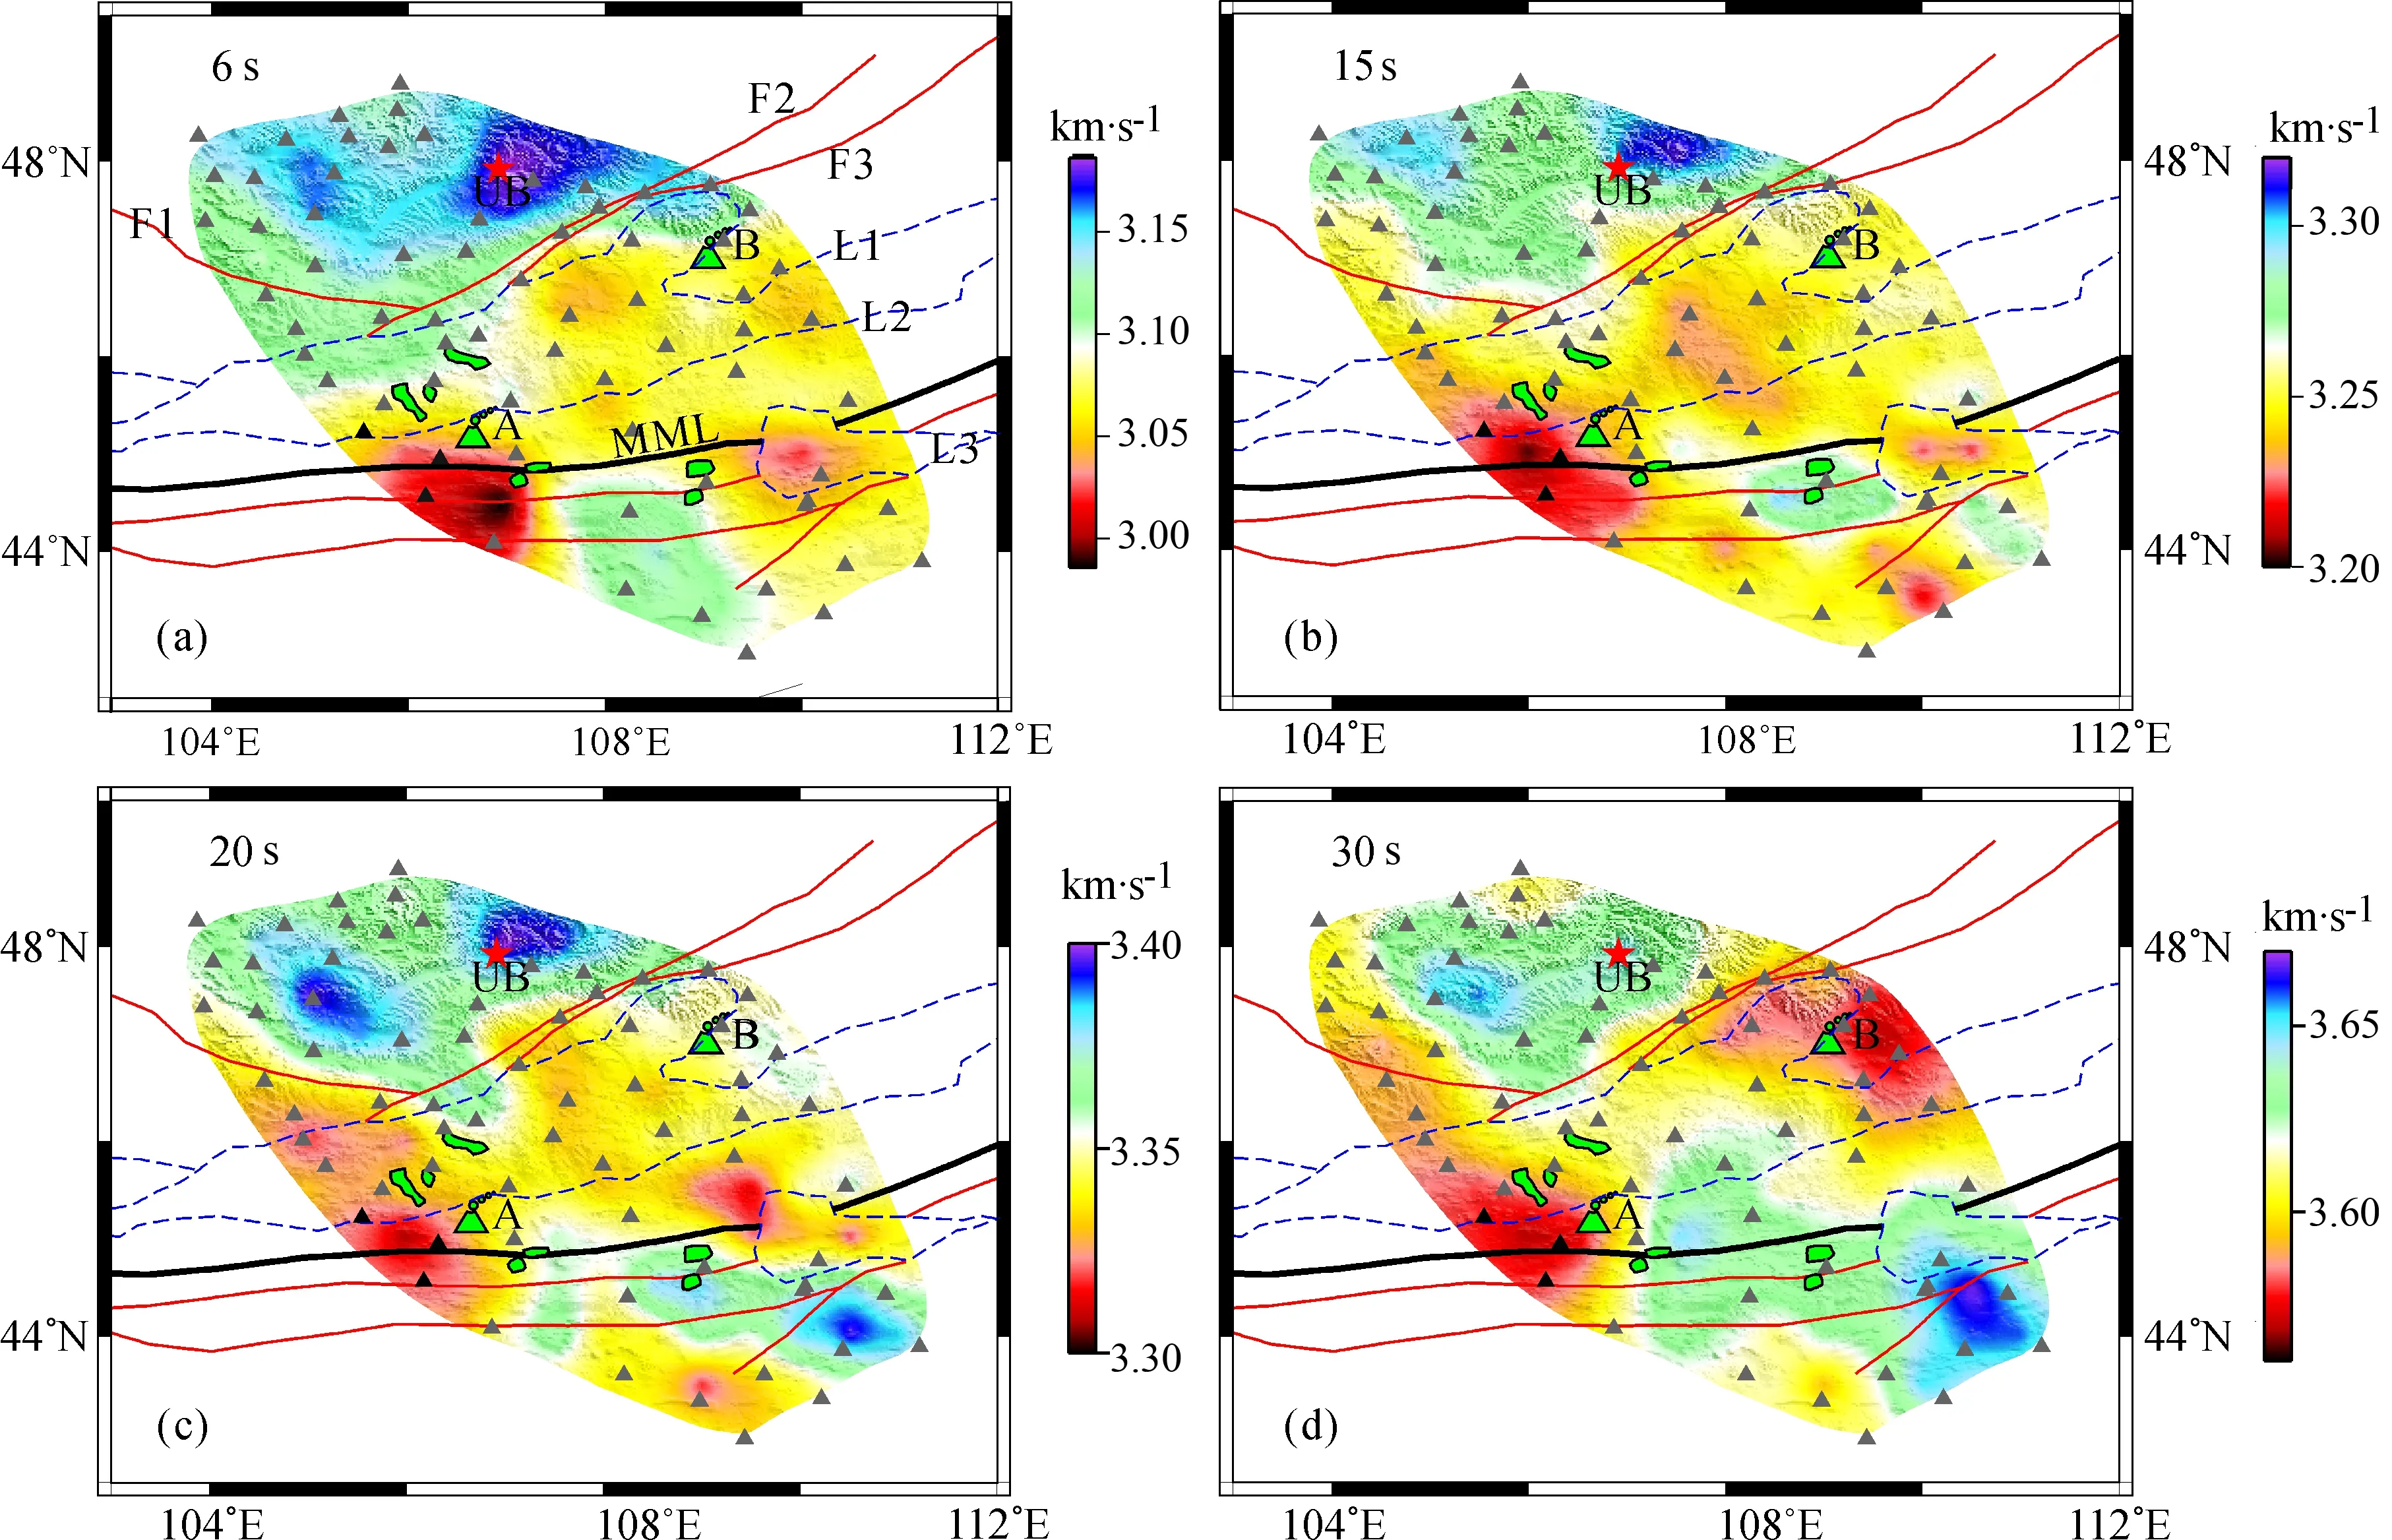
图7 蒙古中南部地区瑞雷波相速度分布图三角表示台站(黑色三角表示西部显著低速区中的台站),蓝色虚线表示地质分区界线,黑色粗实线表示蒙古主构造线(MML).红线表示断层,绿色小块表示火山/火成岩出露的位置.UB.乌兰巴托;A.中戈壁火山;B.Bus-obs火山.Fig.7 Rayleigh wave phase velocity maps in central Mongolia The triangles denote seismic stations (black ones represent stations in the obvious low velocity zone to the west). The blue dashed lines represent the geologic unit boundary from Badarch et al. (2002). The black solid thick line is the main Mongolia lineament. The red lines are faults. Green blocks represent outcrops of volcanoes/basalt. UB represents Ulaanbaatar. A. The Middle Gobi volcano; B. Bus-obs volcano.

图8 (a)天然地震面波成像得到的周期15 s相速度分布图(余大新等,2015);(b)天然地震方法与噪声方法得到的相速度(15 s)之差的分布图(参考速度为两种方法得到的平均速度的均值)Fig.8 (a) Rayleigh wave phase velocity map at period of 15 s from surface tomography with earthquake data (Yu et al., 2015); (b) The differences between the phase velocity obtained by earthquake data and NCF (the reference velocity C0 is the average value of the velocities obtained from the earthquake data and NCF)
5.2 中戈壁地区火山
中戈壁地区(L1与MML间)从6~30 s均呈现为显著的低速(图7a~7d),天然地震面波成像也显示了同样的相速度分布特征(余大新等,2015).我们收集了该区新生代火山和火成岩出露的资料(Whitford-Stark , 1987;Barry et al., 2003,如图7中绿色块体对应的位置),区内发育有中戈壁火山和Bus-obo火山,火成岩主要出露于研究区中部地区,这可能暗示中戈壁地区的低速可能与区内新生代火山活动有关.前人研究表明,蒙古中南部地区位置分散、小体积的火山作用已经间歇的发生并跨越了30 Ma的时间.伴有长期间歇式火山作用的板内火山的形成机理很难确定,很重要的原因是该区大地拉张、高原隆起、岩浆作用本身发生的时间以及是否存在地壳弱化很难确定(Barry et al., 2003).探讨火山岩浆来源于地壳还是地幔,将有助于判断区内火山的形成机理.图7a~7d显示,在中戈壁火山西缘,一直都有一个很明显的低速区.该低速区内有CM20、CM32和CM33三个台站(图7中黑色三角).为了排除可能是由于仪器问题导致速度较低,我们做了如下测试:从6 s~30 s,分别去除这三个台中其中任一台站、任二台站的频散资料,再进行2D的频散反演.得到的结果仍无一例外地有该低速区明显的展现,表明该低速区是比较可靠的.30 s的相速度分布主要反映了壳幔过渡带(~45 km)的S波速度的变化情况,可能暗示中戈壁火山的岩浆至少来源于上地幔顶部(~45 km).体波成像研究(张风雪等,2014)虽然没有给出浅部结构信息,但在较深深度(>100 km)切片上,该火山下方显示有深达300 km的低速异常,认为该低速异常可能与杭爱山地幔柱或者杭爱山下方的地幔对流(熊熊等,2010)有关.对于Bus-obo火山,结合本研究和体波成像的结果(张风雪等,2014),该火山跟中戈壁火山一样从浅到深(~200 km)都有低速异常存在.因此,区内火山跟大多数板内火山一样,属热点型火山,西部杭爱山下方的地幔对流上升可能是岩浆活动的动力.

图9 研究区近2年来的地震活动性和周期15 s的瑞雷波相速度分布图的对比黑色圆点为地震,震级大于2.0.Fig.9 Seismicity in recent two years overlapped with phase velocity maps at period of 15 s in the study region The black solid dots represent earthquakes with magnitude great than 2.0.
5.3 杭爱—肯特山盆地
我们注意到,北部杭爱—肯特山盆地(F2以北地区)从6~30 s一直显示为明显的高速.我们收集了研究区震级大于2.0级的地震目录.因属于小震,其定位精度依赖于中蒙台阵的观测资料,故选取了台阵观测期即2011年8月至2013年7月间,蒙古天文与地球物理研究中心发布的地震目录.关于该目录中的震源深度,平均约为3 km.鉴于是小震,其深度的确定可能存在较大误差,但基本可以认为是小于15 km的浅源地震.周期15 s的瑞雷波相速度对区内15~25 km深度范围内的S波速度结构较敏感,在这个深度范围内,基本可以排除沉积层和地壳厚度对相速度分布的影响.从图9可以看出,杭爱—肯特山地区的地震活动性较南部地区弱,揭示了该地区稳定地块的性质.事实上,在中国大陆内部,地震活动性较弱的鄂尔多斯、四川盆地等稳定块体下方,中等周期(15~30 s)的相速度也表现为高速异常(Yang et al.,2010;李昱等,2010).时间跨度为2年的地震目录,也许并不能完全说明该地区的地震活动性,但同样有一定的参考意义.
需要特别指出的是,图7(a、b、c、d)在断层F2南北两侧,高、低速界限较为分明,甚至比MML两侧的速度差异更明显.天然地震面波成像也得到相类似的相速度分布特征(余大新等,2015).地质学上认为,晚古生代至晚中生代,西伯利亚板块与阿穆尔板块发生了碰撞,导致古蒙古—鄂霍茨克海逐渐闭合消亡.但关于闭合的具体地质年代和位置,地质学上目前仍无定论(Zonenshain et al., 1991;Zorin,1999;Badarch et al., 2002;Parfenov et al., 2010;Yang et al., 2014).因受观测资料所限,地球物理学上也没有关于其闭合位置的明确证据.通过对比我们发现,蒙古—鄂霍茨克缝合线所处的位置与F2十分靠近,且二者走向一致(图1).结合F2以北速度高、以南速度低的结果,我们推测,晚古生代至晚中生代,东南部强度较小的阿穆尔板块与西北部坚硬的西伯利亚板块碰撞,发生了类似”剪刀式”的闭合(Badarch et al, 2002).这可能暗示F2南北两侧十分显著的相速度差异,可能跟古蒙古—鄂霍茨克海的闭合有关.换言之,速度分布的陡变带(F2)可能是古蒙古—鄂霍茨克海闭合的前缘所在.当然,这一结论还需要结合更多地质、地球物理学研究加以斟酌和推敲.
6 结论
中蒙地震流动观测台阵(CMSA)首次获得了蒙古中南部地区较为密集的地震观测资料.本文利用该台阵69个台站记录的垂直向连续资料,通过互相关运算计算了台站间的经验格林函数,采用基于连续小波变换的频时分析方法提取了台站间的基阶瑞雷波相速度频散曲线,并通过2D反演获得了蒙古中南部地区周期6~30 s瑞雷波的相速度分布图,主要得到如下结论:
(1)利用台站密集分布的CMSA观测资料,我们得到了蒙古中南部地区周期6~30 s瑞雷波的高分辨(0.5°×0.5°)的相速度分布图.浅表至上地幔顶部(~50 km以浅)深度范围内,蒙古中南部地区的瑞雷波相速度分布的横向差异较小(相对变化~±2%).揭示了该地区地壳上地幔S波速度结构存在并不显著的横向非均一性;
(2)不同周期的基阶瑞雷波的相速度分布图较好地反映了不同深度范围的S波速度分布特征.短周期(如6 s)的相速度分布与地表地质构造具有明显的相关性,北部山区显示为高速,南部盆地显示为低速.随着周期的增大(如15 s, 20 s),地形的控制作用相对减弱.较长周期(如30 s)的相速度分布与地壳厚度相关.蒙古主构造线两侧相速度分布有明显差异,暗示其不仅是地表地形和构造的分界线,而且还是地壳结构的分界线.
(3)本研究与天然地震面波成像得到的相速度分布相比,在整体上具有相似的高低速分布特征,但相速度的绝对速度值略微偏低(~1%).6~30 s中戈壁一直呈现为低速,可能与新生代火山活动有关;研究区北部杭爱山—肯特盆地一直显示为相对的高速,与该区具有较老、稳定的地层有关.
本文获取了蒙古中南部地区短周期瑞雷波的相速度分布,得到了对该地区浅部结构的认识,但若要提供更好的关于壳幔结构的约束,还需开展S波速度的深度反演.我们已获得了该地区的天然地震面波频散资料.将噪声和天然地震面波资料结合,反演研究区的三维地壳上地幔S波速度结构和方位各向异性,是我们下一步将要开展的工作.
致谢 感谢俄罗斯圣彼得堡大学 T. B. Yanovskaya教授为我们提供了面波层析成像程序,同时也感谢蒙古科学院天文与地球物理研究中心和中国地震局地球物理研究所参与中蒙流动地震台站的勘选、布设、巡台维护和数据预处理的相关人员.
Badarch G, Cunningham W D, Windley B F. 2002. A new terrane subdivision for Mongolia: implications for the Phanerozoic crustal growth of Central Asia.J.AsianEarthSci., 21(1): 87-110.
Barruol G, Deschamps A, Déverchère J, et al. 2008. Upper mantle flow beneath and around the Hangay dome, Central Mongolia.EarthandPlanetaryScienceLetters, 274(1-2): 221-233, doi: 10.1016/j.epsl.2008.07.027.
Barry T L, Saunders A D, Kempton P D, et al. 2003. Petrogenesis of cenozoic basalts from Mongolia: evidence for the role of Asthenospheric versus Metasomatized lithospheric Mantle sources.J.Petrol., 44(1): 55-91.
Bensen G D, Ritzwoller M H, Barmin M P, et al. 2007. Processing seismic ambient noise data to obtain reliable broad-band surface wave dispersion measurements.Geophys.J.Int., 169(3): 1239-1260.Bushenkova N, Tychkov S, Koulakov I. 2002. Tomography on PP-P waves and its application for investigation of the upper mantle in central Siberia.Tectonophysics, 358(1-4): 57-76.
Chen Y L, Li D P, Liu C Z, et al. 2013. The formation and evolution of the Central Asian orogenic belt: the evidence from Zircon U-Pb ages and Hf isotopes and whole rock Nd isotopic composition.ActaGeologicaSinica, 87(Suppl.): 374-376.
Cunningham W D. 2001. Cenozoic normal faulting and regional doming in the southern Hangay region, Central Mongolia: implications for the origin of the Baikal rift province.Tectonophysics, 331(4): 389-411.Cunningham D. 2005. Active intracontinental transpressional mountain building in the Mongolian Altai: Defining a new class of orogen.EarthandPlanetaryScienceLetters, 240(2): 436-444, doi: 10.1016/j.epsl.2005.09.013.
Delvaux D, Moeys R, Stapel G, et al. 1995. Palaeostress reconstructions and geodynamics of the Baikal region, Central Asia, Part I. Palaeozoic and Mesozoic pre-rift evolution.Tectonophysics, 252(1-4): 61-101.
Delvaux D, Moeys R, Stapel G, et al. 1997. Paleostress reconstructions and geodynamics of the Baikal region, central Asia: Part 2. Cenozoic rifting.Tectonophysics, 282(1-4): 1-38.
Ditmar P G, Yanovskaya T B. 1987. A generalization of Backus-Gilbert method for estimation of lateral variations of surface wave velocities.Phys.SolidEarth.Izvestia.Acad.Sci.U.S.S.R., 3(6): 470-477.
Fullea J, Lebedev S, Agius M R, et al. 2012. Lithospheric structure in the Baikal-central Mongolia region from integrated geophysical-petrological inversion of surface-wave data and topographic elevation.Geochem.Geophys.Geosyst., 13(1): Q0AK09-1-Q0AK09-20, doi: 10.1029/2012GC004138.
Gao S, Davis P M, Liu H, et al. 1994. Seismic anisotropy and mantle flow beneath the Baikal rift zone.Nature, 371(6493): 149-151.
Gao S, Davis P M, Liu H, et al. 1997. SKS splitting beneath continental rift zones.J.Geophys.Res., 102(B10): 22781-22797.
Gao S S, Liu K H, Davis P M, et al. 2003. Evidence for small-scale mantle convection in the upper mantle beneath the Baikal rift zone.J.Geophys.Res., 108(B4): 2194, doi: 10.1029/2002JB002039. He J, Wu Q J, Gao M T, et al. 2014 Crustal structure and Poisson ratio beneath the central and southern Mongolia derived from receiver functions.ChineseJournalofGeophysics(in Chinese), 57(7): 2386-2394, doi: 10.6038/cjg20140732.He Z Q, Ye T L, Ding Z F. 2009. Surface wave tomography for the phase velocity in the northeastern part of North China.ChineseJ.Geophys. (in Chinese), 52(5): 1233-1242, doi: 10.3969/j.issn.0001-5733.2009.05.012.
Kennett B L N, Engdahl E R, Buland R. 1995. Constraints on seismic velocities in the Earth from traveltimes.Geophys.J.Int., 122(1): 108-124.
Kröner A, Hegner E, Lehmann B, et al. 2008. Palaeozoic arc magmatism in the Central Asian Orogenic Belt of Kazakhstan: SHRIMP zircon ages and whole-rock Nd isotopic systematics.JournalofAsianEarthSciences, 32(2-4): 118-130.
Khutorskoy M D, Yarmoluk V V. 1989. Heat flow, structure and evolution of the lithosphere of Mongolia.Tectonophysics, 164(2-4): 315-322.
Koulakov I, Tychkov S, Bushenkova N, et al. 2002. Structure and dynamics of the upper mantle beneath the Alpine-Himalayan orogenic belt from teleseismic tomography.Tectonophyiscs, 358(1-4): 77-96.
Lebedev S, Meier T, Van der Hilst R. 2006. Asthenospheric flow and origin of volcanism in the Baikal rift area.EarthPlanet.Sci.Lett., 249(3-4): 415-424, doi: 10.1016/j.epsl.2006.07.007.
Lesne O, Calais E, Déverchère J, et al. 2000. Dynamics of intracontinental extension in the north Baikal rift from two-dimensional numerical deformation modeling.J.Geophys.Res., 105(B9): 21727-21744.
Li Y, Yao H J, Liu Q Y, et al. 2010. Phase velocity array tomography of Rayleigh waves in western Sichuan from ambient seismic noise.ChineseJ.Geophys. (in Chinese), 53(4): 842-852, doi: 10.3969/j.issn.0001-5733.2010.04.009.
Li Y H, Wu Q J, Pan J T, et al. 2012. S-wave velocity structure of northeastern China from joint inversion of Rayleigh wave phase and group velocities.Geophys.J.Int., 190(1): 105-115.
Li Y H, Wu Q J, Pan J T, et al. 2013. An upper-mantle S-wave velocity model for East Asia from Rayleigh wave tomography.EarthandPlanetaryScienceLetters, 377-378: 367-377.
Lin F C, Moschetti M P, Ritzwoller M H. 2008. Surface wave tomography of the western United States from ambient seismic noise: Rayleigh and Love wave phase velocity maps.Geophys.J.Int., 173(1): 281-298, doi: 10.1111/j.1365-246X.2008.03720.x.
Molnar P, Tapponnier P. 1975. Cenozoic tectonics of Asia: effects of a continental collision.Science, 189(4201): 419-426.
Pan J T, Wu Q J, Li Y H, et al. 2011. Rayleigh wave tomography of the phase velocity in North China.ChineseJ.Geophys. (in Chinese), 54(1): 67-76, doi: 10.3969/j.issn.0001-5733.2011.01.008.
Pan J T. 2012. High-resolution Rayleigh wave phase velocity maps from ambient noise tomography in North China.EarthquakeSci., 25(3): 241-251.
Pan J T, Wu Q J, Li Y H, et al. 2014. Ambient noise tomography in northeast China.ChineseJ.Geophys. (in Chinese), 57(3): 812-821, doi: 10.6038/cjg20140311.
Parfenov L M, Berzin N A, Badarch G, et al. 2010. Tectonic and metallogenic model for Northeast Asia. ∥ Metallogenesis and Tectonics of Northeast Asia. U. S. Geological Survey Professional Paper 1765-9, 1-55. Petit C, Déverchère J, Houdry F, et al. 1996. Present-day stress field changes along the Baikal rift and tectonic implications.Tectonics, 15(6): 1171-1191.
Petit C, Déverchère J, Calais E, et al. 2002. Depp structure and mechanical behavior of the lithosphere in the Hangai-Hövsgöl region, Mongolia: New constraints from gravity modeling.EarthandPlanetaryScienceLetters, 197(3-4): 133-149.
Ritzwoller M H, Levshin A L. 1998. Eurasian surface wave tomography: Group velocities.J.Geophys.Res., 103(B3): 4839-4878.
Rojas-Agramonte Y, Kr?ner A, Demoux A, et al. 2011. Detrital and xenocrystic zircon ages from Neoproterozoic to Palaeozoic arc terranes of Mongolia: significance for the origin of crustal fragments in the Central Asian Orogenic Belt.GondwanaResearch, 19(3): 751-763.
Shapiro N M, Campillo M, Stehly L, et a1. 2005. High-resolution surface-wave tomography from ambient seismic noise.Science, 307(5715): 1615-1618.
Si S K, Tian X B, Zhang H S, et al. 2013. Prevalent thickening and local thinning of the mantle transition zone beneath the Baikal rift zone and its dynamic implications.ScienceChina:EarthSciences, 56(1): 31-42, doi: 10.1007/s11430-012-4547-4.
Tian X B, Teng J W, Zhang H S, et al. 2011. Structure of crust and upper mantle beneath the Ordos Block and the Yinshan Mountains revealed by receiver function analysis.PhysicsoftheEarthandPlanetaryInteriors, 184: 186-193, doi: 10.1016/j.pepi.2010.11.007.
Whitford-Stark J L. 1987. A survey of Cenozoic volcanism on mainland Asia.GSASpecialPapers, 213: 1-74.
Windley B F, Alexeiev D, Xiao W J, et al. 2007. Tectonic models for accretion of the Central Asian Orogenic Belt.JournaloftheGeologicalSociety, 164(1): 31-47.
Wu F T, Levshin A L. 1994. Surface-wave group velocity tomography of East Asia.Phys.Earth.Plannet.Inter., 84(1-4): 59-77.Wu Q J, Zheng X F, Pan J T, et al. 2009. Measurement of interstation phase velocity by wavelet transformation.EarthquakeSci., 22(4): 425-429.Xiao W J, Windley B F, Hao J, et al. 2003. Accretion leading to collision and the Permian Solonker suture, Inner Mongolia, China: termination of the central Asian orogenic belt.Tectonics, 22(6): 1069.Xiong X, Shan B, Wang J Y, et al. 2010. Small-scale upper mantle convection beneath the Mongolia-Baikal Rift Zone and its geodynamic significance.ChineseJ.Geophys. (in Chinese), 53(7): 1594-1604, doi: 10.3969/j.issn.00015733.2010.07.010.
Yang Y J, Zheng Y, Chen J, et al. 2010. Rayleigh wave phase velocity maps of Tibet and the surrounding regions from ambient seismic noise tomography.Geochem.Geophys.Geosyst., 2010, 11(8): Q08010, doi: 10.1029/2010GC003119. Yang Y T, Guo Z X, Song C C, et al. 2014. A short-lived but significant Mongol-Okhotsk collisional orogeny in latest Jurassic-earliest Cretaceous.GondwanaResearch, doi: 10.1016/j.gr.2014.09.010.Yanovskaya T B, Ditmar P G. 1990. Smoothness criteria in surface wave tomography.Geophys.J.Int., 102(1): 63-72.
Yao H J, Van der Hilst R D, De Hoop M V. 2006. Surface-wave array tomography in SE Tibet from ambient seismic noise and two-station analysis—I. Phase velocity maps.Geophys.J.Int.,166(2): 732-744.
Yi G X, Yao H J, Zhu J S, et al. 2008. Rayleigh-wave phase velocity distribution in China continent and its adjacent regions.ChineseJournalofGeophysics, 51(2): 402-411.
Yu D X, Wu Q J, Li Y H, et al. 2015. Rayleigh wave tomography of the phase velocity in the central and southern Mongolia.ChineseJ.Geophys. (in Chinese), 58(1): 134-142, doi: 10.6038/cjg20150111.
Zhang F X, Wu Q J, Li Y H, et al. 2014. The P wave velocity structure of the upper mantle beneath the Central and Southern Mongolia area.ChineseJ.Geophys. (in Chinese), 57(9): 2790-2801, doi: 10.6038/cjg20140906.
Zhang S H, Gao R, Li H Y, et al. 2014. Crustal structures revealed from a deep seismic reflection profile across the Solonker suture zone of the Central Asian Orogenic Belt, northern China: An integrated interpretation.Tectonophysics, 612-613: 26-39.
Zhao D P, Lei J S, Inoue T, et al. 2006. Deep structure and origin of the Baikal rift zone.EarthandPlanetaryScienceLetters, 243(3-4): 681-691.
Zheng S H, Sun X L, Song X D, et al. 2008. Surface wave tomography of China from ambient seismic noise correlation.Geochem.Geophys.Geosyst., 9(5): Q05020, doi: 10.1029/2008GC001981.
Zheng Y, Shen W S, Zhou L Q, et al. 2011. Crust and uppermost mantle beneath the North China Craton, northeastern China, and the Sea of Japan from ambient noise tomography.J.Geophys.Res., 116(B12); B12312, doi: 10.1029/2011JB008637.Zonenshain L P, Kuzmin M I, Natapov L M, et al. 1991. Geology of the USSR: A Plate-Tectonic Synthesis. Geodynamic Series American Geophysical Union 21, 1-242.
Zorin Y A. 1999. Geodynamics of the western part of the Mongolia-Okhotsk collisional belt, Trans-Baikal region (Russia) and Mongolia.Tectonophysics, 306(1); 33-56.
Zorin Y A, Mordvinova V V, Turutanov E K, et al. 2002. Low seismic velocity layers in the Earth′s crust beneath Eastern Siberia (Russia) and Central Mongolia: Receiver function data and their possible geological implication.Tectonophysics, 359(3-4): 307-327, doi: 10.1016/S0040-1951(02)00531-0.
Zorin Y A, Turutanov E K, Mordvinova V V, et al. 2003. The Baikal rift zone: The effect of mantle plumes on older structure.Tectonophysics, 371(1-4): 153-173.
附中文参考文献
陈岳龙, 李大鹏, 刘长征等. 2013. 中亚造山带的形成与演化历史: 来自锆石U-Pb年龄与Hf同位素及全岩Nd同位素组成的证据. 地质学报, 87(supp.): 374-376.
何静, 吴庆举, 高孟潭等. 2014. 利用接收函数方法研究蒙古中南部地区地壳结构. 地球物理学报, 57(7): 2386-2394, doi: 10.6038/cjg20140732.
何正勤, 叶太兰, 丁志峰. 2009. 华北东北部的面波相速度层析成像研究. 地球物理学报, 52(5): 1233-1242, doi: 10.3969/j.issn.0001-5733.2009.05.012.
李昱, 姚华健, 刘启元等. 2010. 川西地区台阵环境噪声瑞利波相速度层析成像. 地球物理学报, 53(4): 842-852, doi: 10.3969/j.issn.0001-5733.2010.04.009.
潘佳铁, 吴庆举, 李永华等. 2011. 华北地区瑞雷面波相速度层
析成像. 地球物理学报, 54(1): 67-76, doi: 10.3969/j.issn.0001-5733.2011.01.008.
潘佳铁, 吴庆举, 李永华等. 2014. 中国东北地区噪声层析成像. 地球物理学报, 57(3): 812-821, doi: 10.6038/cjg20140311.
熊熊, 单斌, 王继业等. 2010. 蒙古—贝加尔地区上地幔小尺度对流及地球动力学意义. 地球物理学报, 53(7): 1594-1604, doi: 10.3969/j.issn.00015733.2010.07.010.
易桂喜, 姚华建, 朱介寿等. 2008. 中国大陆及邻区Rayleigh面波相速度分布特征. 地球物理学报, 51(2): 402-411.
余大新, 吴庆举, 李永华等. 2015. 蒙古中南部地区面波相速度层析成像. 地球物理学报, 58(1): 134-142, doi: 10.6038/cjg20150111.
张风雪, 吴庆举, 李永华等. 2014. 蒙古中南部地区的上地幔P波速度结构. 地球物理学报, 57(9): 2790-2801, doi: 10.6038/cjg20140906.
(本文编辑 刘少华)
Ambient noise tomography in central-south Mongolia
PAN Jia-Tie1,2, WU Qing-Ju1,2, LI Yong-Hua1,2, YU Da-Xin1,3, GAO Meng-Tan1, M. Ulziibat4, S. Demberel4
1InstituteofGeophysics,ChinaEarthquakeAdministration,Beijing100081,China2KeyLaboratoryofSeismicObservationandGeophysicalImaging,InstituteofGeophysics,ChinaEarthquakeAdministration,Beijing100081,China3FirstCrustMonitoringandApplicationCenter,ChinaEarthquakeAdministration,Tianjin300180,China4ResearchCenterofAstronomy&GeophysicsofMongolian,AcademyofScience,Ulaanbaatar210351,Mongolia
Currently, the detailed structure beneath central-south Mongolia (103.5°E—111.5°E, 43°N—49°N) is poorly known from previous studies. In order to investigate the detailed structure of the study region, 69 portable broadband stations were deployed in central-south Mongolia from August 2011 to July 2013. This cooperation project in Mongolia provided dense seismic array data for the area for the first time.Ambient noise tomography is increasingly used in studying the structure of the crust and upper mantle. We calculated the inter-station empirical green functions (EGFs) from cross-correlation using the vertical component of the continuous data recorded by these 69 broadband seismic stations from August 2011 to July 2013 in south-central Mongolia. In addition, a time-frequency analysis based on a continuous wavelet transform was used to extract the Rayleigh wave phase velocity dispersion curves. Through quality control and manual screening, we finally obtained a total number of 1478 phase velocity dispersion curves at periods ranging from 6 s to 30 s. The Ditmar & Yanovskaya method was utilized to obtain phase velocity maps of the Rayleigh waves at periods of 6~30 s in the study area.Checkerboard tests showed that the tomographic results had a high resolution of 0.5° × 0.5°. The results revealed that the phase velocity maps of the Rayleigh waves had a perturbation of about ±2%. A phase velocity map with a short period (e.g., 6 s) was imaged, with high-speed anomalies corresponding to the mountain ranges in the north and low-speed anomalies coinciding with the sedimentary basin and Gobi Desert in the central-south region. As the period (15 s, 20 s) increased, the imaging still showed a high-velocity zone (HVZ) in the north and low-velocity zone (LVZ) in the middle. The phase velocity maps with a long period (e.g., 30 s) showed an HVZ in the north that expanded further to the south than those with shorter periods (e.g., 15 s and 20 s), which is associated with the thinner crust in the south compared to that in the north. On those maps with long periods (e.g., 20 s, 30 s), there were significant differences between the northern and southern sides of the main Mongolian lineament (MML). On maps with periods ranging from 6 s to 30 s, the middle Gobi area was imaged with an obvious low speed, while the Hangay-Hentey basin was always imaged with an obvious high velocity in the north. We compared the tomographic result at 15 s with that from the classic two-station method using earthquake data, and a phase velocity difference of only about 1% was found.The S-wave velocity structure of the crust and upper mantle showed weekly lateral heterogeneity (a perturbation of about ±2%) in central-south Mongolia. The phase velocity distribution at a short period (e.g., 6 s) was effectively related to the geology tectonic units on the surface. However, the effect of the phase velocity distribution controlled by the surface geological structure was significantly weaker as the periods increased (e.g., 15 s, 20 s). In the phase velocity maps with a long period (e.g., 30 s), the phase velocity distribution was mainly associated with the crustal thickness. For the MML, this was not only a boundary for the topography and tectonics, but also for the crustal structure. The middle Gobi area always showed an LVZ, which could have been related to Cenozoic volcanism, while the Hangay-Hentey basin was always imaged with an HVZ, which could have been associated with the old, stable layers in the north.
Central-south Mongolia; Ambient noise tomography; Rayleigh wave; Phase velocity; High resolution
科技部国际合作专项《远东地区地磁场、重力场及深部构造观测与模型研究》(2011DFB20210)和国家自然科学基金(41104029)共同资助.
潘佳铁,男,1983年生,中国地震局地球物理研究所助理研究员,主要从事面波层析成像研究.E-mail: panj151@gmail.com
10.6038/cjg20150832.
10.6038/cjg20150832
P631
2015-07-06,2015-07-18收修定稿
潘佳铁, 吴庆举, 李永华等. 2015. 蒙古中南部地区噪声层析成像.地球物理学报,58(8):3009-3022,
Pan J T, Wu Q J, Li Y H, et al. 2015. Ambient noise tomography in central-south Mongolia.ChineseJ.Geophys. (in Chinese),58(8):3009-3022,doi:10.6038/cjg20150832.
