秦岭中、西部地区温度变化的树木年轮记录
2015-02-28包光,刘娜,,刘禹,
包 光,刘 娜,,刘 禹,
doi:10.7515/JEE201503003
秦岭中、西部地区温度变化的树木年轮记录
包 光1,2,刘 娜1,2,3,刘 禹2,3
(1.宝鸡文理学院 地理与环境学院 陕西省灾害监测与机理模拟重点实验室,宝鸡721013;
2.中国科学院地球环境研究所 黄土与第四纪地质国家重点实验室,西安710061;
3.西安交通大学 人居环境与工程学院 地球环境科学系,西安710049)
使用相关系数、气候要素异常分布及空间相关等方法,对比分析了秦岭中部和西部不同树种不同树轮参数指标的气候响应差异特征。结果表明,秦岭中部分水岭地区的太白红杉树轮宽度差值年表与秦岭西部石门山地区油松早材密度标准化年表均保留了生长季前期(特别是5月)的温度变化信号。两个年表能够记录区域尺度的极端高、低温度年份,且异常高温年份反映了研究区域及周边大范围的干旱状况。研究结果显示了在秦岭地区结合多树种多树轮参数指标开展区域多时空尺度的气候变化集成研究具有很大的潜力和价值。
秦岭;温度变化;树轮参数;极端气候
秦岭位于我国中部,作为中国的南北地理分界线,同时也是亚热带与暖温带、湿润与半湿润气候带的分界线(中国科学院《中国自然地理》编辑委员会,1985;康慕谊和朱源,2007),对气候变化的响应非常敏感(缪启龙等,2009;周旗等,2011)。在20世纪全球变暖的大背景条件下,秦岭及其周边地区气候要素的变化及其可能的影响备受关注(e.g.延军平和郑宇,2001;丁敏和黄春长,2003)。作为全球变化的主要研究手段,树木年轮以其精确的高分辨率定年、地理分布范围广阔、样本易于获取等特点,在历史时期气候变化研究中发挥着重要的作用(Bradley,2010)。近年来,使用树木年轮开展秦岭地区的气候变化研究取得了宝贵的成果。例如秦岭东部华山的研究结果表明,当年4月温度和4 —7 月(特别是5—6 月)降水是华山松径向生长的主要限制因子,同时与6月温度同样关系紧密(邵雪梅和吴祥定,1994),由此分别重建了华山4 —7 月和5—6 月的降水,并对重建结果进行了比较分析 (Hughes et al,1994)。通过对秦岭南北坡树木生长与气候因子的相关响应差异研究表明,北坡的树木径向生长可以很好地记录当年初夏生长季的温度变化,而南坡的树木则明显地响应了冬半年的温度变化信号(Liu et al,2009);并重建了秦岭中段分水岭地区过去200年1—7月平均温度的变化历史(刘禹等,2009)。最近,依据秦岭中段分水岭地区温度敏感的太白红衫年表,结合西安地区的旱涝指数序列研究发现,树轮指数高值对应了区域的极端干旱事件,低树轮指数明显表征了极端湿润时段,这表明秦岭高山生长的树木对于温度和降水信号的响应范围可以涵盖西安等关中地区,具有表征较大范围区域气候变化的能力(Liu et al,2013)。以上研究表明,树木年轮资料是研究和恢复秦岭及其周边地区环境演变与气候变化的有效方式。然而,基于不同树种、不同树木年轮指标分析秦岭中、西部的温度变化特征尚未见报道,本文将尝试从年际尺度的极端气候事件探讨秦岭中、西部及其邻近区域的冷暖变化特征,以期为秦岭整体区域的多时空尺度的全方位研究提供新的依据。
1 材料与方法
1.1 气象数据
选用西安(34°18′N,108°56′E,海拔397.5 m)和佛坪气象站(33°31′N,107°59′E,海拔827.2 m)两站逐年对应月份的平均数据代表秦岭中部的气候特征,时段为1957—2005,天水气象站(34°35′N,105°45′E,海拔1141.7 m)代表秦岭西部地区的气候变化记录,时段为1951—2003,包括月降水量、月平均温度以及月平均最高温度。多年逐月平均温度和降水量分布显示,秦岭中部和西部地区气候要素变化具有相似的夏季 (6—8月) 雨热同期,冬季寒冷干燥(12月、1—2月)的特点。其中,7月的温度和降水均为全年最高,高温及高降水量集中于7—9月份(图1)。气象数据来源于中国气象科学数据共享服务网(http://cdc.nm ic.cn)。
1.2 树木年轮数据及方法

图1 多年逐月平均温度(实心圆),平均最大温度(空心圆)和降水量(实心柱)分布(a) 西安-佛坪两气象站平均(1957—2005);(b) 天水气象站(1951—2003)Fig.1 Monthly mean temperature (f lled dot),maximum temperature (un f lled dot) and monthly precipitation (f lled bar) from January to December for the averaged data of both Xi'an and Foping stations (1957—2005) (a) and that for Tianshui station (1951—2003) (b),respectively
使用陕西省秦岭顶分水岭地区的太白红杉(Larix chinensis)树轮宽度年表代表秦岭中部,包括标准化年表(QLDstd)和差值年表(QLDres)(刘禹等,2009)。选用甘肃省天水地区石门山油松(Pinus tabulaformis)早材密度标准化年表(SMSewd)代表秦岭西部,该年表重建了天水5—6月平均最高温度变化(Chen and Yuan,2014)。所有树轮样本的定年质量控制和年表生成均使用COFECHA(Holmes,1983)和ARSTAN(Cook and Kairiukstis,1990)软件完成。详细的参数设置及表述参见文献刘禹等(2009)、Chen and Yuan(2014)。树轮年表与气候要素的响应关系使用Pearson相关系数确定(Cook and Kairiukstis,1990),气候要素时空变化的范围和幅度使用空间相关分析确定(http://climexp.knm i.nl)。
2 结果与讨论
2.1 生长-气候响应分析
相关分析结果表明,温度是所选取的各样点树木生长的主要限制因子(表1)(刘禹等,2009;Chen and Yuan,2014)。在p<0.05的显著性水平上,秦岭中部地区QLDstd年表与当年1—3月、5—7月的平均温度显著正相关,而秦岭西部地区SMSewd年表则与生长季前一年11月、当年3月以及5—6月的平均温度表现为正相关关系。从相关月份的数量和连续相关的时间窗口长度来看,与SMSewd年表相比,QLDstd年表对温度信号的响应更为敏感。其原因主要在于,QLDstd年表的特征参数是太白红杉每年树木径向生长的年轮宽度,涉及的气候要素包含生长季当年及前一年的持续影响,更多地反映了年际尺度的低频气候信号;而SMSewd年表的特征参数是油松生长季早期木材形成时细胞个体的密度,直接反映了5—6月细胞生理活动同期的温度变化,包含了较多的季节性高频信号(Chen and Yuan,2014),类似的气候响应特征被秦岭东部华山地区的最小早材密度年表证实(Hughes et al,1994)。与标准化年表(QLDstd)不同,去除自相关趋势的差值年表(QLDres)保留了更多的季节或单月的气候信号,其仅与当年5月平均温度显著正相关(p < 0.05)证实了该年表的高频气候信息保存能力。鉴于油松SMSewd年表与单月的平均温度和平均最高温度显著正相关也都同时出现在当年生长季5月(见图4,Chen and Yuan,2014),我们使用秦岭中部太白红杉差值年表(QLDres)和秦岭西部早材密度标准化年表(SMSewd)重建的天水5—6月平均最高温度序列进行后续对比分析。

表1 树轮年表与上年9月至当年8月逐月平均温度的相关结果(SMSewd代表秦岭西部油松早材密度标准化年表;QLDres代表秦岭中部太白红杉树轮宽度差值年表;QLDstd代表秦岭中部太白红杉树轮宽度标准化年表;阴影区域表示p < 0.05的显著性水平)Table 1 Correlations of three tree-ring chronologies and the monthly mean temperature from the previous September to current August (SMSewd indicated the earlywood density standard chronology of Pinus tabulaformis in western Qinling Mountains;QLDres and QLDstd referred to the ring-w idth residual chronology and standard chronology of Larix chinensis in central Qinling Mountains,respectively;shade area indicated the signi f cant level at p < 0.05)
2.2 秦岭中、西部年际尺度极端气候事件
秦岭中部太白红杉差值年表(QLDres)的平均敏感度为0.29,一阶自相关系数为0.05,样本所有序列间相关系数为0.63,信噪比为8.44,样本总体代表性为0.89,第一主成分方差解释量为64.46%,子样本信号强度大于0.80的起始年份为1814(刘禹等,2009),这些统计特征表明QLDres年表适合于树轮气候学研究的需要。极端气候事件往往对区域的社会经济活动产生重要的影响,我们使用序列平均值(Mean)加减一个标准差(SD)来定义极端温度事件,即> Mean+1SD为极端高温年,< Mean-1SD为极端低温年。计算结果表明,在共同的1814—2007年间,QLDres年表分别出现26个高温年(> 0.989+0.243=1.232)和25个低温年(< 0.989-0.243= 0.746);早材密度标准化年表(SMSewd)重建的天水5—6月平均最高温度序列分别出现28个高温年(>25.582+0.674=26.256)和28个低温年(< 25.582-0.674=24.908)。相近数量的高、低温极端年份表明,两个树轮年表有效地记录了秦岭中部和西部地区温度变化的波动状况。但是由于采样点不同的海拔高度和周边多变的下垫面地形的作用,两个序列间极端高温年份同时出现在1869、1908、1926、2000和2007年,共同的极端低温年份为1819、1905、1906、1933、1948和1961年,其余多数极端年份并未同时出现,图2展示了极端年份的分布情况。4个极端的高温年份都出现在年代际尺度上相对高温时段1860s、 1920s、2000s,而高温年1908则出现在晚1900s—早1910s低温时段,这表明影响秦岭中、西部甚至更大范围的极端高温年份不只是在高温时期发生,亦可出现在低温时期,反映了秦岭地区较高的温度变化速率,是气候变化响应强烈的敏感区域。极端温度异常年份的空间范围分布场很好地再现了两个序列所代表的秦岭中、西部地区的温度变化特征(图3,Jones et al,2012)。其中,研究区域高温年份2000年5—6月平均温度正异常大于2℃,而低温年份1948年5—6月平均温度负异常幅度范围在-1.5~-0.5℃,极端年份的高、低温度差达3℃。
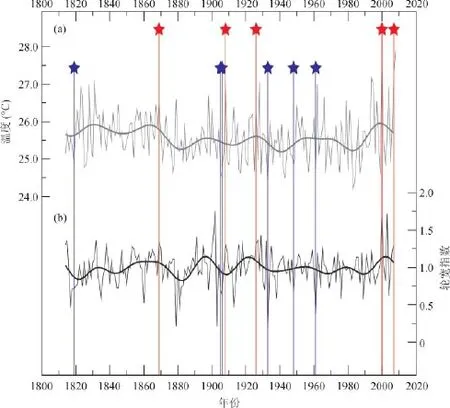
图 2 (a) 秦岭西部油松早材密度标准化年表(SMSewd)重建的天水5—6月平均最高温度与(b) 秦岭中部太白红杉树轮宽度差值年表(QLDres)对比(红色五角星表示共同的极端高温年;蓝色五角星表示共同的极端低温年;粗线为20年低通滤波序列指示年代际尺度的变化)Fig.2 Comparisons of (a) the mean May—June maximum temperature reconstruction based on earlywood density standard chronology of Pinus tabulaformis in western Qinling Mountains,and (b) ring-w idth residual chronology of Larix chinensis in central Qinling Mountains (red pentagram indicated the common years of extremely high temperature;blue one indicated extremely low temperature years;strong lines of 20-year low-f ltered data indicated decadal-scale variations)
先前的研究表明,秦岭地区温度敏感的树轮年表的高宽度值与区域旱涝指数的干旱值有很好的对应关系,表明高温条件影响区域的干旱变化强度(Liu et al,2013)。在2000和2007年两个序列共同的极端高温年份里,包括秦岭在内的陕西及周边地区均发生了严重的干旱。其中,2000年我国北方干旱范围广,持续时间长,春、夏连旱严重,西北东部和华北地区干旱主要发生在2—7月,甘肃春旱受灾面积达210.7万公顷,因土壤水分不足有11万公顷冬小麦死苗,陕西北部地区旱情达特大干旱标准;包括陕西、甘肃在内的12个省市区县级以上城市日缺水量超过635万m3,影响人口超过1500万人(http://www.weather.com.cn/science/ zhfy/gh/jdal/02/65192.shtm l)。2007年的极端春季干旱范围涉及陕西、甘肃东部、宁夏、内蒙古南部及华北大部分地区(http://www.weather.com.cn/ science/zhfy/gh/jdal/02/65195.shtm l)。1926年的极端高温年份也反映了同期的极端干旱事件,有研究表明,1920s 年代发生在我国北方大部分地区的特大干旱,亦伴随着温度偏高的情况(e.g.Liang et al,2006;Bao et al,2012a,2012b,2015;Yi et al,2012)。例如1926—1930逐年的干旱均与当年夏季温度正异常有直接关系(Yi et al,2012)。与NCDC格点数据(http://www.ncdc.noaa.gov/ temp-and-precip/ghcngridded-products.php)空间相关结果显示秦岭中、西部地区5—6月平均温度与同期华北、西北及周边区域的温度显著正相关,表明温度敏感的不同树种、不同树轮参数指标揭示的温度变化信号在一定程度上能够代表该区域大尺度的气候要素变化特征(图4)。

图 3 共同的极端高温年(a)2000年及(b)2007年和低温年(c)1948年及(d)1961年当年5—6月平均温度异常分布Fig.3 The mean May-June temperature anomaly of the common years of extremely high temperature(a) 2000 AD and (b) 2007 AD,and low temperature(c) 1948 AD and (d) 1961 AD
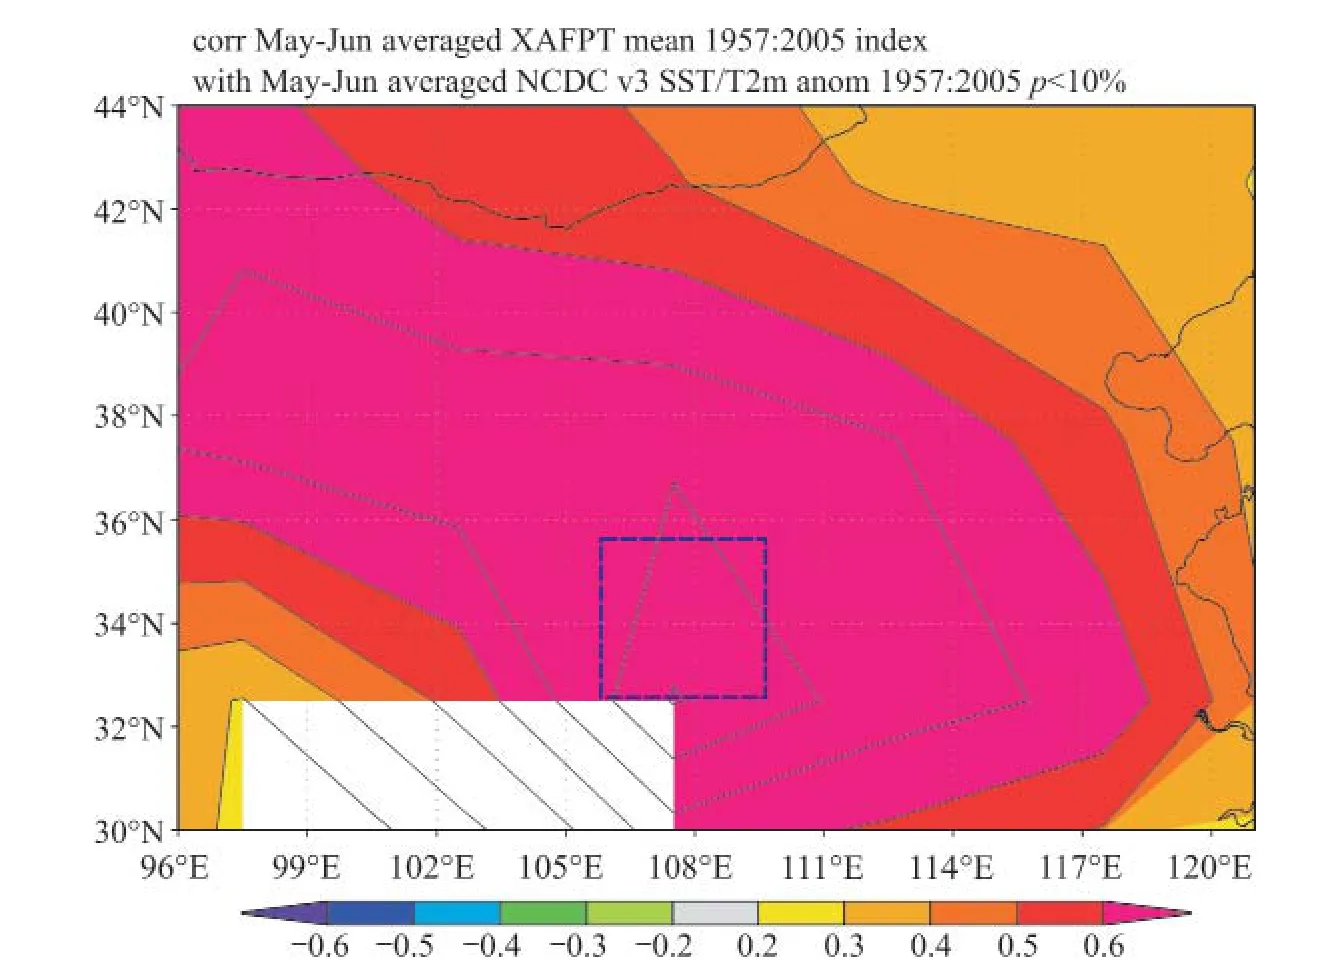
图 4 西安、佛坪两气象站5—6月平均温度与NCDC v3 SST/T2m 格点温度数据的空间相关(1957—2005),矩形框表示研究区域秦岭中、西部地区Fig.4 Spatial correlations between the mean May-June temperature of both Xi'an and Foping stations and NCDC v3 SST/T2m grid dataset during the period 1957—2005,rectangle indicated the study area of central and western Qinling Mountains
3 结论
秦岭中部太白红杉树轮宽度差值年表和秦岭西部油松早材密度标准化年表共同响应了生长季早期(特别是5月)平均温度变化信号。年表保留了区域尺度范围内共同的极端高、低温气候事件,且高温年份与大尺度的干旱灾害存在紧密联系。极端年份温度异常和空间相关结果表明不同树种、不同树木年轮指标的对比分析能够探讨秦岭中、西部及其周边地区的温度变化特征。本研究为基于多树种多树轮参数指标集成研究整个秦岭区域多时空尺度的气候变化提供了新的视角和论据。
丁 敏,黄春长.2003.秦岭北麓平原对全球变暖的响应及其对果业发展的影响研究[J].自然资源学报,18(2):235-239.[Ding M,Huang C C.2003.The influence of climatic warm ing on fruit produce in northern foot of Qinling Mountain [J].Journal of Natural Resources,18(2):235 - 239.]
康慕谊,朱 源.2007.秦岭山地生态分界线的论证[J].生态学报,27(7):2774-2784.[Kang M Y,Zhu Y.2007.Discussion and analysis on the geo-ecological boundary in Qinling Range [J].Acta Eco logica Sinica,27(7):2774-2784.]
刘 禹,刘 娜,宋慧明,等.2009.以树轮宽度重建秦岭中段分水岭地区1—7月平均气温[J].气候变化研究进展,5(5):260-265.[Liu Y,Liu N,Song H M,et al.2009.Reconstructed mean air temperature from January to July at the divide sampling site in the M id-Qinling Mountains w ith tree-ring w idths [J].Advances in Climate Change Research,5(5):260-265.]
缪启龙,丁园圆,王 勇.2009.气候变暖对中国亚热带北界位置的影响[J].地理研究,28(3):634-642.[M iao Q L,Ding Y Y,Wang Y.2009.Impact of climate warm ing on the northern boundary of subtropical zone of China [J].Geographical Research,28(3):634-642.]
邵雪梅,吴祥定.1994.华山树木年轮年表的建立[J].地理学报,49(2):174-181.[Shao X M,Wu X D.1994.Tree-ring chronologies for Pinus Armandi Franch from Huanshan,China [J].Acta Geographica Sinica,49(2):174-181.]
延军平,郑 宇.2001.秦岭南北地区环境变化响应比较研究[J].地理研究,20(5):576-582.[Yan J P,Zheng Y.2001.Acomparative study on environmental change response over the northern and the southern regions of the Qinling Mountains [J].Geographical Research,20(5):576-582.]
中国科学院《中国自然地理》编辑委员会.1985.中国自然地理:总论[M].北京:科学出版社,1-412.[Physical Geography in China Editorial Board of Chinese Academy o f Sciences.1985.Physical Geography in China:Introduction [M].Beijing:Science Press,1-412.]
周 旗,卞娟娟,郑景云.2011.秦岭南北 1951-2009年的气温与热量资源变化[J].地理学报,66(9):1211-1218.[Zhou Q,D ian J J,Zhen J Y.2011.Variation of air tem perature and thermal resources in the northern and southern regions of the Qinling M ountains from 1951 to 2009 [J].Acta Geographica Sinica,66(9) :1211-1218.]
Bao G,Liu Y,Linderholm H W.2012a.April-September m ean m axim um tem perature in ferred from Hailar pine (Pinus sylvestris var.mongolica) tree rings in the Hulunbuir region,Inner Mongolia,back to 1868 AD [J].Palaeogeography,Palaeoclimatology,Palaeoecology,313-14:162-172.
Bao G,Liu Y,Liu N.2012b.A tree-ring-based reconstruction of the Yim in River annual runoff in the Hulun Buir region,Inner M ongolia,for the past 135 years [J].Chinese Science Bulletin,57(36):4765-4775.
Bao G,Liu Y,Liu N,et al.2015.D rought variability in eastern Mongolian Plateau and its linkages to the largescale climate forcing [J].Climate Dynamics,44(3-4):717-733.
Bradley R S.2010.High-Resolution Paleoclimatology [M]// Hughes M K,Swetnam T W,Diaz H F.Developments in paleoenvironmental research.Springer,Dordrecht Heidelberg London New York,3-16.
Chen F,Yuan Y.2014.May-June maximum temperature reconstruction from mean earlywood density in north central China and its linkages to the summer monsoon activities [J].PLoS One,9(9):e107501,doi:10.1371/ journal.pone.0107501.
Cook E R,Kairiukstis L A.1990.Methods of dendrochronology:applications in the environmental sciences [M].Dordrecht:Kluwer Academic Publishers,1-394.
Holmes R L.1983.Computer-assisted quality control in treering dating and measurement [J].Tree-Ring Bulletin,43(1):69-78.
Hughes M K,Wu X D,Shao X M,et al.1994.A prelim inary reconstruction of rain fall in North-Central China since AD 1600 from tree-ring density and w idth [J].Quaternary Research, 42:88-99.
Jones P D,Lister D H,Osborn T J,et al.2012.Hem ispheric and large-scale land surface air temperature variations:An ex tensive revision and an update to 2010 [J].Journa l of Geophysica l Research,117,D 05127,doi:10.1029/2011JD017139.
Liang E,Liu X,Yuan Y,et al.2006.The 1920s drought reconstructed by tree rings and historical documents in the sem i-arid and arid areas of northern China [J].Climatic Change,79(3-4):403-432.
Liu N,Liu Y,Zhou Q,et al.2013.D roughts and broadscale climate variability reflected by tem peraturesensitive tree grow th in the Qinling Mountains,central China [J].International Journal of Biometeoro logy,57(1):169-177.
Liu Y,Linderholm H W,Song H M,et al.2009.Temperature variations recorded in Pinus tabulaeform is tree rings from the southern and northern slopes of the central Qinling M ountains,central China [J].Boreas,38(2):285-291.
Yi L,Yu H,Ge J,et al.2012.Reconstructions of annual summer precipitation and temperature in north-central China since 1470 AD based on drought/flood index and tree-ring records [J].Climatic Change,110(1-2):469-498.
Tem perature variability referred from tree rings in central and western Qinling M ountains,China
BAO Guang1,2,LIU Na1,2,3,LIU Yu2,3(1.Shaanxi Key Laboratory of Disaster Monitoring and Mechanism Simulation,School of Geography and
Environment,Baoji University of Arts and Sciences,Baoji 721013,China;
2.State Key Laboratory of Loess and Quaternary Geology,Institute of Earth Environment,
Chinese Academy of Sciences,Xi'an 710061,China;
3.Department of Environmental Science and Technology,School of Human Settlements and Civil Engineering,Xi'an Jiaotong University,Xi'an 710049,China)
Climate-grow th relationships between tree-ring w idth and density chronologies and climatic factors in central and western Qinling M ountains were investigated by the methods of Pearson's correlation and spatial correlation.The results showed that the common early grow ing season (especially in May) temperature signal was captured by ring-w idth residual chronology of Larix chinensis in central Qinling Mountains and earlywood density standard chronology of Pinus tabulaformis in western Qinling Mountains.Extremely high- and low-temperature years occurred on the regional scale were referred from both chronologies.And extremely high-temperature year associated w ith regional severe drought event to same degree.The results shed a light on studies of climate changes in the Qinling Mountains through integrating multi-parametric indicators of tree rings from multi-species.
Qinling Mountains;temperature variability;tree-ring proxy;extreme event
P467
A
1674-9901(2015)03-0154-07
2015-02-26
陕西省自然科学基础研究计划项目(2014JQ5192);国家自然科学基金项目(41301101);黄土与第四纪地质国家重点实验室开放基金项目(SKLLQG1302);宝鸡文理学院重点项目博士启动基金(ZK11063)
包 光,E-mail:baoguang@ieecas.cn