Ecological Benefits Evaluation in Ecological Migration Zone Based on Ecological Green Equivalent:A Case Study of Migration Zone in Yanchi County
2015-02-06YunSHIMuwenHANZhuzhouZHUANGChaoMaJinWUXueMA
Yun SHI,Muwen HAN,Zhuzhou ZHUANG,Chao Ma,Jin WU,Xue MA
1.College of Resources and Environment,Ningxia University,Yinchuan 750021,China;2.College of Agriculture,Ningxia University,Yinchuan 750021,China
1 Introduction
Yanchi County in Ningxia Hui Autonomous Region is a typical ecologically fragile zone in China.Since YanchiCounty implemented ecologicalmigration project and ecological restoration measures in 2002,the land use/cover inmigration zone has been significantly changed,and the ecological environmenthas also been greatly improved.The ecological recovery process of ecological migration zone and benefit evaluation aftermigration directly affect the sustainability of the project implementation,and have significance to the efficient follow-up implementation of the project.The evaluationmethods for regional ecological benefits at home and abroad include evaluation model based on green equivalent,evaluation method based on ecological footprint,and method based on factor analysis.Ma Liya et al.use the ecological footprint method to evaluate the ecological security in Yanchi County over nearly a decade[1].Yang Xianming et al.evaluate the benefits of ecologicalmigration in Ningxia based on factors from ecological,economic and social aspects[2].Zhong Xiaojuan etal.make complete exposition on the evaluation index system and methods for the ecological benefits of returning land for farming to forestry[3].Liu Junli et al.use factor analysis to study the ecological benefits of returning land for farming to forestry and grassland in the sandy areas of Ejin Horo Banner in Inner Mongolia[4].However,there is no uniform recognized evaluation index system for regionalecological benefits.This paper selects four typical ecologicalmigration zones in Yanchi County and uses high-resolution satellite remote sensing image and UAV aerial images as data sources for the dynamicmonitoring and analysis of land use in the ecologicalmigration zone.By establishing the ecological benefit evaluation model based on ecological green equivalent,this paper studies the ecological benefitsofecologicalmigration zone from the perspective of ecological restoration,in order to provide guidance for the evaluation of ecologicalmigration project.
2 Overview of the study area
Yanchi County is a county under the administration of Wuzhong city in Ningxia Hui Autonomous Region of the People's Republic of China.Covering a total area of 6748.86 square kilometers,it has a population of about 150000 people.The northern part of Yanchi County is adjacent to the Mu Us Desert,deeply influenced by sandstorms;its southeastborders the Loess Plateau.The transitional geographical environment results in the diversity and vulnerability of natural resources in Yanchi County[5].It features a typical temperate continental monsoon climate,with perennial drought,frequent wind and sand and scarce water.The average annual precipitation is 250-350mm,and the annual average temperature is 8.31℃.The vegetation is low and sparse and mostly herb.The sierozem is themain soil type,followed by black loam soil,aeolian sandy soil,yellow soil,and a small amountof saline soil and Albic soil[6-7].In this study,we select four typical ecologicalmigration zones in YanchiCounty as the study areas,involving two administrative villages and four natural villages.
3 Data sources and research methods
3.1 Data sources
3.1.1Satellite remote sensing image.SPOT5 satellite image has higher resolution than other satellite images such as Landsat TM\ETM and MODIS,and it iswidely used in the study requiring high precision.This paper selects the SPOT5 satellite remote sensing image on September 12,2008 in the study area,with spatial resolution of 2.5m,as shown in Fig.1(a).
3.1.2UAV aerophotographic image.The aerophotographic image scope covers four migrant villages such as Maiduoshan and Guanjitai in Huamachi Town of Yanchi County.The recording time is October 9,2013;the relative flying height is 700 m;the frame size range is1054×698m;the image overlapping degree is 525×140 m;it carries Canon EOS 5Dmark IIwith lens focus of 24 mm,to get UAV aerial photos.After the end of the aerial photography,the flightquality inspection software is used to check the quality of aerial photography,in line with CH/Z 3005-2010 Low-altitude Digital Aerial Photography Norms[8].DPGrid isused to process the photos to obtain the orthophotosof the study area,with resolution of0.2m,asshown in Fig.1(b).UAV aerophotographic image is characterized by high precision and rich information.
3.1.3The land use data and other data.Land use thematic maps and other relevant information;meteorological data,statistical yearbooks,etc.
3.2 Technology roadmapAfter collecting the relevant data,we use UAV aerophotographic image in 2013 and SPOT satellite remote sensing image in 2008 as the data source.Under the geographic information system platform ArcGIS,we obtain the land use data in the study area by vector quantization,spatial overlaying and statistical analysis,and use the ecological green equivalent evaluationmodel to evaluate the ecological benefits in the ecologicalmigration zone.

Table 1 Reclassification of land based on ecological green equivalent
3.3 Research methods
3.3.1Ecological green equivalent.Ecological green equivalent is developed based onmeasuring the ecological compensation ability.Ecological compensation ismade by natural ecosystems for ecological damage due to social and economic activity[9-10].Forest,as the backbone of the Earth's terrestrial ecosystems,hasmultiple functions such aswater conservation,soil and water conservation,climate improvement,atmospheric adjustment,air cleaning and biodiversity conservation[11].The"green equivalent"means that equal amount of photosynthesis,and suitable layout,are ensured to compensate for the regional ecological functions played by certain amount of forest vegetation[12].According to the principles of ecological green equivalent,traditional land use types can be divided into three categories as follows:(i)The land with green equivalent,including farmland,garden plot,woodland,grassland and some unused land,with the functioningmechanism of its ecosystem services similar to that of forest,which can be quantified;(ii)The land implicitly containing green equivalent,mainly referring towaters,including reed land,mudflat,ponds,water surface for aquaculture and reservoirs,with some ecological functions such as climate regulation and air cleaning(only to be research qualitatively,difficult to quantify);(iii)The land with no green equivalent,including land for residential,industrial and mining use,transportation land,water conservancy facility land and some unused land,with zero green equivalent.
3.3.2Indicator selection and the quantification score.According to the actual conditionsof the study area,combined with fieldwork,we list 13 ecological functions from atmosphere,water,soil,natural disastersand biology,and use the rating score of Japanese experts by survey[13]to give scores to different functions,as shown in Table 2.
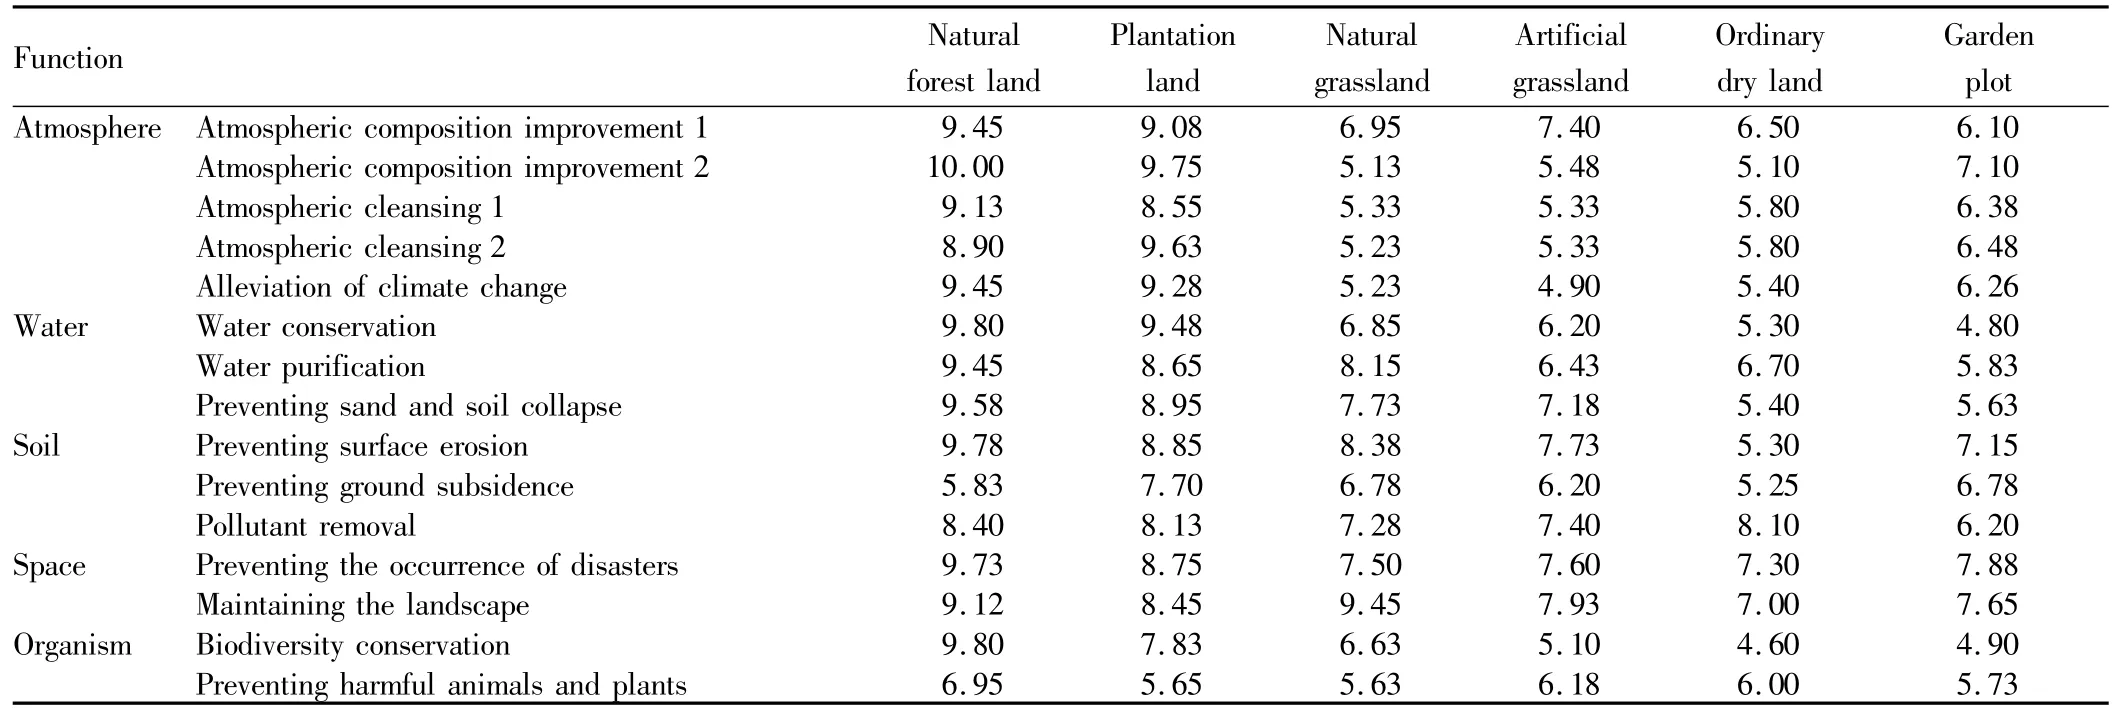
Table 2 The evaluation scores of various environmental functions of ecosystem
3.3.3Calculation of ecological service value and average ecological green equivalent of various ecosystems.We use the following formula to calculate the ecosystem service value of each type of vegetation:
where P is total score of ecosystem services;F is the indicator value;i is the number of indicators in the indicator system.
The ecological service value is as follows:woodland(132.05);natural grassland(102.25);artificial grassland(96.39);ordinary dry land(89.55);garden plot(94.87).Thus,compared with the ecological service value of natural forest land,it is defined as follows:
where Xiis the ecological green equivalent of surface green cover ecosystem i;Fiis the total ecological service value of surface green cover ecosystem i;Fforestis the total ecological service value of forest land ecosystem.
The green equivalent of ecosystems is as follows:woodland(1.00);natural grassland(0.77);artificial grassland(0.73);ordinary dry land(0.68);garden plot(0.72).Taking into account different crop growth period and cropping system in different regions,according to the findings of Liu Yanfang[14],the green equivalent of each ecosystem calculated above needs to be multiplied by a growth period factor relative to year-round full planting,as shown in Table 3.The study area,located in the Northwest inland,has a desert oasis agricultural ecosystem,with one crop per year,and thegrowth period factor relative to year-round full planting is0.46.Thus,the adjusted annual average green equivalentof various ecosystems is as follows:woodland(1.00);natural grassland(0.36);artificial grassland(0.34);ordinary dry land(0.31);garden plot(0.33).
4 Evaluation of ecological benefits in the ecological m igration zone
4.1 Current land use in the study areaIn accordance with National Land Classification,using ArcGIS,we divide the ecologicalmigration zone into four parts based on the UAV aerophotographic image in 2013 and satellite remote sensing image in 2008.We extract the spatial range of four migration zones and perform the vector quantization on land use,as shown in Fig.3.According to the land use classification based on green equivalent,the area of each land use type re-classified is calculated,as shown in Table 4.Based on the above data,therewere great changes in the area of various land use types in the study area over the five years.There were the greatest changes in the area of plantation land and ordinary dry land.The cumulative area of plantation in four zones increased from 134.90 ha in2008 to236.85 ha in 2013,while the cumulative area of ordinary dry land decreased from 158.24 ha in 2008 to 53.27 ha in 2013.The ecologicalmigration projectwas at the peak in 2008,so there was a dramatic increase in the area of natural grassland and natural forest land.Zhaojiliang and Majiliang are located in hilly and gully regions,and in recent years,the ecological construction is being carried out in Yanchi County.The natural grassland on both sides of gullywas converted to plantation land,the area of artificial grassland decreased and the area of plantation land increased.
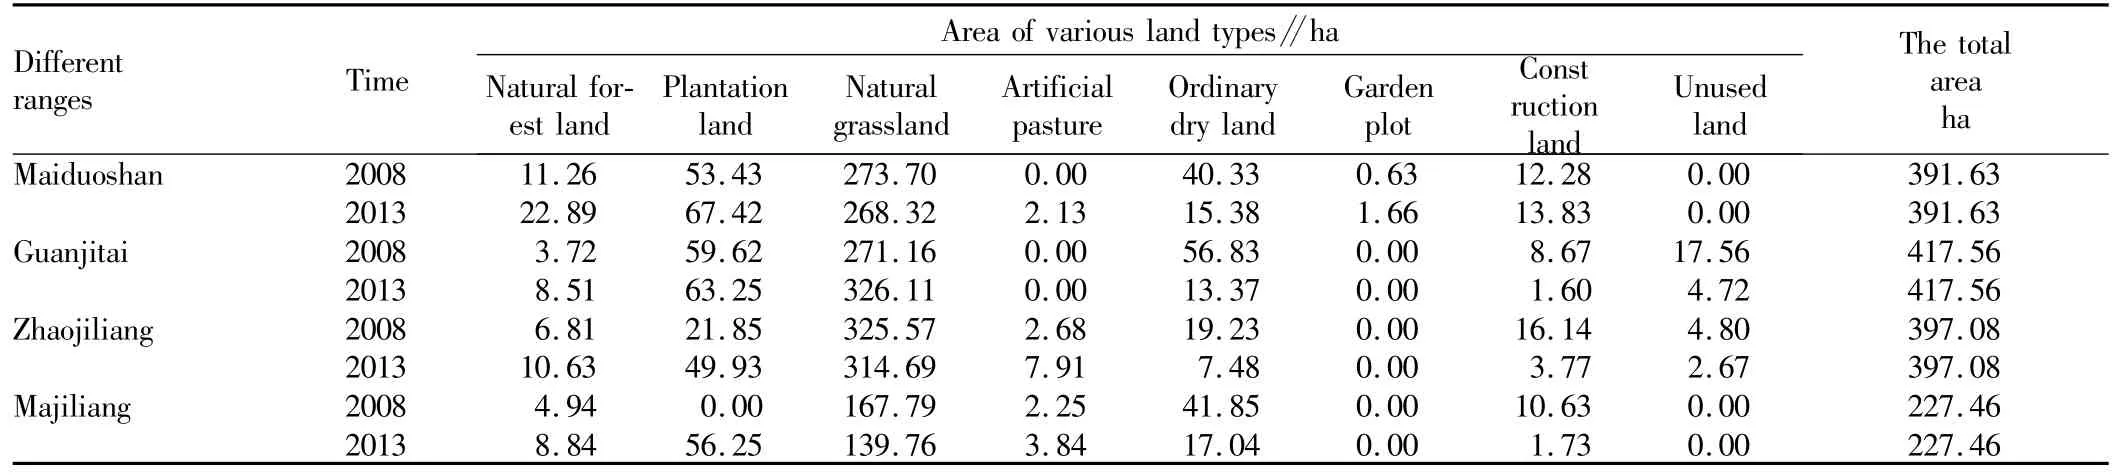
Table 4 Changes in various land use types in 2008 and 2013
4.2 Evaluation of ecological benefits based on ecological green equivalent under the best forest coverage standardsAssuming the total regional area is Stotal,the best regional forest coverage is R,the regional woodland area in accordance with the requirements of the best forest coverage is Sforest,the actual regionalwoodland area is Sactual,the area of land type i is Si,the green equivalent is gi(i=1,2,3...),then:
(i)Determining the best regional forest coverage rate.Here based on the researchmethods of Zhang Jian et al.[15-18],according to the regional precipitation,forest soil saturation,and forest soil saturated water storage capacity,we calculate R as the reference standard for regional ecological assessment.The formula isas follows:
where P is themaximum precipitation within one year(t/ha);Si=Stotal-(area of transportation land,industrial andmining land,paddy field and waters)(ha);W is the saturated water storage capacity per unit area of forest soil(t/ha).
(ii)Calculating the forestarea under the requirements of the optimal forest coverage rate R,with the corresponding green equivalent of1.It is calculated as follows:
(iii)Calculating the regional actual ecological green equivalent ofwoodland Xforest.It is calculated as follows:
(iv)Calculating the total regional ecological green equivalent Xtotal.It is calculated as follows:
According to the data provided by departments ofagriculture,meteorology and forestry in Yanchi County,the daily maximum precipitation within a year is 778 t/ha,and the saturated water storage capacity per unit area of forest soil is 855.42 t/ha.According to the above calculationmethod for ecologicalgreen equivalent,combined with land use data in 2008 and 2013,we calculate the best forest coverage rate and ecological green equivalent in the study in 2008 and 2013,as shown in Table 5.
From Fig.4,it can be found that:(i)The ecological green equivalent ofwoodland and natural grassland make great contribution to regional ecological green equivalent,woodland ismainly natural forest land and plantation land after returning land from farming to forestry,and natural grassland is mainly wild grassland;(ii)The ecological green equivalent in 2008 and 2013 was less than 1 in the study area,indicating that the regional ecological environment is fragile,and there is a need to continue to implement somemeasures such as returning land from farming to forestry;(iii)From 2008 to2013,the ecologicalgreen equivalent in the study area was increased,and the ecological environment of the study area was improved;(iv)The green equivalent value of natural grassland in Maiduoshan and Guanjitaishows an increasing trend,in line with the actual situation of forest conservation and natural grassland protection in these regions;the green equivalent value of naturalgrassland in Zhaojiliang and Majiliang showsa decreasing trend,in linewith the actual situation of location in hilly areas and the implementation of afforestation measures;(v)The ecological green equivalent value in Guanjitai shows the slightest increasing trend,mainly due to the flat terrain and slight change in the proportion of natural grassland in 5 years.

Table 5 The ecological green equivalent in 2008 and 2013
4.3 Evaluation of ecological benefits of forest coverage rate based on ecological green equivalentForest coverage rate can reflect the soilerosion,environmental quality and per capita green space to a certain extent.Herewe refer to the formula of Liu Fangyan et al[14]for forest coverage rate based on ecological green equivalent:
Forest coverage rate based on ecological green equivalent=Regionalwoodland area+Woodland area converted from the area of other land with green equivalent/Total regional land area(Table 6).
The results show that in 2008,the forest coverage rate based on ecological green equivalent in Maiduoshan,Guanjitai,Zhaojiliang and Majiliang was 44.92%,42.77%,38.47%and 34.77%,respectively,an increase of 4.34%,3.34%,6.58%and 18.86%,respectively,compared to 2013.The increase in the actual forest coverage rate indicates that the ecosystem conditions in the study area are gradually improved(Table 7).According to the average forest coverage rate of not less than 20%established by the United Nations as the lowest limit of forest ecolo-gy[14]and the forest coverage rate ofnot less than 15%established by the State Environmental Protection Administration for the plain areas,based on Table 6,7,the actual forest coverage rate in Maiduoshan,Guanjitai,Zhaojiliang and Majiliangwas significantly lower than the lowest limitof forestecology at20%in 2008;the forest coverage rate in Maiduoshan and Guanjitai floated around 15%established by the State Environmental Protection Administration;the forest coverage rate in Zhaojiliang and Majiliang was significantly lower than the 15%target.It suggests that after the projects of ecologicalmigration and returning land from farming to forestry were fully implemented in the study area from 2002 to 2008,the ecological environmentwas improved.As shown in Fig.5,the forest coverage rate based on ecological green equivalent was increased from 44.92%,42.77%,38.47%and 34.77%in 2008 to 49.27%,46.11%,45.04%and 53.63%in 2013,respectively,indicating that the ecologicalenvironmentwas gradually improved and ecological benefits were gradually increased.As can be seen from Fig.5 the actual forest coverage rate in the study areas is far below the current best forest coverage rate,and the proportion of forest coverage rate based on ecological green equivalent in the study areas to the best forest coverage rate is56.18%,51.46% ,50.32%and 59.39%,respectively,indicating that the ecological environment of the study area needs to be further improved and themigration zone can adjust land use structure and continue to implement the afforestation and other measures to strengthen ecosystem stability and increase the ecological benefits in the ecologicalmigration zone.

Table 6 The converted green equivalent value and forest coverage rate based on ecological green equivalent in the ecologicalm igration zone Unit:ha

Table 7 The forest cover ratio in different study areas
5 Conclusions
(i)This paper explores the application of high-resolution image combined with the evaluationmodel of ecological green equivalent to evaluate the ecological benefits of the ecologicalmigration zone in YanchiCounty,and analyzes the status and trends of ecological benefits,which is of positive significance to the protection and improvement of the regional land ecological environment.The result shows that the from 2008 to2013,the eco-environmental quality of the study areas was gradually improved,but the ecological green equivalent valuewas less than 1,the ecological environment of the migration zone was still relatively fragile,and the regional land use planning needs further adjustment.The result is in line with the restoration status of the ecological migration zone in Yanchi County and policy implementation results of ecological civilization county construction.(ii)UAV aerial photography system has a strong advantage in the small-scale operation due to its fast,highprecision image acquisition features.The UAV aerophotographic image in 2013 selected in this study hashigh resolution and the attribute extraction accuracy of variousground objects.Using remote sensing and geographic information system technology,we perform the dynamic monitoring and analysis on two-phase images of the study area in space and time,and the data accuracy is reliable.In the future survey,with the improvement of UAV aerial photography and reduction of relevant operation costs,the scope of survey can be further expanded.(iii)The study fully exploits the ecological service functions of all kinds of ecological land,and uses the ecological green equivalent to conduct quantitative research on the ecological restoration in Ningxia's ecological migration zone.It breaks through the limitations of traditional research based on extensive statistics,and improves the scientificity and operability of ecological evaluation,in order to providea reference for the evaluation of restoration and benefits of related ecosystems.
[1]MA LY,WU B,ZHANG YQ,et al.Assessment of ecological security in YanchiCounty of Ningxia[J].Journal of Arid Land Resources and Environment,2011,25(5):57-62.(in Chinese).
[2]YANG XM,MIWB,QITY,etal.The benefitevaluation of ecological immigration in Ningxia[J].Journal of Arid Land Resources and Environment,2013,27(4):16-23.(in Chinese).
[3]ZHONG XJ,ZHAO Y,SUN BP,etal.Evaluation on ecological benefits of conversion of cropland to forest conducted by Yanchi County[J].Soil and Water Conservation in China,2010(9):34-38.(in Chinese).
[4]LIU JL,QIN FC,YUE YJ,etal.Evaluation of ecological benefitson reforestation in Yijinhuoluo sandstorm area of Inner Mongolia[J].Research of Soil and Water Conservation,2013,20(5):104-107.(in Chinese).
[5]ZHONG ZH,LIKH.The feature and evaluation of ecotone in China[J].The Journal of Chinese Geography,1997,7(2):332244.
[6]DU LT,LIGQ.Dynamicmonitoring ofeco-environment change over1999-2006 in Yanchi County,Ningxia Hui Autonomous Region based on SPOTVGT data[J].Journalof Beijing Forestry University,2008,30(5):46-51.(in Chinese).
[7]XIA ZH,ZHANG KB,LIR,et al.Study on the change of vegetation fraction in agro-pastoral transition area based on NDVI——A case study in YanchiCounty,Ningxia[J].Research of Soiland Water Conservation,2006,13(6):178-181.(in Chinese).
[8]National Administration of Surveying,Mapping and Geoinformation.Specifications for low-altitude digital aerial photography(CH/Z 3005-2010)[S].Beijing:Surveying and Mapping Press,2010.(in Chinese).
[9]WANGCL,ZHU ZL,WANGMM,etal.Research for the ecological function regionalization of ecological compensation based on ecological service value--An example of Longde County in Ningxia Hui Autonomous Region[J].Research of SoilandWater Conservation,2014,21(1):208-212.(in Chinese).
[10]LUO ZJ,ZHANG J.Ecological green equivalentand its application to land use structure optimization--A case study of Xinjian County[J].Acta Agriculturae Universitis Jiangxiensis,2007,29(5):851-856.(in Chinese).
[11]Jim C Y.Managing urban trees and their soil envelopes in a contiguously developed city environment.Environmental Management,2001,28(6):819-832.
[12]NIU JQ,XU F.Study on optimization of land use structure based on RS and ecological green equivalent[J].Journal of Xinyang Teachers College(Natural Science Edition),2009,22(3):410-413.(in Chinese).
[13]MAOWY.Overview of eco-environment impact assessment[M].Beijing:China Environmental Science Press,1998.(in Chinese).
[14]LIU NF,MING DP,YANG JY.Optimization of land use structure based on ecological green equivalent[J].Geomatics and Information Science of Wuhan University,2002,27(5):493-500.(in Chinese).
[15]ZHANG J,GONG JB,CHEN LW.A quantitative discussion on forestcoverage of the optimum forest protective effect[J].Scientia Silvae Sinicae,1996,32(4):317-324.(in Chinese).
[16]GONG YB,ZHANG J,CHEN LW.Study on forest coverage of the optimum forestprotective effectofa country[J].Journal of Sichuan Agricultural University,1996,14(2):231-236.(in Chinese).
[17]HU HK,ZHENG CY.Environmental impact assessment of land use change based on ecological green equivalent——A case study of Meizhou[J].Research of AgriculturalModernization,2008,29(6):743-746.(in Chinese).
[18]ZHAOD,LIF,WANGRS.Optimization ofurban land structure based on ecological green equivalent:a case study in Ningguo City,China[J].Acta Ecologica Sinica,2011,31(20):6242-6250.(in Chinese).
[19]FENG XP.Analysis on countermeasures ofwater and soil conservation and eco-environment construction in China[J].Agricultural Science&Technology,2015,16(2):373-379.
杂志排行

Asian Agricultural Research的其它文章
- Forecasting of the Egg Price Based on EEMD
- On Modern Fruit Production in Japan
- Study on the Improvement of Performance of Global Supply Chain Based on Quantity Flexibility Revenue Sharing Contract
- Supply Chain Optimized Strategies in the Mode of External Financing
- Financial Support for Rural Cooperative Economy in China Based on Grey Correlation Analysis
- A Study on the Driving Factors of Food Production in Huang-Huai-Hai Plain Based on Path Analysis