Track of Super Typhoon Haiyan Predicted by a Typhoon Model for the South China Sea
2014-12-14CHENZitong陈子通ZHANGChengzhong张诚忠HUANGYanyan黄燕燕FENGYerong冯业荣ZHONGShuixin钟水新DAIGuangfeng戴光丰XUDaosheng徐道生andYANGZhaoli杨兆礼
CHEN Zitong(陈子通),ZHANG Chengzhong(张诚忠),HUANG Yanyan(黄燕燕),FENG Yerong(冯业荣), ZHONG Shuixin(钟水新),DAI Guangfeng(戴光丰),XU Daosheng(徐道生),and YANG Zhaoli(杨兆礼)
Track of Super Typhoon Haiyan Predicted by a Typhoon Model for the South China Sea
CHEN Zitong∗(陈子通),ZHANG Chengzhong(张诚忠),HUANG Yanyan(黄燕燕),FENG Yerong(冯业荣), ZHONG Shuixin(钟水新),DAI Guangfeng(戴光丰),XU Daosheng(徐道生),and YANG Zhaoli(杨兆礼)
Institute of Tropical and Marine Meteorology/Guangdong Provincial Key Laboratory of Regional Numerical Weather Prediction,China Meteorological Administration,Guangzhou 510080
Super Typhoon Haiyan was the most notable typhoon in 2013.In this study,results from the operational prediction of Haiyan by a tropical regional typhoon model for the South China Sea are analyzed.It is shown that the model has successfully reproduced Haiyan’s rapid passage through the Philippines and its northward deflection after its second landfall in Vietnam.However,the predicted intensity of Haiyan is weaker than the observed.An analysis of higher-resolution model simulations indicates that the storm is characterized by an upper-level warm core during its mature stage and a deep layer of easterly flow.Sensitivity experiments are conducted to study the impact of certain physical processes such as the interaction between stratus and cumulus clouds on the improvement of the typhoon intensity forecast.It is found that appropriate boundary layer and cumulus convective parameterizations,and orographic gravity-wave parameterization,as well as improved initial conditions and increased horizontal grid resolution,all help to improve the intensity forecast of Haiyan.
Super Typhoon Haiyan,typhoon track,typhoon intensity,numerical weather prediction
1.Introduction
The landfall of a typhoon can be hugely disastrous,and so forecasting the track of typhoons has long been a focus for scientists working in this field of research.Kasahara(1957)developed a typhoon model based on the relationship between the movement speed of the typhoon and the velocities generated by the steering and internal forces of the basic current.In China,the forecasting of typhoon tracks using numerical weather models has been studied since the 1960s. However,owing to the limitations of computer hardware and other related technologies,the resolutions of numerical models for typhoons were very low,and all diabatic physical processes were still being ignored 20 years later in the early 1980s(Ni et al.,1981;Wang et al.,1987).A numerical model containing diabatic physical processes that could be used for operational forecasting in the tropics(Xue et al.,1988)was later developed by the Guangzhou Institute of Tropical and Marine Meteorology(ITMM);however,its resolution was low and its physical processes were not complete, and so the gap between this model and other advanced models developed in other countries was relatively large(Xue et al.,1996).The parameterization of physical processes in numerical weather models,as well as computer capabilities,have developed considerably since the 1980s,and so more recently it has been possible to increase the resolution of models and introduce much more realistic physical processes.In fact,numerical models have been used in China for real-time operational forecasts of typhoon tracks since
the 1990s(Wang and Li,1994;Xue et al.,1996).The forecasting of typhoon tracks is quite sensitive to the parameterization schemes of physical processes in the model,as well as its resolution(Wang and Li,1994), so the quest for higher resolution and more realistic physical processes has never ceased(Zhu et al.,1982; Chen et al.,1996;He,2006;He et al.,2011).Simulating typhoons at higher resolutions has become possible with the advent of supercomputers at the beginning of the present century,and great progress has been made in countries such as the USA,UK,and Japan in forecasting typhoons with numerical models(Chen,1995).
Supported by the China Meteorological Administration Special Public Welfare Research Fund(GYHY201206010)and Guangdong Science and Technology Research Plan(2012A061400012 and 2011A032100006).
∗Corresponding author:ztchen@grmc.gov.cn.
©The Chinese Meteorological Society and Springer-Verlag Berlin Heidelberg 2014
Research on the forecasting of typhoon tracks using numerical models began earlier and has developed to a more mature state than the forecasting of typhoon intensity,both in China and in other countries.The forecasting of typhoon intensity,including changes in intensity,and especially rapid intensification,has become an increasing concern in recent years.For example,Pun et al.(2013)pointed out that the latent heat released by a tropical cyclone(TC)was very high over the northwestern Pacific,which is conducive to the rapid intensification of tropical cyclones.Kaplan and DeMaria(2003)analyzed the large-scale characteristics of TCs that strengthened rapidly over the northern Pacific,and developed a method to predict their rapid intensification.High-resolution numerical models are more suitable for exploring intensity changes of typhoons.Rogers(2010)successfully simulated the track,intensity,and intensity change(during the period of rapid intensification)of Hurricane Dennis using the MM5 model with a resolution of 1.67 km.Chen et al.(2011)studied Hurricane Wilma,which occurred in 2005,with the WRF-ARW model(using the bidirectional feedback setup and movable nested grids with a maximum resolution of 1 km),and demonstrated that the rapid intensification and weakening processes of the TC could be successfully simulated. The relationship between convective bursts(CBs)in the eyewall and the upper-level warm core has been studied(Zhang and Chen,2012;Chen and Zhang, 2013),and it is found that the upper-level warm core plays an important role in the rapid intensification of hurricanes.
At present,operational numerical models used in China are more capable of forecasting a typhoon’s track than its intensity,especially for super typhoons. This problem is reflected in the forecasts of Typhoon Megi in 2010 and Haiyan in 2013.The shortcomings in typhoon intensity forecasts will also impact upon the accuracy of other elements,such as the typhoon’s track and the associated wind and rain.Many studies have been carried out on the simulation of the intensity of Saomai,which made landfall in China in 2006(e.g., Yu et al.,2008;Ma et al.,2009;Shi et al.,2009;Xu et al.,2010).Simulations with the MM5(v3.5),ARPS, and WRF models(Yu et al.,2008;Ma et al.,2009;Shi et al.,2009)have all shown too weak an intensity compared to observations,which further causes bias in the forecasting of the typhoon’s track,wind,and precipitation.The forecasting of super typhoons is greatly affected by the assimilation of high-resolution observational data,typhoon initialization technology,and the performance of the model’s framework(especially the physical processes).Due to a lack of detailed studies on the occurrence and development mechanisms of super typhoons over the ocean,there are currently many deficiencies in the design of the physical processes used for forecasting track and intensity of super typhoons.
In the past 20 years,great progress has been made in China with respect to the operational forecasting of typhoons using numerical models,and the performance of an early(prior to 2006)typhoon model developed by the ITMM for the South China Sea has been enhanced through significant efforts over several generations of research.A new tropical regional atmosphere model for the South China Sea(TRAMS)was established based on the GRAPES framework in 2006. Since then,it has been regularly developed to become one of the main operational typhoon models used in China.
Super Typhoon Haiyan was the most notable typhoon in 2013.It formed over the northwestern Pacific on 4 November,and then rapidly strengthened to a super typhoon on 8 November.Haiyan made landfall in the Philippines,with the strongest wind force on record and large-scale storm surges,causing devastating damage in the central part of the Philippines.
According to an estimation from the U.S.Joint Typhoon Warning Center,the maximum wind force of Haiyan reached 75 m s-1when it moved near to the central and southern islands of the Philippines,and made landfall at a speed of over 300 km h-1,which was far higher than Hurricane Katrina,which made landfall first in Florida,USA in 2005.Both Haiyan and Katrina were super typhoons(hurricanes)that caused devastating destruction over multiple landfall events. Haiyan made landfall in the Philippines at the super level on 8 November,and then its intensity weakened before making landfall again in northern Vietnam on 11 November.
The track of Haiyan was successfully forecasted by many operational numerical models(including TRAMS),but its forecasted intensity was too weak compared to observations.In addition,the disastrous impacts of Haiyan became heavier due to the fast speed of movement of the typhoon and the topography of the Philippines.Hurricane Katrina was also a super typhoon,with wind speed reaching 225 km h-1when it made landfall in Louisiana.The forecast of Katrina’s track and intensity by the U.S.National Hurricane Center was practically flawless.On 26 August(3 days in advance),it was predicted that there would be a 90%probability that the hurricane would pass directly through New Orleans,and this of course was hugely helpful in terms of winning time to alleviate the disaster.The greatest losses were mainly caused by the strong storm surge,the bursting of flood banks, and disorder in disaster prevention attempts.
The purpose of analyzing the track forecast of Haiyan in this paper is to understand the skill and problems that exist in TRAMS,thus hopefully providing relevant clues for developing new operational typhoon models,and giving some reference for super typhoon forecast services. In Section 2,we briefly describe the characteristics of Haiyan.The track of Haiyan and its forecast by TRAMS is then examined and summarized in Section 3.In Section 4,we analyze the underlying physical mechanisms through numerical experiments and the technical schemes for improving the skill of the forecast.Finally,in Section 5,we present some further discussion and a summary of the key findings.
2.Characteristics of Super Typhoon Haiyan
Super Typhoon Haiyan formed over the northwestern Pacific(6.1°N,152.2°E)at 0000 UTC 4 November 2013. It moved in an NWW direction and strengthened rapidly to become a strong tropical storm at 1800 UTC 4 November,a typhoon at 0600 UTC 5 November,a strong typhoon at 1800 UTC 5 November,and finally a super typhoon,with a minimum central pressure of 950 hPa and maximum central mean wind speed of up to 55 m s-1,at 0000 UTC 6 November.Haiyan made landfall in the Philippines at the super typhoon level at 2300 UTC 7 November (Fig.1),with its minimum central pressure and maximum ground wind speed in the inner core of the typhoon reaching 890 hPa and 75 m s-1,respectively.At 0600 UTC 8 November,Haiyan weakened to a typhoon and entered the South China Sea at nighttime on 8 November,after which it approached the oceanic area near the Xisha Islands.It then moved into the Beibu Gulf after grazing the southwestern part of Hainan Island in the afternoon of 10 November,before weakening to a typhoon at 1300 UTC 10 November.At 2100 UTC 10 November,Haiyan made landfall again in the coastal area of Quang Ninh Province in northern Vietnam.The maximum wind speed and minimum pressure near the center was 38 m s-1and 965 hPa,respectively.Finally,Haiyan entered Ningming County,Guangxi,China,at 0100 UTC 11 November, after which it weakened to a strong tropical storm at 0200 UTC 11 November,a tropical storm at 0400 UTC 11 November,and a tropical depression at 1200 UTC 11 November.Haiyan was the strongest typhoon in the world in 2013,with a maximum wind speed up to 75 m s-1around the time of its landfall in the Philippines.Due to the influence of Haiyan,wide-ranging and strong precipitation and windy weather occurred over most parts of Guangxi and in the cities and counties of southwestern Guangdong.In general,observational analysis indicates that Haiyan was characterized by powerful intensity,high speeds of movement,late season development,and heavy disastrous impact.
Haiyan formed over the northwestern Pacific to the east of Indonesia over an obviously warm sea surface.From comparisons between temperature anomalies at the sea surface and changes in the typhoon’s intensity(Fig.2a),we can see a close relationship between the two variables.The sea surface was relatively warm(positive temperature anomaly)from 1800 UTC 5 November to 1200 UTC 7 November,and the typhoon’s intensity increased accordingly.Thereafter,the intensity weakened with a decline in sea surface temperature(anomalies being negative or close to zero);thus,a relationship between the development of Haiyan and the warm sea surface is clear.Recently,it has been shown that the latent heat released from thewarm sea surface in the northwestern Pacific(with 26℃-isotherm thickness)has a close relationship with the formation and development of typhoons,especially super typhoons(Pun et al.,2013).
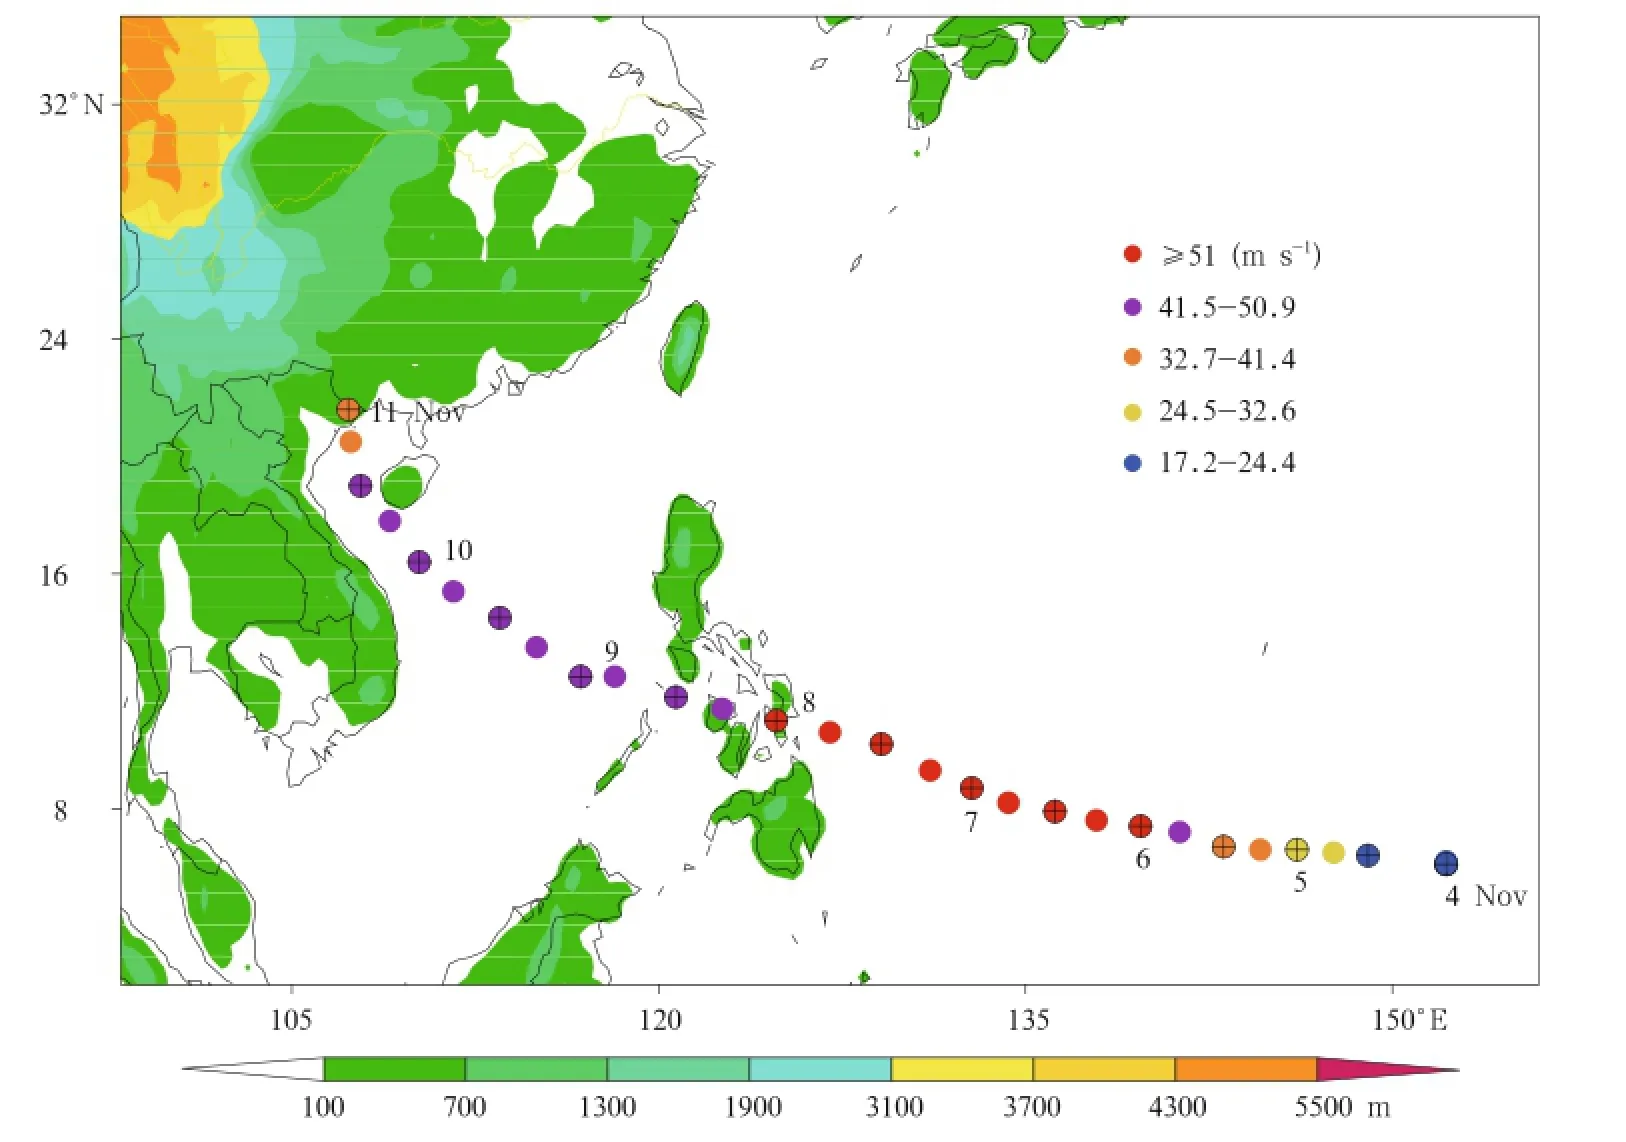
Fig.1.Track of Typhoon Haiyan.The shadings represent topographic height(m)and the dots represent the position and intensity of Haiyan at 6-h intervals.

Fig.2.Time series of the intensity and movement speed of Haiyan during the period 0000 UTC 5 to 0000 UTC 10 November.(a)Typhoon intensity and mean sea surface temperature anomaly(SSTA)averaged within a 300-km radius of the typhoon center,and(b)movement speed and mean steering current averaged within a 300-km radius of the typhoon center at 12-h intervals.
In the present study,from a preliminary comparison of the easterly steering current(mean value of horizontal wind at 500 hPa within a 300 km radius around the typhoon’s center)and movement speed of the typhoon(Fig.2b),we find an apparent correlation between the two features.The speed of the steering current exceeded 10 m s-1from 0000 UTC 8 November, which maintained until 1800 UTC 9 November,while the movement speed of the typhoon within the corresponding period was basically maintained at above 38 km h-1.This indicates that the movement speed of Typhoon Haiyan was mainly influenced by the easterly current on the south side of the subtropical high.
3.Features of the moving track of Haiyan in the model forecast
3.1 The TRAMS model
TRAMS is a non-hydrostatic regional model,developed on the basis of the GRAPES mesoscale model. TRAMS employs a semi-implicit,semi-Lagrangian scheme for the integration of time.The horizontal grid is designed on a longitude-latitude net and the vertical coordinate is terrain-following.The Arakawa-C grid and Charney-Philips vertical layer setup are used in the horizontal and vertical directions.The model covers the range of 0.8°-50.5°N,81.6°-160.8°E.The horizontal grid interval is 0.36°and the model is divided into 55 layers in the vertical.The step length for the time integration is 200 s.The Medium-Range Forecast(MRF)model boundary layer scheme,Simplified Arakawa-Schubert(SAS)cumulus parameterization scheme,WRF Single-Moment 6-class(WSM6) microphysics scheme,Specified constants and Layers for soil(SLAB)land surface processes,SWRAD shortwave radiation scheme,and Rapid Radiative Transfer Model(RRTM)longwave radiation scheme are all used in the model.TRAMS has been in operational use by the China Meteorological Administration since 2011.It provides 120-h forecasts twice daily for typhoon track,wind,rain,isobaric surface field,and typhoon intensity.In this paper,only the 48-h forecast outputs from TRAMS are analyzed.
3.2 Track forecast
The track of Haiyan was accurately forecasted by TRAMS.For example,the landfall of Haiyan in the middle of the Philippines was successfully predicted in the forecast initiated at 0000 UTC 7 November(Fig. 3).Haiyan entered the South China Sea after passing through the Philippines,and its landfall in Vietnam after entering the Beibu Gulf was also successfully simulated in the forecast initiated at 0000 UTC 10 November(when Haiyan was near the Xisha Islands).Statistics relating to the forecasts of TRAMS from 0000 UTC 4 to 0000 UTC 11 November(14 in total)show that the mean errors of 24-and 48-h track forecasts were 81 and 157 km,respectively,which were smaller than those of the forecasts from the European Center(EC)global model and the Japan Meteorological Agency(JMA)mesoscale forecast model.The track forecast for Haiyan by TRAMS showed little divergence,which can be seen from the distribution of forecasts initiated at all time points(Fig.3),especially in the track forecast from the formation of the typhoon to its landfall in the Philippines.The characteristics of the track and its landfall position were also successfully predicted by TRAMS after Haiyan entered the South China Sea.
3.3 Forecast of typhoon intensity,wind,and rain
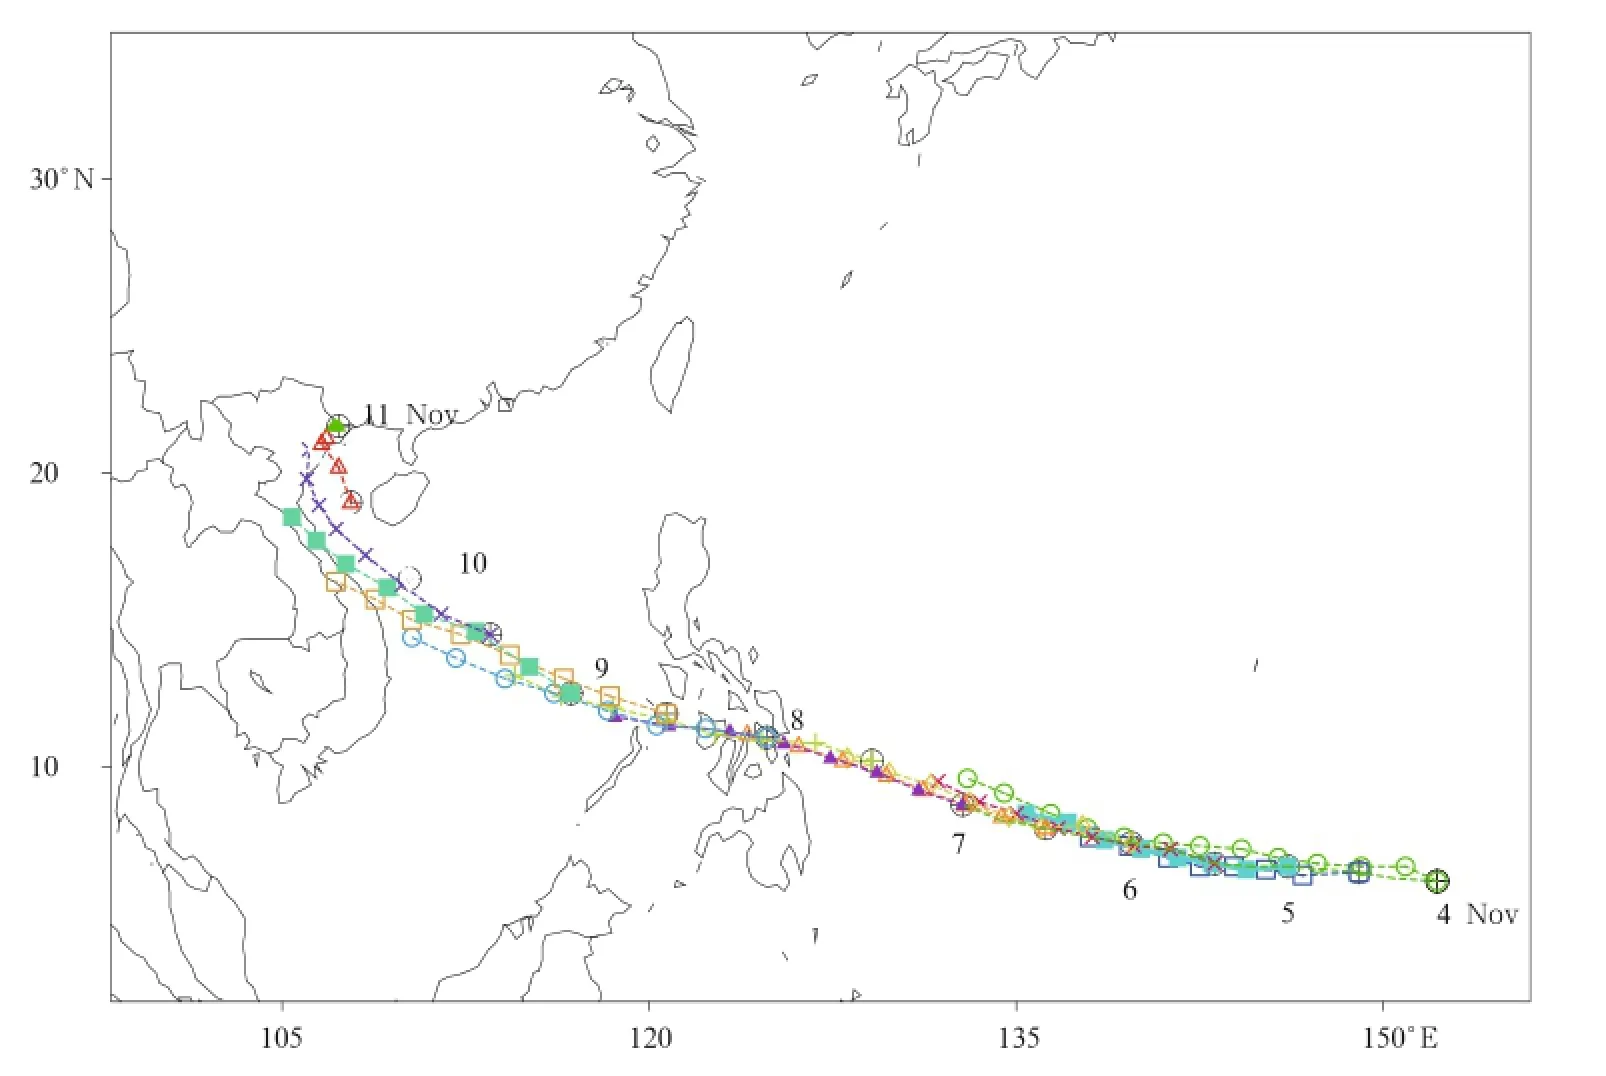
Fig.3.Distribution of Haiyan’s track forecasted by TRAMS from 4 to 11 November.The model was run every 12 h,with an integrating time of 48 h,and the forecast position was plotted every 6 h.The numbers in the figure denote dates.Different colors denote different initiation times.
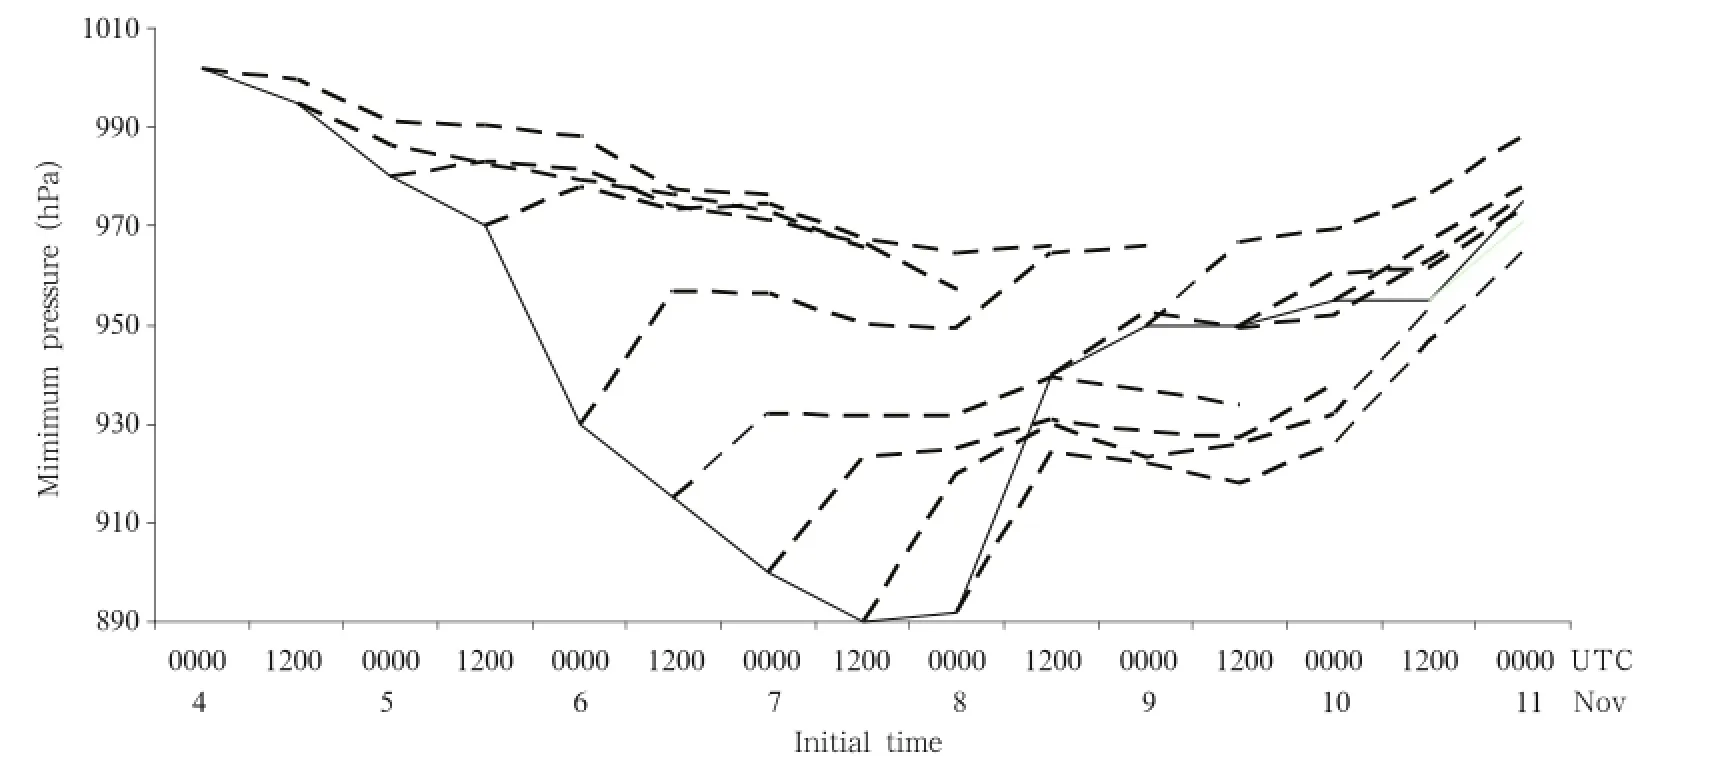
Fig.4.Time series of the minimum central pressure(hPa)of Typhoon Haiyan predicted by TRAMS.The solid and dashed lines denote the observed and forecasted results,respectively.
Various models,including the EC model,JMA model,and TRAMS,all forecasted clearly too weak intensities for Haiyan.In our simulation,the mean errors of the 24-,48-,and 72-h intensity forecasts in TRAMS reached 21.65,30.71,and 26.56 hPa, respectively,which were smaller than those in the EC model and JMA model.Nonetheless,the forecasting of intensity for super typhoons is still a challenge for numerical models. The evolution of Haiyan’s intensity can be divided into four stages (Fig.4).(1)From 0000 UTC 4 to 1200 UTC 5 November,during which time Haiyan strengthened slowly and the errors of forecasted intensities by the various models were relatively small.(2)From 1200 UTC 5 to 1200 UTC 8 November,when Haiyan was strengthening rapidly-a process that was too slow in the forecast of the EC model,resulting in the forecasted typhoon intensity being evidently weaker than observed;e.g., the observed intensity reached 890 hPa when Haiyan was strongest(1200 UTC 7 November),but the best forecast by the EC model was only 958 hPa(a bias of 68 hPa).The minimum central pressure forecasted by JMA during this period was 983 hPa,with an error up to 93 hPa.TRAMS provided a better prediction,whose minimum central pressure was 923 hPa(a bias of 33 hPa).(3)After 0000 UTC 9 November, when Haiyan weakened rapidly,and all the intensities
forecasted by the various models were slightly higher than observed.(4)The final stage,when the typhoon entered the South China Sea and made landfall again in Vietnam,for which all the models(EC,JMA,and TRAMS)successfully forecasted the slow weakening process of Haiyan.
The strong winds of Haiyan caused heavy destruction when it made landfall in the Philippines,as mentioned above.Its subsequent landfall in Quang Ninh Province in northern Vietnam brought strong winds (reaching hurricane level)and heavy rainstorms.The maximum wind force reached 33 m s-1when Haiyan entered Ningming County,Guangxi,China.Haiyan eventually weakened to be a tropical storm,with a maximum wind force of 23 m s-1at 0300 UTC 11 November,and thereafter weakened to a tropical depression in Guangxi 9 h later(1200 UTC 11 November).According to ground station observations from Fangcheng Port,Qinzhou,Chongzuo,and Beihai,the maximum wind speed ranged from 18 to 30 m s-1during the time when the typhoon passed through Guangxi.As can be seen from the wind field forecasts at 925 hPa and surface(10 m),the wind direction was basically correctly simulated,but the wind speed was slightly lower.With the weakening and northeastward movement of the typhoon,the wind speed weakened accordingly,and this reflected the actual situation.
During the period from the typhoon entering the Beibu Gulf to its landfall in northern Vietnam,heavy precipitation occurred in coastal areas of Guangxi (Fig.5).The areas with precipitation greater than 50 mm were mainly located in Nanning City and southwestern Guangxi,and there were three stations with precipitation amounts greater than 200 mm,from Fangcheng Port to Chongzuo City,along the China-Vietnam border.After the typhoon entered Guangxi (from 0000 UTC 11 to 0000 UTC 12 November), the precipitation was mainly distributed in southwestern Hunan and most parts of Guangxi,with a rainstorm center(reaching>200 mm)in central Guangxi. TRAMS successfully forecasted the 48-h accumulated precipitation in Guangxi and Hunan.The rainstorm centers,with precipitation of 150-200 mm over the Youjiang River valley,Guangxi,and 86%of rainstorm stations in Guangxi,were also predicted.The falling areas and occurrence times of strong precipitation caused by the typhoon during landfall were basically correctly forecasted by TRAMS(Fig.5).
4.Numerical experiments and the impact of technical improvements
4.1 Impact of technical improvements

Fig. 5.(a)24-h accumulative precipitation and corresponding 24-h forecast from 0000 UTC 10 to 0000 UTC 11 November 2013,and(b)24-h accumulative precipitation from 0000 UTC 11 to 0000 UTC 12 November 2013 and corresponding 48-h forecast.Shadings denote the model forecast;contour lines denote the observation;colored bars denote the forecast precipitation level(mm).
The evolution of the large-scale circulation for Super Typhoon Haiyan is generally described by the dynamic framework in the TRAMS model.Details such as the changes in movement speed and typhoon intensity,as well as recurving of the typhoon track,can
also be described well after physical processes were added.Strong exchanges of water vapor,heat,and momentum between the sea surface and the atmosphere are driven by the cyclonic circulation and warm core of the typhoon.The exchange process takes place in the atmospheric boundary layer,and then cumulus convection is triggered.The impacts of technical improvements in the model(namely,the boundary layer scheme and cumulus convection scheme,with other relevant technologies taken into account)are discussed in this section.
4.1.1 Boundary layer scheme
TheMRF boundary layerparameterization scheme in the old version of TRAMS simply employed the Monin-Obukhov(M-O)similarity theory when calculating the surface layer flux(see Eq.(1)).Modification was made by using the scheme proposed by Beljaars(1994),as shown in Eq.(2)(Dai and Chen, 2013):
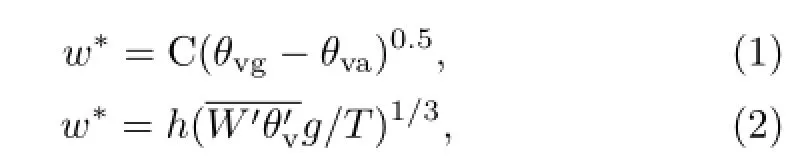
where C is a constant(taken as 2.0);θvgand θvaare the virtual potential temperatures of the ground surface and the bottom layer of the model,respectively; h is the height of the boundary layer;g/T represents the buoyancy effect;andis the sum of sensible heat flux and latent heat flux from the ground surfaceFrom Eq.(1),it can be seen that the calculation of w∗is only related to the gradient of the virtual potential temperature of the ground surface and the bottom layer of the model. Firstly,the bottom-layer virtual potential temperature (θva)has a good relationship with the model layering, and this will affect the calculation of w∗;different underlying surface types will also have a significant influence on the virtual potential temperature(θvg)of the ground surface,which will easily cause deviation of the calculation.Whereas,the calculation of the convection speed in Eq.(2)is directly correlated with the ground surface heat flux and the boundary layer height,so the convection speed controls the development of turbulence and the boundary layer directly. The physical meaning of Eq.(2)is more evident,and the defect in Eq.(1)can be avoided.
The influence of the improved convection speed on the forecast of Haiyan is mainly reflected in the rapid weakening process of the typhoon;thus,the forecasts initiated at 0000 UTC 7 November are analyzed. Figure 6 shows the difference of the 72-h forecast between the original scheme and the modified scheme,in which it can be seen that the track forecast differs little between the two within the first 48 hours,but the modified scheme has an evident advantage after 48 h, with a maximum improvement of 23.5 km and 12% decrease in track error.The modified scheme is also clearly better than the original scheme in terms of the intensity forecast;the 48-h central pressure forecast of typhoon using the modified scheme is 11 hPa lower than that using the original scheme,and the intensity error decreases by 23%.
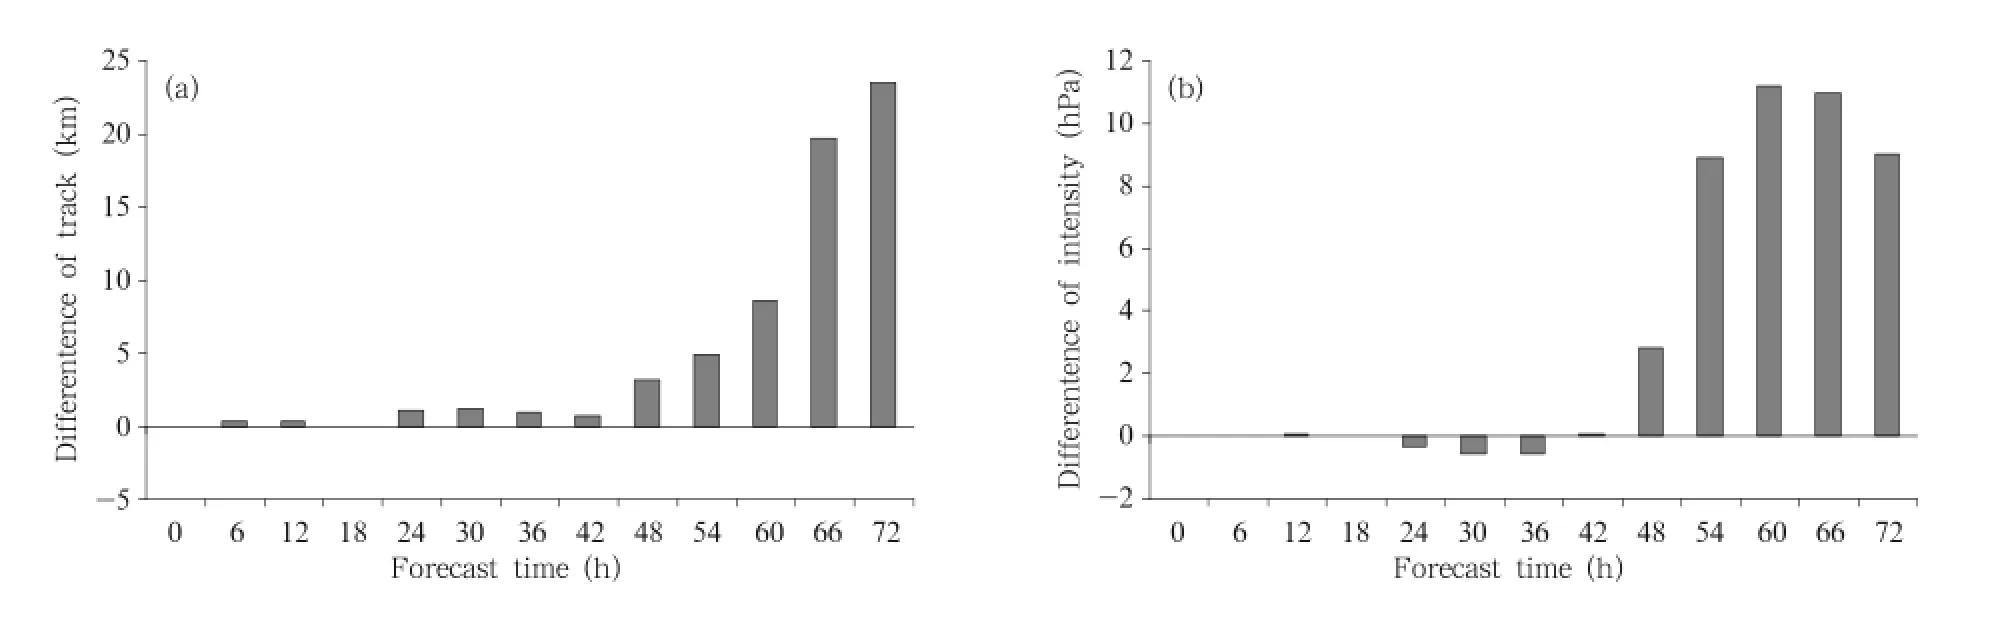
Fig.6.Differences in the forecast(a)track error(km)and(b)intensity error(hPa)for Typhoon Haiyan up to 72-h forecast time(original scheme minus the modified scheme).
The convection speed directly influences the transfer of flux(sensible heat,latent heat,and momentum)upwards from the sea surface,and plays an
important role in the development and maintenance of the typhoon.Numerical experiments revealed that the upward transferred momentum flux,latent heat flux, and sensible heat flux obtained by using the original scheme are larger than those obtained by using the modified operational scheme(figure omitted).This could perhaps explain why the original scheme simulated the typhoon intensity to weaken more slowly (Haiyan started weakening after 0000 UTC 8 November)and has larger errors compared with the typhoon intensity simulated by the modified scheme.
4.1.2 Cumulus convective parameterization scheme
The cumulus convective parameterization scheme used in TRAMS is the SAS scheme developed by Pan and Wu(1995).Han and Pan(2011)modified the SAS scheme in a number of aspects,including:defining the convective inhibition as a function of cloud-base vertical speed;defining the entrainment rate to gradually decrease with height;taking into account the inhibition effect of the dry air layer at the cloud base upon triggering of convection;setting the cloud-base mass flux to meet local CFL(Courant-Friedrichs-Lewy)criteria;considering the influence of the horizontal pressure gradient force induced by convection on momentum transfer;and taking into account the detrainment of cloud water and snow.
The modified SAS scheme has a very significant effect on the forecasting of most typhoons,but its effect on the forecast of Super Typhoon Haiyan is not so obvious,due to its symmetric structure and vigorous convection.The SAS scheme also has a few deficiencies in the coupling of stratiform cloud and cumulus.Only the entrainment and uplift effects of the ascending current on water vapor are taken into account in the original SAS scheme,while the entrainment process of cloud water and cloud ice is ignored when the ascending current passes through the stratiform cloud.It is equivalent to say that the SAS scheme only gives consideration to the one-way coupling process of subgridscale convective cloud to stratiform cloud and neglects the reaction of large-scale stratiform cloud on convective cloud.
Based on the analysis above,processes were added (the entrainment and uplift processes of cloud water,cloud ice,and snow in the convective ascending current;and the microphysical transformation process from cloud water and cloud ice to rain and snow during uplift)to improve the coupling mechanism between stratiform cloud and convective cloud.The influence of the modified convective parameterization scheme was investigated with the forecast initiated at 0000 UTC 7 November.
Comparison of the mean tendency between the convective parameterization and the microphysical process reveals that the original cumulus convective scheme only generates cloud ice(qi)and ignores the transformation process from cloud ice to snow(qs). The uplift effect of convective ascending current on cloud ice and the transformation process from cloud ice to snow during the uplifting process were taken into account in the modified scheme.The height of the microphysical process tendency in the new scheme is higher than that in the original scheme(figure omitted)due to the uplift effects of convection.A similar conclusion can be obtained from the change in tendency of cloud water and rain.Cloud droplets grow quickly through coagulation during uplift,and they are detrained to form stratiform cloud near the top of convective cloud,forming grid precipitation in the microphysical process.These detrained cloud droplets become larger through further coagulation during the falling process,and so it should be the case that the grid precipitation produced by the modified scheme is stronger than that forecasted by the original scheme. From Fig.7,it can be seen that the grid precipitation from the new scheme is indeed enhanced.Finally,a 72-h forecast was conducted to evaluate the influence of the modified scheme.It was found that the modified scheme can provide a better intensity forecast, whereas the improvement of the track forecast is not so obvious.
4.1.3 Other relevant technologies

Fig.7.Time series of hourly grid-point forecasted precipitation(mm)averaged within a 300-km radius of the typhoon center,from the experiments with the original cumulus convection scheme(nocoup)and the modified convection scheme(coup).
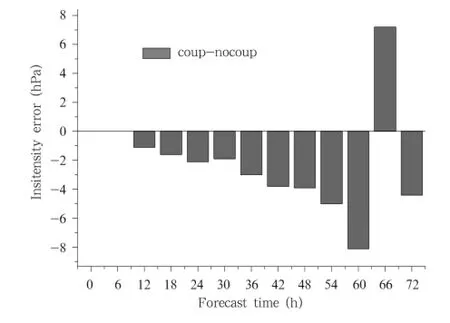
Fig.8.Comparison of the forecast errors for the central pressure(hPa)of the typhoon from the two experiments with the modified scheme minus that with the original scheme.
The influence of gravity-wave drag induced by subgrid-scale orography (hereafterreferred to as GWDO)is parameterized in TRAMS.It has been found that obvious deviation will occur in simulations of wind fields without consideration of GWDO. Zhong et al.(2014)introduced a GWDO parameterization scheme that was originally proposed by Kim and Arakawa(1995)into TRAMS,and found that it improved the forecast of typhoon track and intensity, especially in longer-term forecasts.Stress will be generated at the reference level when air currents surmount irregular terrain.The stress will develop along the vertical direction in the form of gravity waves,and will be broken when encountering unstable conditions, which in turn will weaken the drag force and cause the gravity waves to propagate downstream.The accuracy of forecasts is raised after the gravity-wave drag is taken account into TRAMS,and this effect will be more significant with longer integration of the model.
Comparison experiments were conducted to investigate the influence of GWDO on the forecast of Haiyan.The results showed that the forecasts of the typhoon’s track and intensity improved after GWDO is taken into account.The improvement on the forecast became evident after 48 h in the forecast initiated at 0000 UTC 7 November,with a decrease of 10-20 km in the track forecast error.Consideration of GWDO also improved the track forecast when Haiyan made landfall in Vietnam.In general,taking GWDO into account improves the forecasting capability of TRAMS.
The setting up of a reference atmosphere in numerical models also has an obvious influence on typhoon forecasts.The design of the initial perturbation on the temperature of the reference atmosphere was studied based on the effect of the warm sea surface and warm core structure in the typhoon.The reference atmosphere used in TRAMS was based on the static balance assumption(adopted in GRAPES-meso).The main purpose of introducing the reference atmosphere was to eliminate the static balance component in the vertical motion equation,such that the“maxterm balance”between gravity and the pressure gradient in the vertical motion equation was converted into the“minterm balance”of the corresponding perturbation, which should improve the accuracy of the calculation. The reference atmosphere was static in the integration of the model,so only the perturbation component was in fact calculated.The pressure perturbation was used to calculate the potential temperature perturbation through the static balance relationship,which is helpful to improve the model stability and large-scale forecast effect.However,it will lead to obvious errors in the forecasting of temperature at the lower level. To alleviate this problem,the potential temperature perturbation was calculated by using Eq.(3)for the lower level,while at the middle and upper levels the original scheme was still employed.The transition between the lower level to the middle and upper levels was smoothly interpolated.The modified scheme raised the accuracy of the temperature at the lower level and maintained the model’s forecast stability.It
was found through a batch size test that the modified scheme improves the performance of TRAMS.

where θ'(λ,φ,ˆz,t),θ(λ,φ,ˆz,t),and˜θ(z)represent the perturbation of potential temperature,the full amount and reference amount of potential temperature,respectively.In the forecast of Haiyan initiated at 0000 UTC 7 November,the performance of the modified scheme was better than the original scheme,and the error of the track forecast was obviously reduced with the new scheme.
4.2 High-resolution simulation experiment
A high-resolution numerical experiment was conducted with all the options set to be the same as those in the operational TRAMS,except that the model range was reset to 0.8°-20.6°N,113.0°-141.8°E and the horizontal resolution of the model was improved from 0.36°to 0.09°.The high-resolution simulation was initiated at 0000 UTC 7 November and integrated for 36 h,i.e.,during the period when Haiyan developed to its strongest and passed through the Philippines rapidly.
The simulation by the high-resolution model was very close to the analysis field,and the changes in track and intensity were basically consistent with observations.As can be seen from Fig.9,the error of the track forecast in the high-resolution simulation was smaller than that from the operational TRAMS (36 km).
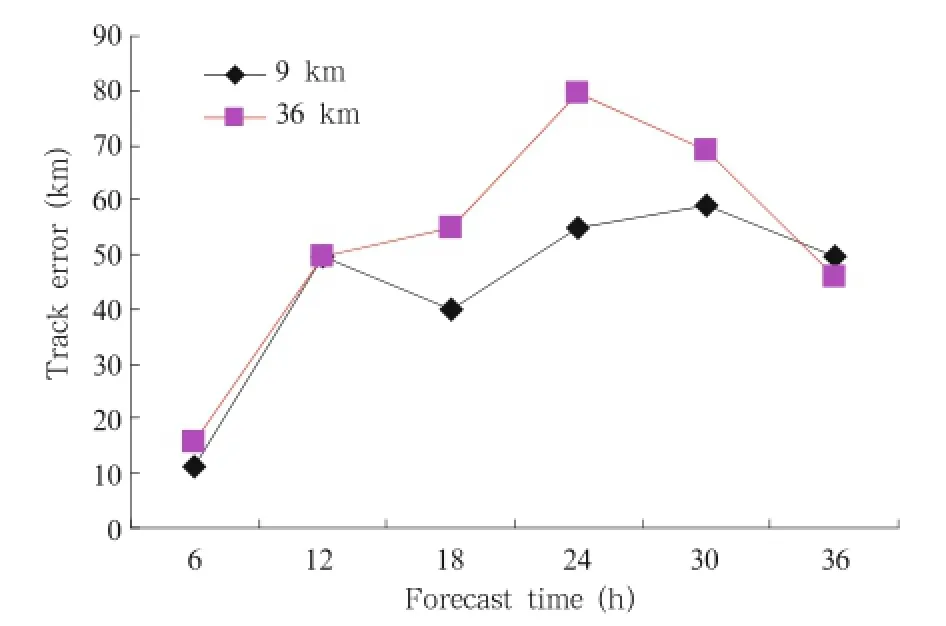
Fig. 9.Comparison of the track forecast errors(km) between the 9-and 36-km resolution models,with an initiation time of 0000 UTC 7 November 2013.
The rapid intensification of Haiyan forecasted by the model was close to the observation.The central sea surface pressure of the typhoon decreased rapidly after 0000 UTC 7 November(Fig.10),and reached its minimum at 2200 UTC 7 November.When Haiyan made landfall in the Philippines(the predicted time of landfall was 2300 UTC 7 November,which was consistent with the actual situation),the central pressure rose rapidly and the typhoon intensity decreased obviously.
On the whole,the easterly wind was strong in the middle and lower troposphere and weak in the upper troposphere around the typhoon,which corresponded closely to the typhoon’s intensity change.The movement speed of the typhoon showed an obvious correlation with the wind speed at the middle and upper levels.The movement speed of the typhoon forecasted by the model changed relatively smoothly(dotted curve in Fig.10),ranging from 30 to 46 km h-1(8.3-12.8 m s-1).Typhoon Haiyan moved westward quickly,and the movement speed was very close to actual measurements.
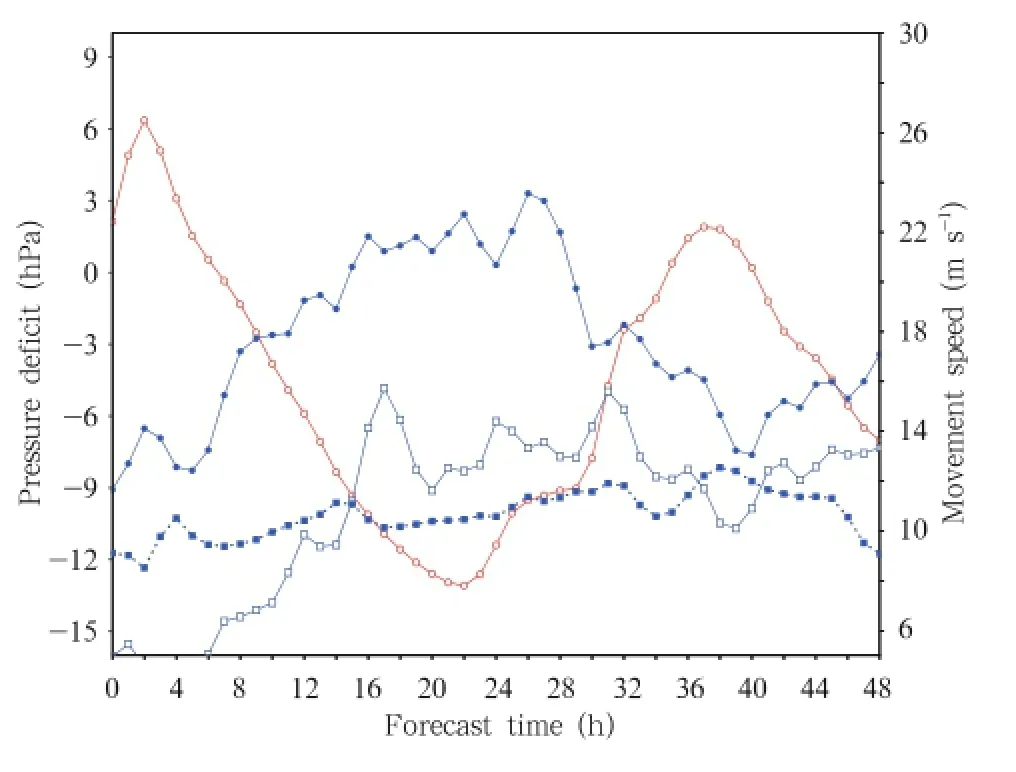
Fig.10.Evolution of deviation of the typhoon’s central sea surface pressure relative to the initial value(red line), and the typhoon movement speed(blue dotted line with squares).Blue solid line:mean easterly wind averaged within a 300-km radius of the typhoon center(solid dots: 3-km height;hollow dots:8-km height).

Fig.11.Radius-height profiles along the typhoon center from the simulation experiment.The wind vectors represent relative storm flow(m s-1)(with movement speed subtracted),and the shadings represent the temperature anomalies(K)of the relative isohypsic surface.(a)1200 UTC 7 November,(b)0000 UTC 8 November,and(c)1200 UTC 8 November.
At 1200 UTC 7 November,there were two warm cores at heights of 8 and 14 km,respectively(Fig. 11a).From the analysis of the flow field,it is found that the inflow into the lower level and outflow from the upper level were very obvious.The warm core of the typhoon was concentrated at the upper level(12-16 km)when the typhoon was strongest at 0000 UTC 8 November(Fig.11b),and the height of the warm core was roughly the same as the level of the divergent outflow.When the typhoon weakened at 1200 UTC 8 November(Fig.11c),the intensity of the warm core and divergent outflow also decreased evidently.The rapid intensification of Haiyan(from 1200 UTC 7 to 0000 UTC 8 November)was likely to be caused by the strong outflow from the upper level and the obviously warm core.The typhoon entered a rapid weakening stage after 0000 UTC 8 November,with the outflow from the upper level and warm core of the typhoon accordingly becoming weaker.
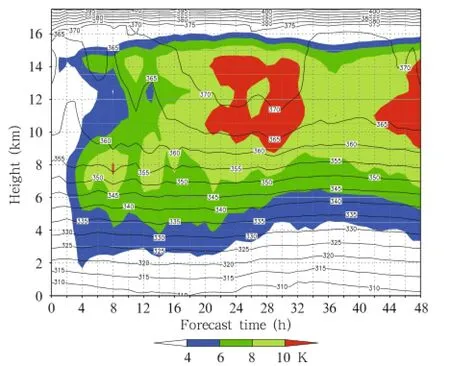
Fig.12.Time series of the simulated area-mean temperature and time-height profile of potential temperature.The potential temperature line is plotted at every 5 K,and the color shadings represent the variation of the central temperature of the typhoon,which is the deviation from the mean temperature at the initial time averaged within the area of 700 km×700 km enclosing the typhoon center.
The rapid intensification of Haiyan had an obvious relationship to the upper-level warm core(Fig. 12).At 2000 UTC 7 November,the upper-level warm core was strongest and the temperature deviation exceeded 10 K.The formation of the upper-level warm core caused the decrease in the central pressure and rapid intensification of the typhoon.In analyzing the rapid intensification of Hurricane Wilma(Zhang and Chen,2012;Chen and Zhang,2013),which occurred in 2005,the important role of the warm core formed at the upper level was explained in detail.The rela-
tionship between the upper-level warm core and the descent of the stratospheric current was highlighted, which was more important than the warm column in the lower layer for the rapid intensification of the typhoon.With the gradual increase of the typhoon’s intensity during 0400-1000 UTC 7 November,the warm core ascended to heights of 6-8 km.When Haiyan reached its maximum intensity,the warm core formed at heights of 12-14 km and the warm bias was much more obvious than at the middle or lower level.Due to the existence of the vigorous upper-level warm core, Haiyan maintained its intensity after passing through the Philippines.
Through an analysis of the isentropic surface in Hurricane Wilma,Zhang and Chen(2012)found that the descent of air from the stratosphere played an important role in the formation of the warm core.The isolines of potential temperature in Typhoon Haiyan were very dense at heights above 16 km(Fig.12) and its vertical gradient was large. The warm air descended obviously during the rapid intensification period of the typhoon,which indicated that a large amount of the warm stratospheric air passed through the troposphere top and converged in the upper layer of the typhoon.This is important with respect to the interpretation of how the upper-level warm core of Haiyan formed and how the rapid intensification occurred.
5.Conclusions and discussion
Super Typhoon Haiyan moved westward rapidly and entered the South China Sea after passing through the Philippines,and then made landfall for a second time in the coastal area of northern Vietnam before moving northeastward.The movement speed reached 35-40 km h-1when Haiyan passed through the Philippines,which was closely simulated by the TRAMS model.
Both typhoons Haiyan(2013)and Megi(2010) were super typhoons that entered the South China Sea in the late stage of the typhoon season,making them worthy of study.In the numerical simulation of Haiyan,violent horizontal cyclonic circulation was caused by the warm sea surface,the upper-level warm core,and the powerful easterly current,which ultimately led to the rapid intensification and quick westward movement of Haiyan.
The shortcomings remaining in the prediction of Haiyan’s track by TRAMS are that the movement speed is too slow in the early stage and the northward deflection after landfall in Vietnam is insufficient.In addition,the predicted intensity is too weak compared to observations.These are the main problems that need to be studied in terms of the development of numerical models for super typhoons.The analysis of the higher-resolution model simulations indicated that the descent of stratospheric warm air and the formation of the upper-level warm core may be important for the rapid strengthening of Haiyan,but these factors receive little attention in current typhoon models. Therefore,research on these aspects will provide important clues to improving the forecasting of super typhoons.
Sensitivity experiments were conducted to study the impact of NWP technology on the improvement of the typhoon forecast.These new technologies showed an improved effect in a batch test,and were thus introduced into the typhoon model for the South China Sea in 2013.The results showed that modifying the model’s configurations,including the boundary layer, cumulus,and orographic gravity-wave parameterizations,improved the forecasted results.Improving the initial atmospheric structure and employing a higher model resolution helped improve the prediction of Haiyan,mainly with respect to 0-36-h forecasts.
Beljaars,A.C.M.,1994:The parameterization of surface fluxes in large-scale models under free-convection. Quart.J.Roy.Meteor.Soc.,121,255-270.
Chen,H.,D.-L.Zhang,J.Carton,et al.,2011:On the rapid intensification of Hurricane Wilma(2005). Part I:Model prediction and structural changes. Wea.Forecasting,26,885-901.
—-,and—-,2013:On the rapid intensification of Hurricane Wilma(2005). Part II:Convective bursts and the upper-level warm core.J.Atmos.Sci.,70, 146-172.
Chen Dehui,1995:New advance in forecast of tropical cy-
clone.Meteor.Sci.Technol.,22,7-12.(in Chinese)
—-,Wang Shiwen,and Wan Houjun,1996:Performance of parameterization of sub-scale physical process in numerical model and its effects on typhoon track forecasting.J.Appl.Meteor.Sci.,7,1-8.(in Chinese)
Dai Guangfeng and Chen Zitong,2013:Sensitive experiments of the surface flux on a simulated typhoon in GRAPES.J.Trop.Meteor.,29,403-410.(in Chinese)
Han,J.,and H.L.Pan,2011:Revision of convection and vertical diffusion schemes in the NCEP global forecast system.Wea.Forecasting,26,520-533.
HeBin,2006: SensitiveexperimentsofTyphoon“MATSA”to parameters used in WRF model. Memoir of Parallel Sessions“Mesoscale Weather Dynamic,Numerical Simulation,and Prediction,”Annual Meeting of the Chinese Meteorological Society,Chengdu,25-27 October 2006,Chinese Meteor. Soc.,283-289.
He Huiqing,Wang Zhenhui,Jing Zhengrun,et al.,2011: The impact of cumulus parameterizations and microphysics schemes under different combinations on typhoon track prediction.J.Trop.Meteor.,17, 113-119.(in Chinese)
Kaplan,J.,and M.DeMaria,2003:Large-scale characteristics of rapidly intensifying tropical cyclones in the North Atlantic basin.Wea.Forecasting,18, 1093-1108.
Kasahara,A.,1957:The numerical prediction of hurricane movement with the barotropic model. J. Meteor.,14,386-402.
Kim,Y.J.,and A.Arakawa,1995:Improvement of orographic gravity wave parameterization using a mesoscale gravity wave model.J.Atmos.Sci.,52, 1875-1902.
Ma Yufen,Shen Tongli,Ding Zhiying,et al.,2009:Numerical simulation and orographic sensitive experiments of Typhoon Saomai during landfall.J.Nanjing Inst.Meteor.,32,277-286.(in Chinese)
Ni Yunqi,Jin Hanliang,and Xue Zhongyuan,1981:An operational numerical forecasting scheme of typhoon tracks over the western Pacific and its preliminary results.Chinese J.Atmos.Sci.,5,281-291.(in Chinese)
Pan,H.L.,and W.S.Wu,1995:Implementing a mass flux convective parameterization package for the NMC medium range forecast model.NMC Office Note 409,40 pp.
Pun,I.-F.,I.-I.Lin,and M.-H.Lo,2013:Recent increase in high tropical cyclone heat potential area in the western North Pacific Ocean.Geophys.Res.Lett., 40,4680-4684.
Rogers,R.,2010:Convective-scale structure and evolution during a high-resolution simulation of tropical cyclone rapid intensification.J.Atmos.Sci.,67, 44-70.
Shi Lijuan,Xu Xiaofeng,Li Bai,et al.,2009:Application of Doppler radar data to the simulation of landfalling Typhoon Saomai.J.Appl.Meteor.Sci.,20, 257-266.(in Chinese)
Wang Kangling,Xue Jishan,and Liang Yanzhao,1987: Split semi-implicit integration of tropical limited area multi-level primitive equation model.Acta Meteor.Sinica,1,123-132.
Wang Shiwen and Li Jianjun,1994:Experiments of real-time numerical weather prediction of typhoon tracks.J.Appl.Meteor.Sci.,5,462-469.(in Chinese)
Xu Yinglong,Zhang Ling,and Gao Shuanzhu,2010:The advances and discussions on China operational typhoon forecasting.Meteor.Mon.,36,43-49.(in Chinese)
Xue Jishan,Wang Kangling,Wang Zhiming,et al.,1988: Test of a tropical limited area numerical prediction model including effect of real topography.Adv.Atmos.Sci.,5,1-23.
—-,—-,and He Anguo,1996:Upgrade of tropical limited-area numerical model and application in typhoon forecast.J.Appl.Meteor.Sci.,2,120-128. (in Chinese)
Yu Yubin,Duan Haixia,Yan Lijun,et al.,2008:Numerical simulation of rapid intensification change of Super Typhoon Saomai(2006)over the coastal water of China.Chinese J.Atmos.Sci.,32,1365-1378.(in Chinese)
Zhang,D.-L.,and H.Chen,2012:Importance of the upper-level warm core in the rapid intensification of a tropical cyclone.Geophys.Res.Lett.,39,L02806, doi:10.1029/2011GL050578.
Zhong Shuixin,Chen Zitong,Dai Guangfeng,et al., 2014:Impacts of orographic gravity wave drag parameterization on the intensity and path forecasting of typhoon.Chinese J.Atmos.Sci.,38,273-284. (in Chinese).
Zhu Yongti,Xu Yiming,Hu Fuquan,et al.,1982:An experiment in numerical forecasting of typhoon tracks with nested models.Acta Meteor.Sinica,40,257-270.(in Chinese)
:Chen Zitong,Zhang Chengzhong,Huang Yanyan,et al.,2014:Track of Super Typhoon Haiyan predicted by a typhoon model for the South China Sea.J.Meteor.Res.,28(4),510-523,
10.1007/s13351-014-3269-2.
(Received March 2,2014;in final form May 28,2014)
杂志排行

Journal of Meteorological Research的其它文章
- Chinese Contribution to CMIP5:An Overview of Five Chinese Models’Performances
- Variations in Regional Mean Daily Precipitation Extremes and Related Circulation Anomalies over Central China During Boreal Summer
- The Persistent Heavy Rainfall over Southern China in June 2010: Evolution of Synoptic Systems and the Effects of the Tibetan Plateau Heating
- Overview of the Major 2012-2013 Northern Hemisphere Stratospheric Sudden Warming:Evolution and Its Association with Surface Weather
- Characteristics of Meteorological Factors over Different Landscape Types During Dust Storm Events in Cele,Xinjiang,China
- Diagnostic Study of Global Energy Cycle of the GRAPES Global Model in the Mixed Space-Time Domain