Chinese Contribution to CMIP5:An Overview of Five Chinese Models’Performances
2014-12-14ZHOUTianjun周天军CHENXiaolong陈晓龙DONGLu董璐WUBo吴波MANWenmin满文敏ZHANGLixia张丽霞LINRenping林千萍YAOJunchen姚隽琛SONGFengfei宋丰飞andZHAOChongbo赵崇博
ZHOU Tianjun(周天军),CHEN Xiaolong(陈晓龙),DONG Lu(董璐),WU Bo(吴波), MAN Wenmin(满文敏),ZHANG Lixia(张丽霞),LIN Renping(林千萍),YAO Junchen(姚隽琛), SONG Fengfei(宋丰飞),and ZHAO Chongbo(赵崇博)
1 State Key Laboratory of Numerical Modeling for Atmospheric Sciences and Geophysical Fluid Dynamics, Institute of Atmospheric Physics,Chinese Academy of Sciences,Beijing 100029
2 University of the Chinese Academy of Sciences,Beijing 100029
3 Climate Change Research Center,Chinese Academy of Sciences,Beijing 100029 4 Laboratory for Climate Studies,National Climate Center,China Meteorological Administration,Beijing 100081
Chinese Contribution to CMIP5:An Overview of Five Chinese Models’Performances
ZHOU Tianjun1,3∗(周天军),CHEN Xiaolong1,2(陈晓龙),DONG Lu1,2(董璐),WU Bo1(吴波), MAN Wenmin1(满文敏),ZHANG Lixia1(张丽霞),LIN Renping1,2(林千萍),YAO Junchen1,2(姚隽琛), SONG Fengfei1,2(宋丰飞),and ZHAO Chongbo4(赵崇博)
1 State Key Laboratory of Numerical Modeling for Atmospheric Sciences and Geophysical Fluid Dynamics, Institute of Atmospheric Physics,Chinese Academy of Sciences,Beijing 100029
2 University of the Chinese Academy of Sciences,Beijing 100029
3 Climate Change Research Center,Chinese Academy of Sciences,Beijing 100029 4 Laboratory for Climate Studies,National Climate Center,China Meteorological Administration,Beijing 100081
An overview of Chinese contribution to Coupled Model Intercomparison Project-Phase 5(CMIP5)is presented.The performances of five Chinese Climate/Earth System Models that participated in the CMIP5 project are assessed in the context of climate mean states,seasonal cycle,intraseasonal oscillation,interannual variability,interdecadal variability,global monsoon,Asian-Australian monsoon,20th-century historical climate simulation,climate change projection,and climate sensitivity.Both the strengths and weaknesses of the models are evaluated.The models generally show reasonable performances in simulating sea surface temperature(SST)mean state,seasonal cycle,spatial patterns of Madden-Julian oscillation(MJO)amplitude and tropical cyclone Genesis Potential Index(GPI),global monsoon precipitation pattern,El Ni˜no-Southern Oscillation(ENSO),and Pacific Decadal Oscillation(PDO)related SST anomalies.However,the performances of the models in simulating the time periods,amplitude,and phase locking of ENSO,PDO time periods,GPI magnitude,MJO propagation,magnitude of SST seasonal cycle,northwestern Pacific monsoon and North American monsoon domains,as well as the skill of large-scale Asian monsoon precipitation need to be improved.The model performances in simulating the time evolution and spatial pattern of the 20th-century global warming and the future change under representative concentration pathways projection are compared to the multimodel ensemble of CMIP5 models.The model discrepancies in terms of climate sensitivity are also discussed.
CMIP5,Chinese models,seasonal cycle,MJO,GPI,ENSO,PDO,global monsoon,Asian monsoon,global warming,climate sensitivity
1.Introduction
The Coupled Model Intercomparison Project (CMIP)was established by the JSC/CLIVAR Working Group on Coupled Modelling(WGCM)under the World Climate Research Programme(WCRP)in 1995 as a standard experimental protocol for studying the outputs of coupled atmosphere-ocean general circulation models(AOGCMs)(Meehl et al.,2000). CMIP provides a community-based infrastructure in support of climate model validation,intercomparison, processes diagnosis,climate change attribution,and climate change projection.CMIP enables a diverse community of scientists around the world from both
the developed and developing countries to analyze the climate models in a systematic fashion.This facilitates both model improvement and our understanding of climate change sciences.The CMIP multimodel dataset has provided the basis for thousands of peerreviewed papers and played prominent roles in the past assessment reports of Intergovernmental Panel on Climate Change(IPCC)on climate variability and climate change.
Supported jointly by the National Natural Science Foundation of China(41125017 and 41330423),National(Key)Basic Research and Development(973)Program of China(2010CB951904),and Public Science and Technology Research Project Funds of Ocean(201105019-3).
∗Corresponding author:zhoutj@lasg.iap.ac.cn.
©The Chinese Meteorological Society and Springer-Verlag Berlin Heidelberg 2014
In the past about 20 years,CMIP has experienced five phases.The first phase of CMIP,called CMIP1,collected output from coupled GCM control runs in which CO2,solar constant and other external climatic forcing are kept constant.A subsequent phase,CMIP2,collected output from both coupled model control runs and matching runs in which CO2increases at the rate of 1%per year(Meehl et al., 1997).In both CMIP1 and CMIP2,besides CO2,no other anthropogenic climate forcing factors,such as anthropogenic aerosols,are included.Neither the control runs nor the increasing CO2runs include natural variations from volcanic eruptions or changing solar brightness in climate forcing.The natural and anthropogenic forcing agents were included in a subsequent pilot project called“20th Century Climate in Coupled Models”(20C3M),which is a core experiment of CMIP3(Meehl et al.,2005).The 20C3M simulation has been widely used in understanding the driving factors of the 20th-century historical climate evolution(Zhou and Yu,2006).After CMIP3,additional simulations were performed that could be used to separate anthropogenic and natural influences on the 20th-century climate during CMIP4(Meehl et al., 2007a).CMIP3 has been an unprecedented international effort to run a coordinated set of 20th-and 21st-century climate simulations,as well as several climate change commitment experiments.The CMIP3 multimodel dataset has provided a new era in climate change research(Meehl et al.,2007a).
In the beginning stage of CMIP,the preliminary purpose of the project is simple,i.e.,to provide climate scientists with a database of coupled GCM simulations under standardized boundary conditions.Thus,the international investigators can use the model output to simply identify aspects of the simulations in which“consensus”in model predictions or common problematic features exist(Meehl et al.,1997).By diagnosing the model outputs,scientists can also discover and understand why different models give different outputs in response to an identical forcing.Following the implementation of CMIP,the purpose of the project has been greatly enriched.In the subsequent phases of CMIP,in addition to the fundamental experiments of the earlier phases of CMIP,more and more new experiments are designed.In the ongoing Coupled Model Intercomparsion Project-Phase 5(CMIP5),the total amount of listed core experiments,and Tier-1 and Tier-2 experiments is far more than that of the past phases of CMIP.CMIP5 aims to provide a multimodel context for“assessing the mechanisms responsible for model differences in poorly understood feedbacks associated with the carbon cycle and clouds;examining climate predictability and exploring the predictive capabilities of forecast systems on decadal timescales; and,more generally,determining why similarly forced models produce a range of responses”(Taylor et al., 2012).
Nearly the entire international climate modeling community has participated in the CMIP project since its inception in 1995.In the ongoing CMIP5 project, more than 20 international modeling groups/centers have performed simulations using more than 40 models.The Chinese climate modeling community has a long history of climate model development.Recognizing the central importance of climate models in climate studies,the Sate Key Laboratory of Numerical Modeling for Atmospheric Sciences and Geophysical Fluid Dynamics(LASG)at the Institute of Atmospheric Physics(IAP),Chinese Academy of Sciences(CAS),has invested huge efforts in GCM developments since the establishment of the laboratory in 1985.Many pioneering Chinese models have been developed at LASG/IAP(Zhang et al.,2000).Model experiments in the context of the various phases of CMIP from CMIP1 to CMIP3 have been run in support of all the assessment reports of the IPCC(see reviews by Zhou et al.,2007;Yu et al.,2008;Wang et al.,2009;Zhang et al.,2010).
From CMIP1 to CMIP3,the LASG/IAP model has been the unique model from China that participated in CMIP.This situation has changed in CMIP5. In the past years,more laboratories and research centers of China have been engaged in the efforts of climate model development.There are five climate models,i.e.,BCC-CSM1-1,BNU-ESM,FGOALS-g2, FGOALS-s2,and FIO-ESM,that have participated in CMIP5.The main motivation of this study is to assess the general performances of these five Chinese climate models in the context of CMIP5 core experiment. This paper can serve as a useful reference and provide an overview of Chinese contribution to CMIP5.
The remainder of the paper is organized as follows.In Section 2,we present an overview of Chinese models that participated in CMIP5.In Section 3, we introduce the model data,the observational or reanalysis data used as observational evidence for model validation. In Section 4,we evaluate the models’performances in the context of climate mean states, seasonal cycle,intra-seasonal oscillation,interannual variability,interdecadal variability,global monsoon, Asian-Australian monsoon,20th-century historical climate simulation,climate change projection,and climate sensitivity.A summary is given in Section 5.
2.Overview of Chinese contribution to CMIP5
Five Chinese Climate/Earth System Models have participated in the ongoing CMIP5 projects.As listed in Table 1,these five models include:1)BCC-CSM1-1 from Beijing Climate Center,China Meteorological Administration(Wu et al.,2010,2014);2)BNU-ESM from Beijing Normal University(Wu et al.,2013);3) two versions of FGOALS2 model,i.e.,FGOALS-g2(Li et al.,2013)and FGOALS-s2(Bao et al.,2013),from the IAP,CAS;4)FIO-ESM from First Institute of Oceanography,State Oceanic Administration of China (Qiao et al.,2013).More detailed model information can be found in Table 1.
Although the five coupled models are different in their components,the model resolutions are,however, generally lower than most CMIP5 models,especially for the atmospheric components as evidenced in Table 2.This suggests that the resolutions of Chinese models need to be increased,and the focus of the climate modeling community in China should be the development of atmospheric models with higher resolutions.
In addition,some Chinese models listed in Table 1 have different versions that employ different resolutions.For example,the standard version of FGOALS-g2 holds a horizontal resolution of 2.8°×2.8°in its atmospheric component,while a lower resolution version,whose atmospheric resolution is 5.0°×4.0°,is used to run the past millennial simulation(Zhou et al.,2008a,2011).The second example is the Beijing Climate Center(BCC)model.In addition to the standard version BCC-CSM1-1,whose horizontal resolution is 2.8°×2.8°in its atmospheric component, a higher resolution version named BCC-CSM1-1(m), with a horizontal atmospheric resolution of 1.125°× 1.125°,is also used to run parts of CMIP5 experiments(Wu et al.,2014).We should note that the horizontal resolution of the atmosphere general circulation model(AGCM)in BCC-CSM1-1(m)is comparable to the multimodel mean of CMIP5 models(cf. Table 2).
Not all Chinese models have performed all CMIP5 experiments.A statistical comparison of CMIP5 experiments performed by different Chinese models is given in Table 3.While nearly all the models have completed the core experiments of CMIP5,there are spreads among the models in performing the Tier-1 and Tier-2 experiments of CMIP5(Taylor et al.,2012). Both BCC and IAP models have completed major parts of CMIP5 Tier-1 and Tier-2 experiments.The Earth System Model(ESM)experiments were also run by using BCC,BNU models and partly by using IAP models.Only part of CMIP5 experiments were run by using FIO-ESM.
The data outputs of Chinese models are huge, as other CMIP5 models. Our statistics show that the number of completed CMIP5 experiments is 80, 12,16,28,23,and 8 for BCC-CSM1-1,BCC-CSM-1-1(m),BNU-ESM,FGOALS-g2,FGOALS-s2,and FIO-ESM,respectively.The corresponding number of
total datasets archived in the ESG-node is 3328,283, 241,899,186,and 170,respectively.It has been a great challenge to treat and archive all these datasets.
Although the five Chinese CMIP5 models are developed by four institutions,there are intimate collaborations among the Chinese climate modeling agencies.A tangible example of success in interagency collaboration is FGOALS model.The development of FGOALS2 is a team effort and involves a broad crosssection of expertise and graduate students from both within and outside LASG/IAP.The two versions of FGOALS2,i.e.,FGOALS-g2 and FGOALS-s2,share a common coupling framework and common ocean and land components but employ different atmospheric and sea ice components.Although the developments of both versions are being undertaken primarily at LASG/IAP,many individuals and institutions have contributed in substantive ways to the developments of the FGOALS2 model.For example,the First Institute of Oceanography of the State Oceanic Administration has contributed to the setup of the coupler used in both versions of FGOALS2.The Center of Earth System Science(CESS)at Tsinghua University has contributed to optimization of the code for the atmospheric component of FGOALS-g2,and parts of the FGOALS-g2 CMIP5 experiments were run by the supercomputer at Tsinghua University.The State Key Laboratory of Atmospheric Boundary Physics and Atmospheric Chemistry(LAPC)of IAP has contributed to the ocean carbon cycle module of FGOALS-s2,and the School of Atmospheric Sciences at Nanjing University has contributed to the assessment and improvement of the FGOALS models.The supercomputing centers of the IAP and the Chinese Academy of Sciences have provided most of the computer resources required for the FGOALS CMIP5 experiments.This cooperative effort between several research groups(both within LASG/IAP and from research centers and institutions outside LASG/IAP)is crucial to achieving the successful development of FGOALS2,although achallenging degree of coordination is needed,as what we have done in the past six years.The success of FGOALS CMIP5 experiment should be an encouraging beginning in promoting model collaborations in China.

Table 1.Institution,model designation,and horizontal and vertical resolution of the five Chinese Climate/Earth System Models used in this study

Table 2.Horizontal resolution of CMIP5 models
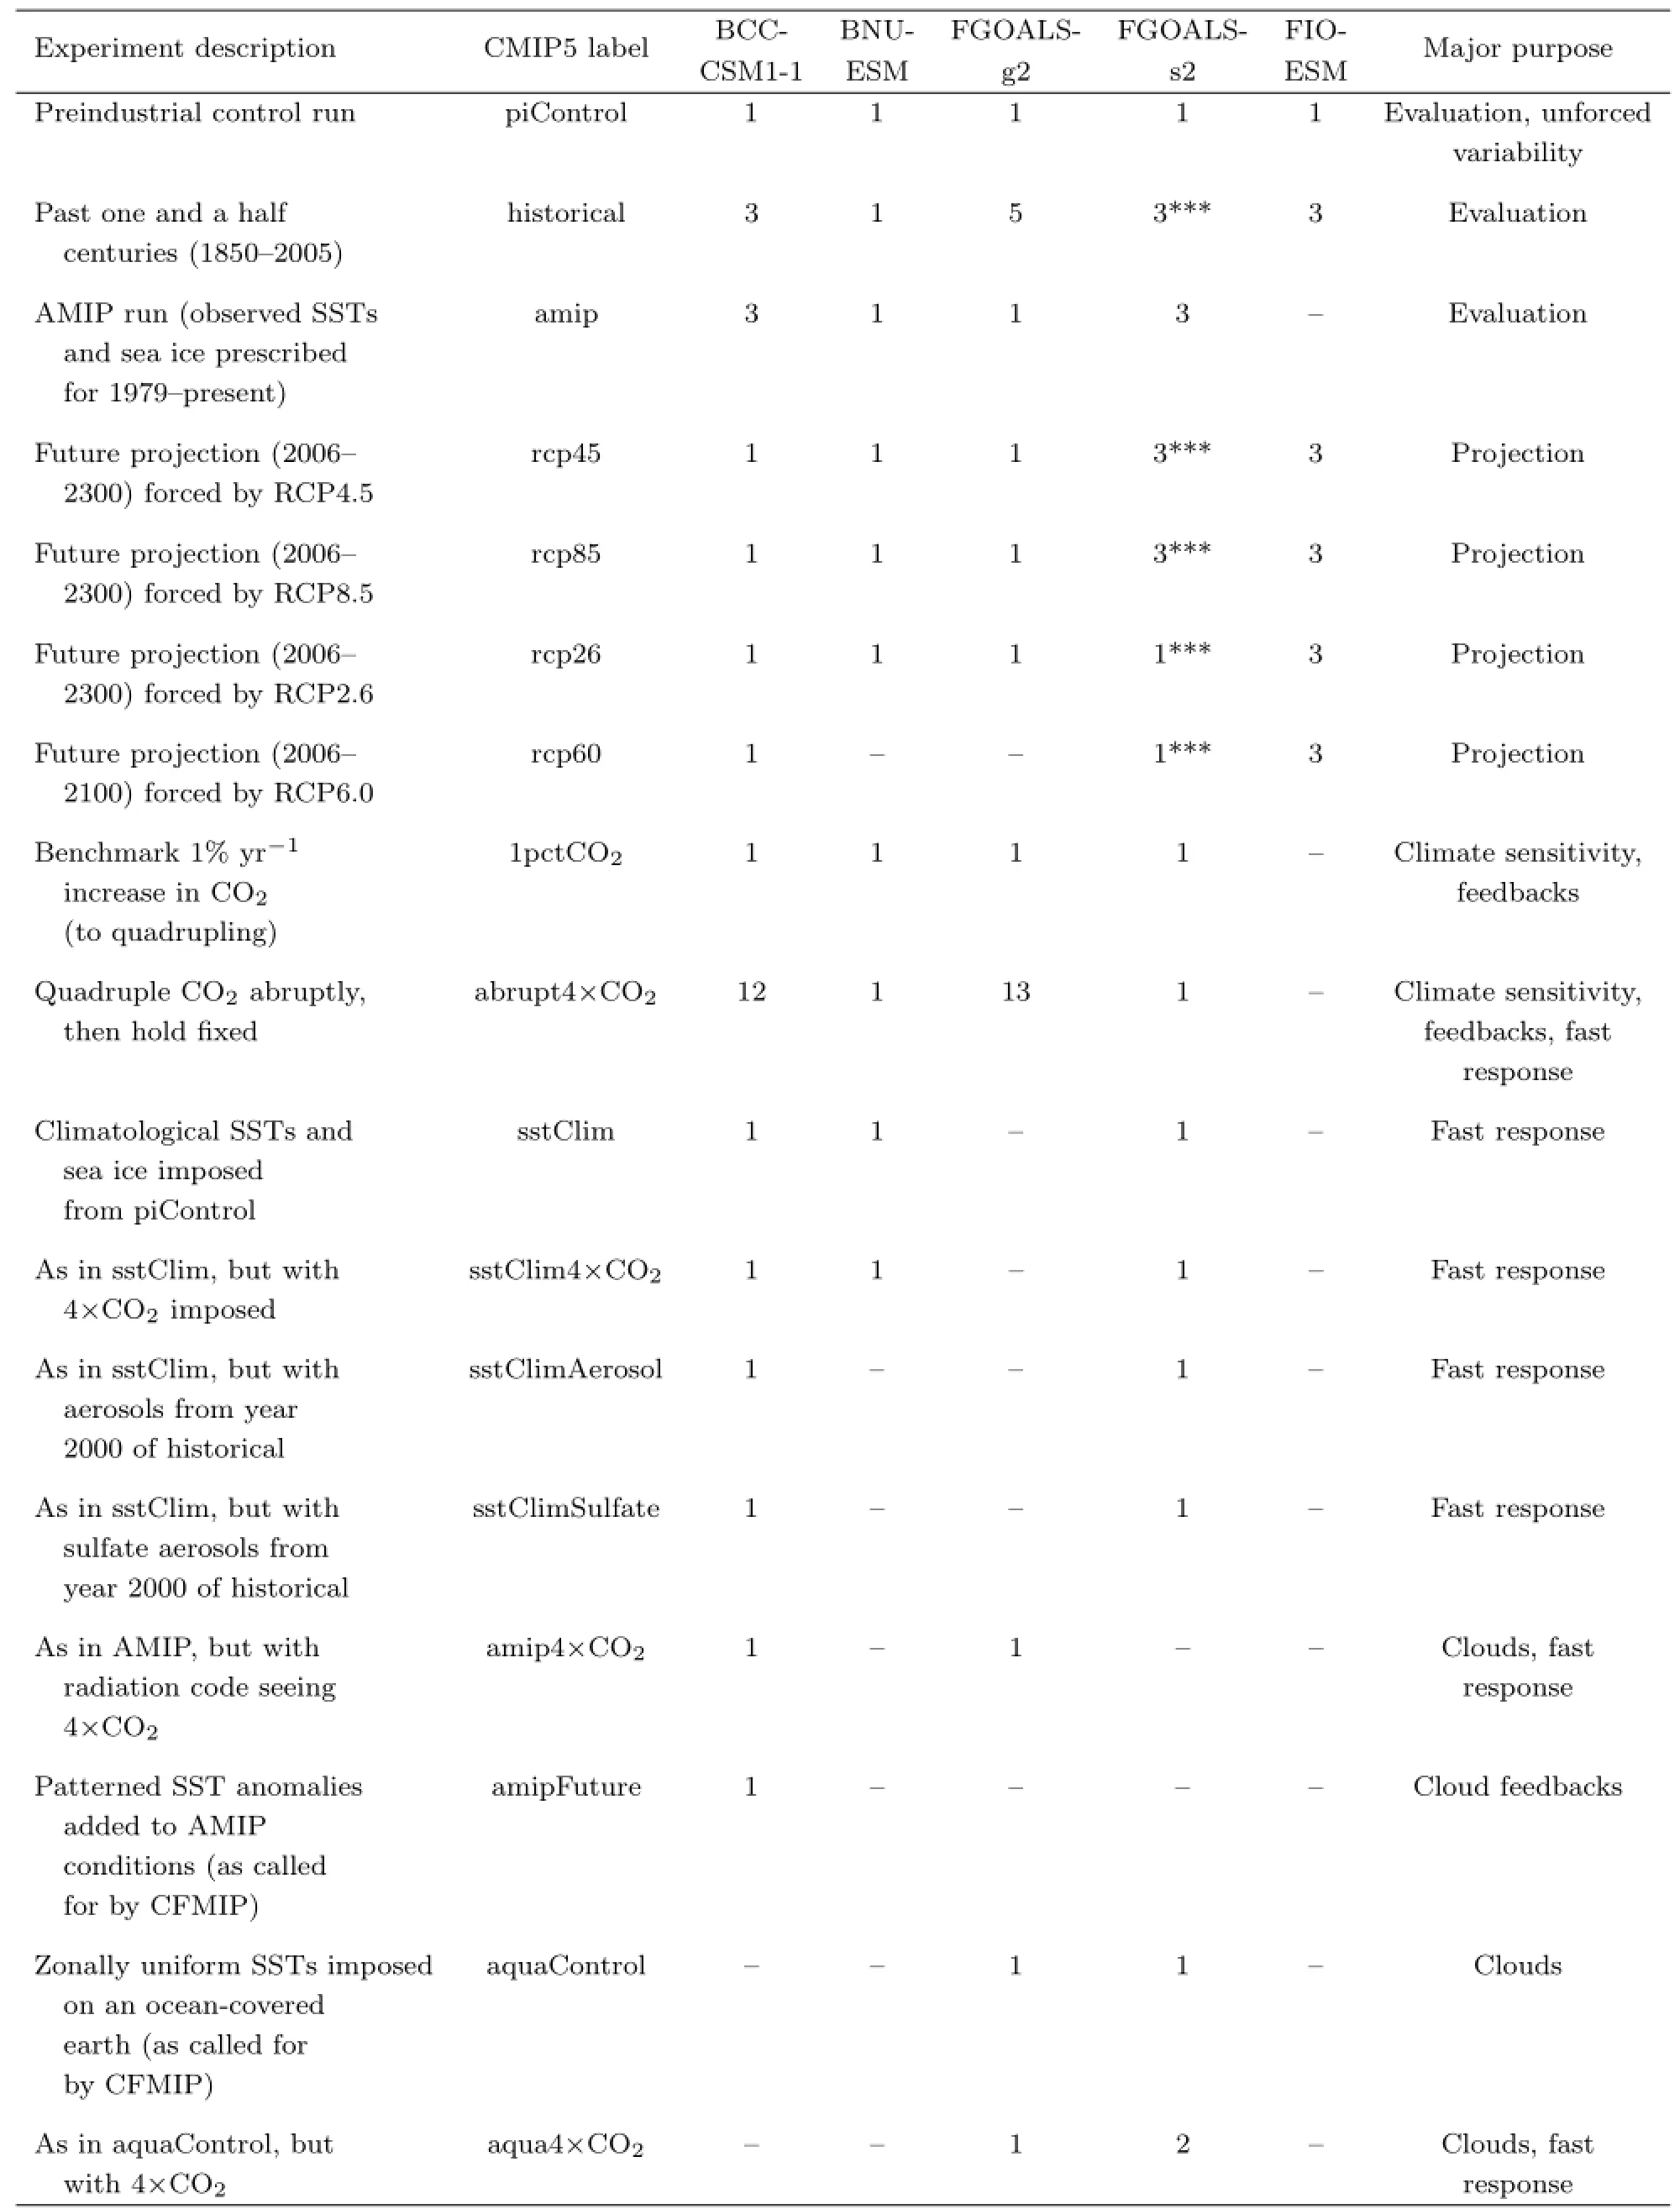
Table 3.List of Chinese models’CMIP5 experiments*

Table 3(Continued)
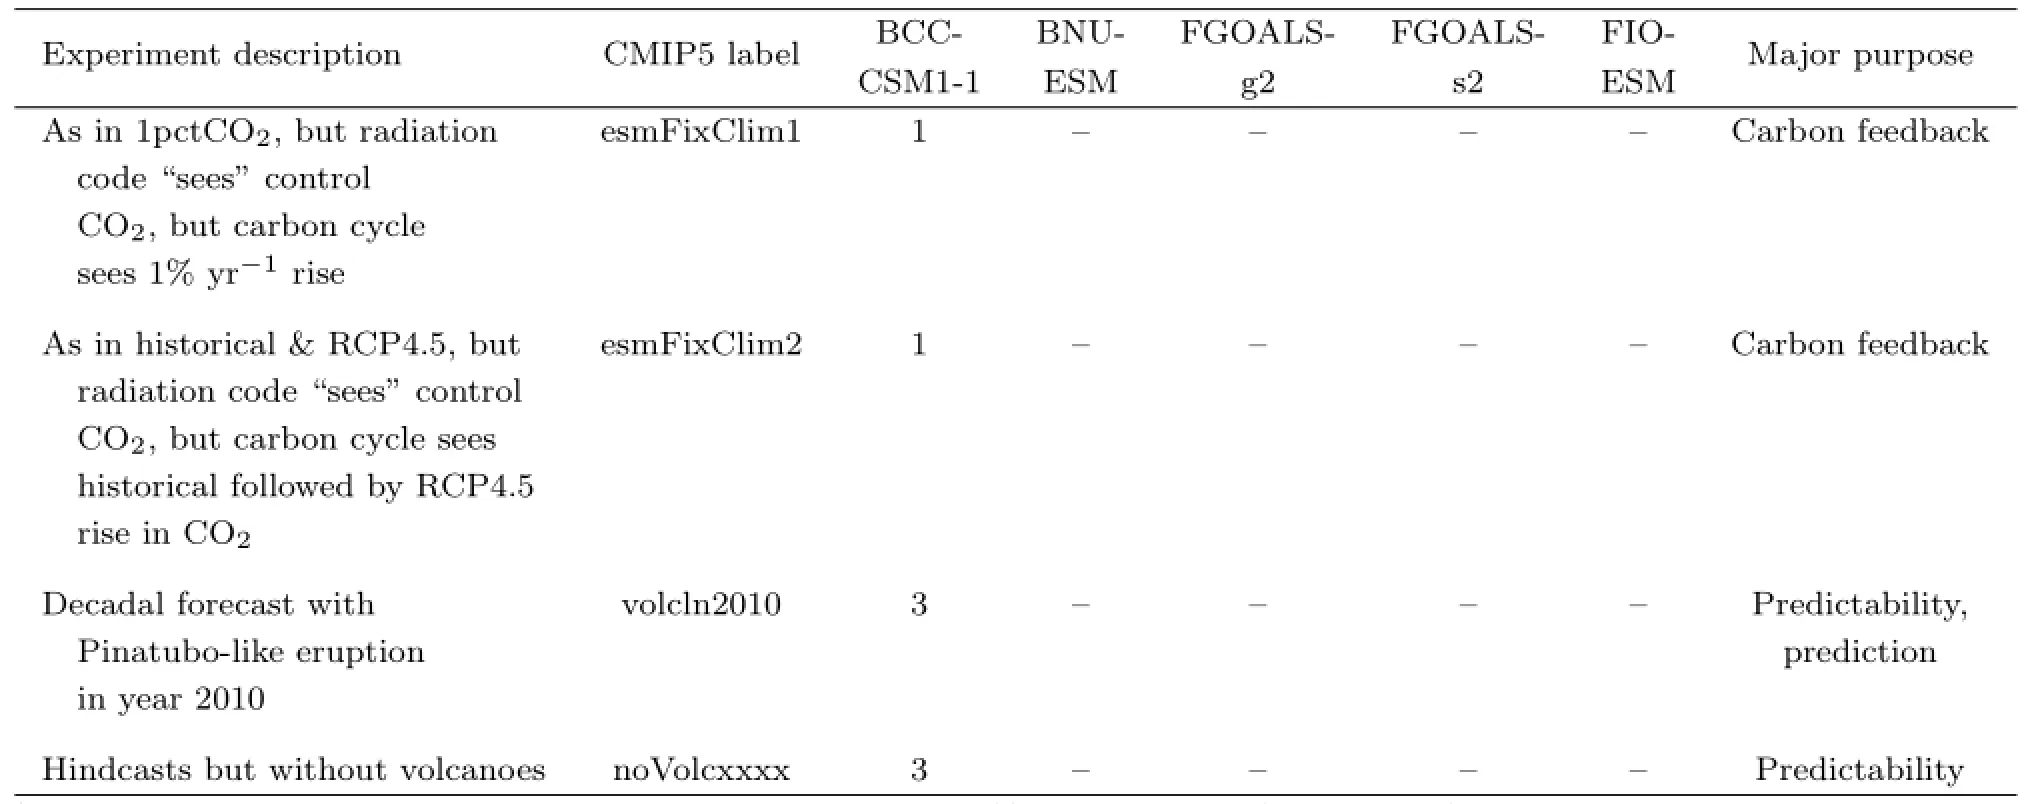
Table 3(Continued)
3.Data and analysis method
The observational datasets used in this study are listed as follows:
1)Monthly sea surface temperature(SST)data from the Met Office Hadley Centre’s sea ice and SST dataset(HadISST;Rayner et al.,2003);
2)Monthly and pentad precipitation data from the Global Precipitation Climatology Project(GPCP; Adler et al.,2003;Xie et al.,2003),and CPC Merged Analysis of Precipitation(CMAP;Xie and Arkin, 1997);
3)850-hPa wind from the National Centers for Environment Prediction-Department of Energy Atmospheric Model Intercomparison Project II Reanalysis(NCEP2;Kanamitsu et al.,2002),and Japan Meteorological Agency and the Central Research Institute of Electric Power Industry Reanalysis-25(JRA-25;Onogi et al.,2007);
4)850-and 200-hPa horizontal wind,500-hPa p-velocity,700-hPa relative humidity,air temperature and specific humidity from 1000 to 1 hPa from ERA-Interim produced by the European Centre for Medium-Range Weather Forecasts(ECMWF;Dee et al.,2011);
5)Surface air temperature from NASA GISS Surface Temperature Analysis(GISTEMP;Hansen et al., 2010).
The outputs of five Chinese Climate/Earth System Models’CMIP5 experiments are analyzed in this study.Note that the BCC model has two versions and only the data of BCC-CSM1-1 are analyzed,since we focus on large-scale features of the climate and the two model versions are similar in their performance based on the metrics used in our evaluation.The analysis mainly focuses on the 20th-century historical climate simulation.We employ on the first realization of historical experiment of each model to evaluate the simulated climatology and variability.
In addition,the abrupt 4×CO2and piControl experiments of 18 CMIP5 models are used for estimating climate sensitivity of the models.In the analysis of the 20th-century historical climate simulation and future climate change projection,the multimodel ensemble mean of 35 CMIP5 models(van Oldenborgh,2013) is also used.The details of CMIP5 experiments are
referred to Taylor et al.(2012).
In the present study,the evaluation is mainly for the period 1986-2005.The climate mean state is defined as an average of 1986-2005.The empirical orthogonal function(EOF)for SST is used to reveal El Ni˜no-Southern Oscillation(ENSO)mode(20°S-20°N, 120°E-80°W)and Pacific Decadal Oscillation(PDO) mode(20°-60°N,115°E-115°W).For global monsoon, the monsoon mode(i.e.,solstitial mode)is derived from the rainfall difference between June-September and December-March,whereas the spring-fall asymmetric mode(i.e.,equinoctial asymmetric mode)is defined as the rainfall difference between April-May and October-November(Wang and Ding,2008;Lin R.et al.,2013;Zhang and Zhou,2014).Linear regression is used to investigate the circulation patterns related to ENSO and monsoon.Filtering method is used for extracting the intraseasonal and interdecadal signals in the assessment of Madden-Julian Oscillation(MJO) and PDO,respectively.Trend analysis is applied to the 20th-century warming and future climate projection.Gregory-style method is used to estimate climate sensitivity of coupled models(Gregory et al.,2004).
4.Results
4.1 SST mean state and seasonal cycle
To examine the performance of the five Chinese models in simulating SST distribution,we firstly assess the simulated climatological SST pattern by comparing model results to HadISST(Rayner et al.,2003). The simulated SST patterns and their bias relative to the observation are shown in Fig.1.The warm pool areas(surrounded by 28℃isotherms)in the western Pacific and Indian Ocean are more confined to the equator in these five models than in observation.In addition,the warm pool in models,except FGOALS-g2,extends eastward compared to observation.The large warm biases of SST mainly are located in the Pacific cold tongue in all the five Chinese models.The bias in FGOALS-g2 might be related to the overestimation in surface shortwave radiation and the weak coastal oceanic upwelling(Lin P.F.et al.,2013).In the Indo-Pacific warm pool,cold biases dominate in FGOALS-s2,FGOALS-g2,and BCC-CSM1-1,while warm biases dominate in BNU-ESM and FIO-ESM.To quantitatively compare the simulation skills of these models,the weighted mean SST bias over the global ocean and the root-mean-square-error(RMSE)between each simulated pattern and the observation are calculated and shown in Fig.1.The results show that all the five models exhibit a colder SST,with biases of -0.85,-0.87,-1.59,-0.96,and-0.88 K,respectively. Compared to other four models,BCC-CSM1-1 has a smaller cold bias and RMSE and is closer to observation.
The observed SST shows a significant annual cycle in the eastern Pacific because of dominant oceanic dynamic processes,while a semiannual cycle in the western Pacific because of prevailing thermodynamic processes(Fig.2a).This characteristic is well captured by the five Chinese models.However,most models show that the simulated cold tongue shifts westward by about 10°.The results are consistent with that of Yu et al.(2013)who have compared FGOALS2 with earlier version FGOALS1.Yu et al.(2013)also show that the improvement of FGOALS2 relative to FGOALS1 in the simulation of SST annual cycle is significant.The annual cycle in the eastern Pacific is weaker in FGOALS-g2,BCC-CSM1-1,and FIO-ESM than in observation(Figs.2b,2d,and 2f).The intensity of the annual cycle in the eastern Pacific and the semiannual cycle in the western Pacific in FGOALS-s2 and BNU-ESM are similar to those in observation (Figs.2c and 2e).In conclusion,the comparison to the observation indicates reasonable performances of the five Chinese models in simulating SST mean state and seasonal cycle.
4.2 MJO
MJO is the most prominent intraseasonal phenomenon in the tropics.The precipitation data subjected to a 20-100-day band-pass filter based on harmonic decomposition represent the intraseasonal component in the following analyses.We use 20(1986-2005)winters(November-April)data to validate the simulations and examine the biases of MJO characteristics.

Fig.1.(a)Observed climatological SST pattern(℃)for 1986-2005 of HadISST.Simulated climatological SST(contours) and the difference(simulation minus observation)(℃)between the simulated SST and that from HadISST(shaded)in (b)BCC-CSM1-1,(c)BNU-ESM,(d)FGOALS-g2,(e)FGOALS-s2,and(f)FIO-ESM.The numbers on the top right of each figure denote the mean of model bias and the RMSE relative to observation(in bracket),respectively.The dark thick lines represent 28℃isotherms.
Because the FIO has not submitted the daily data to the CMIP5 dataset archives up to now,only the rest four Chinese models are analyzed here.The horizontal distribution of the intraseasonal precipitation variance during boreal winter presenting the intensity of MJO is shown in Fig.3.The four models basically produce the MJO signal,and the pattern correlation coefficient between models and CMAP are around 0.7.However, BCC-CSM1-1 obviously overestimates the MJO variability,while BNU-ESM and FGOALS-g2 underestimate it compared to the observation.
To provide a comprehensive evaluation on the period and propagation simulations of MJO,Fig.4 shows the wavenumber-frequency spectrum of 20-100-day filtered precipitation anomaly during boreal winter. In the observation,the eastward propagation of MJO is dominant and the ratio between the MJO variance and the variance of westward counterpart is around 2.1. The strongest energy spectrum appears during the period of 45-60 days.For the four model spectrums,eastward over westward power is too weak on MJO timescales.The ratios in BNU-ESM and FGOALS-s2 being nearly equal to one show standing oscillations instead of the dominant
eastward-propagating signals.The significant period has the spectral peak in 30 days in BCC-CSM1-1 and FGOALS-s2,which is shorter than that in CMAP and GPCP(Figs.4c and 4f).

Fig. 2.Seasonal cycle of tropical SST(℃)averaged between 5°N and 5°S from(a)observation(HadISST)and simulations of(b)BCC-CSM1-1,(c)BNU-ESM,(d)FGOALS-g2,(e)FGOALS-s2,and(f)FIO-ESM.
4.3 ENSO
ENSO is the strongest signal of interannual climate variability originated from air-sea interaction in the tropical Pacific(Philander,1990). To extract ENSO signal objectively,we apply EOF analysis to monthly SST anomaly(SSTA)in the tropical Pacific (20°S-20°N,120°E-80°W)from 1979 to 2005 for the observation data and each model run.The first EOF modes are ENSO modes for all the model runs.Then, we regress SST,precipitation,and 850-hPa wind fields onto the normalized first principal component(PC) time series(Fig.5).
All the five models can simulate the warm SSTA in the equatorial central-eastern Pacific,though the spatial patterns of the warm SSTA are somewhat different from the observation(Figs.5a-f).Firstly,the warm SSTA simulated by BNU-ESM,FGOALS-g2, and FGOALS-s2 excessively extends westward relative to that in the observation.Secondly,meridional widths of the warm SSTA in all the five models are narrower than that in the observation.For the amplitude, ENSOs simulated by BCC-CSM1-1,FGOALS-g2,and FGOALS-s2 are close to that in the observation,while those simulated by BNU-ESM and FIO-ESM are much stronger.
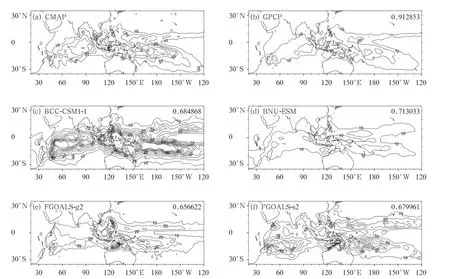
Fig.3.20-100-day filtered precipitation variance(mm2day-2)during boreal winter(November-April)of 1986-2005 derived from(a)CMAP,(b)GPCP,(c)BCC-CSM1-1,(d)BNU-ESM,(e)FGOALS-g2,and(f)FGOALS-s2.The correlation coefficient with CMAP is labeled on the top right of each panel.
The warm SSTA enhances the local convection. However,because of the nonlinear response of the tropical convection to underlying SST anomalies(Hoerling et al.,1997),the positive precipitation anomalies are primarily located in the equatorial central Pacific(Fig.5g).Meanwhile,equatorial low-level westerly anomalies extend from about 150°E to 100°W. The westerly anomalies correspond to the weakening of the easterly trade wind,and play essential roles in both the positive Bjerknes feedback(Bjerknes,1969) and the negative feedback mechanisms,such as delayed oscillator theory(Suarez and Schopf,1988), or recharge-discharge theory(Jin,1997). All the five models can reproduce the positive precipitation anomalies and westerly anomalies reasonably(Figs. 5g-l). The major discrepancies are the somewhat westward extension of the precipitation and westerly anomalies in BNU-ESM,FGOALS-g2,and FGOALS-s2,as well as their eastward shifts in FIO-ESM.
In the observation,El Nin˜o events generally establish in boreal summer,reach peak phases in boreal winter and then decay fast,which is referred to as the phase locking of ENSO to the seasonal cycle (Rasmusson and Carpenter,1982).To assess the five model performances in simulating this characteristics, we select strong El Ni˜no events,with normalized PC indices greater than 1,and then make composite analysis.BNU-ESM,FIO-ESM,and FGOALS-g2 can reasonably reproduce the phase locking of ENSO,while the characteristic is not significant in BCC-CSM1-1 and FGOALS-s2(figure omitted).
Except for the above basic characteristics of ENSO,many other important characteristics deserve further evaluations,such as temporal evolution,frequency,strengths of various feedbacks,asymmetry between El Ni˜no and La Ni˜na,ENSO-monsoon relationship,and many others(readers may refer to Bellenger et al.,2013).The ENSO flavors simulated by different coupled models would impact the performance of the models in simulating ENSO-related climate anomalies such as ENSO-monsoon relationship(Wu and Zhou, 2013).
4.4 PDO
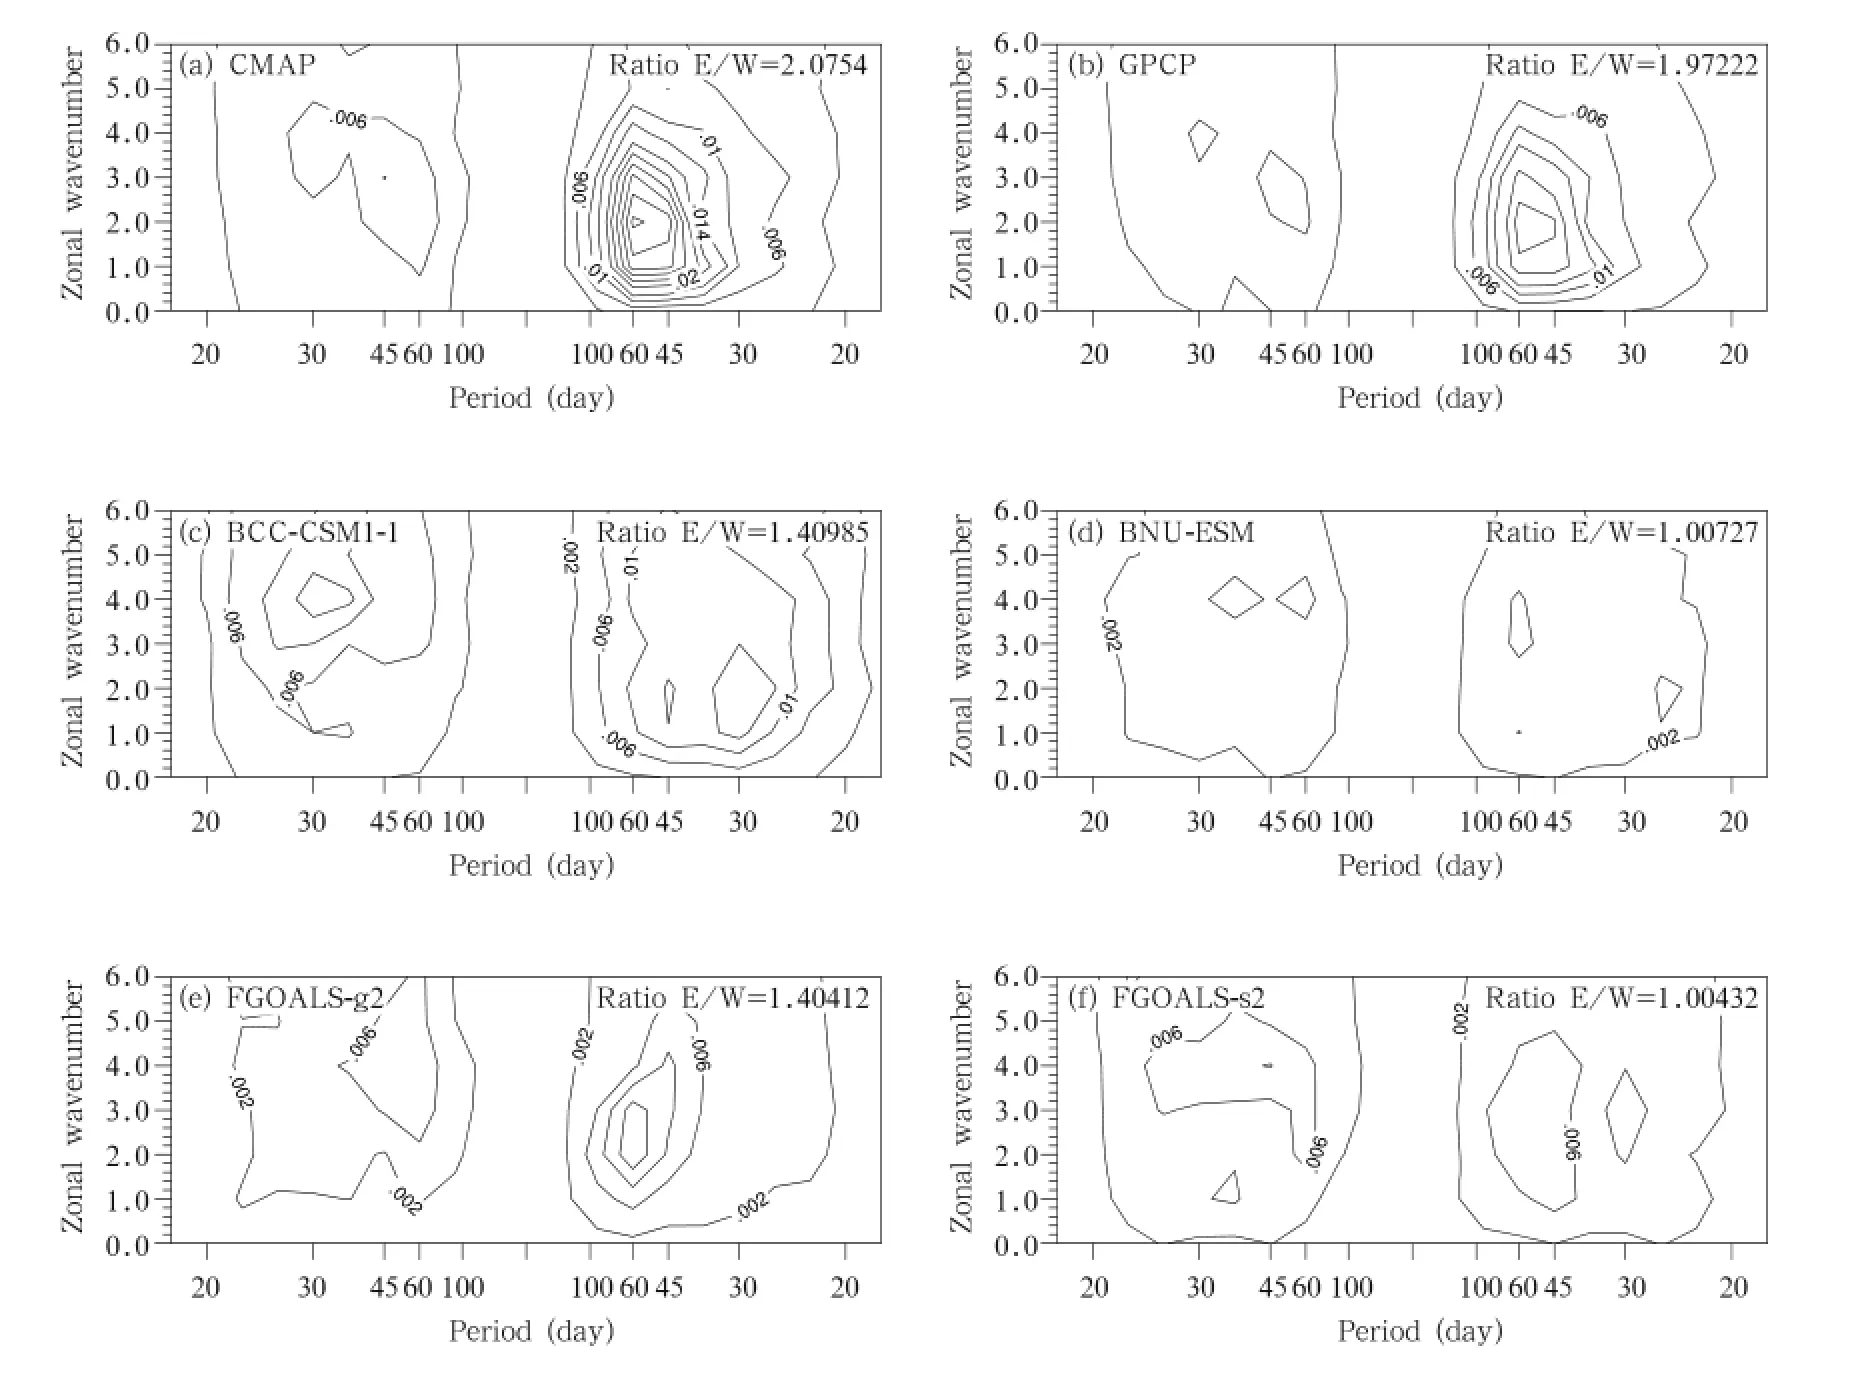
Fig.4.Wavenumber-frequency spectra(mm2day-2)of 20-100-day filtered precipitation averaged between 20°S and 20°N during November-April 1986-2005 in(a)CMAP,(b)GPCP,(c)BCC-CSM1-1,(d)BNU-ESM,(e)FGOALS-g2, and(f)FGOALS-s2.Ratio between the MJO variance and the variance of westward counterpart(wavenumbers 0-6, 20-100-day mode)is labeled on the top right of each panel.
PDO is the strongest interdecadal variability of SST in the northern Pacific Ocean and can have a“far field”influence on climate through atmospheric teleconnections(Mantua and Hare,2002). In our study,PDO index is defined as the principal component of the first leading EOF mode of 9-30-yr bandpass filtered SST over the North Pacific region(20°-60°N,115°E-115°W).We obtain the PDO-related SST anomalies by regressing the SST onto the standardized PDO index(Fig.6).The SST patterns associated with positive PDO phase have a broad area of positive SST anomalies in the tropical Pacific and along the west coast of North and South America, with negative SST anomalies in Northwest and Southwest Pacific(Fig.6a).The five Chinese models can well reproduce the PDO-related SST anomaly pattern, with explained variance from 31.71%in FGOALS-s2 to 37.28%in FGOALS-g2 of the interdecadal SST variability in North Pacific,all lower than that in observation(42.83%).The patterns of FGOALS-s2 and FIOESM are closer to that of observation,with correlation coefficient exceeding 0.7(Figs.6e and 6f).The pattern correlation coefficients between each model and observation are all statistically significant at the 1% level by Student’s t-test.Thus,all the five Chinese models can well capture the main characteristics of PDO-related SST anomaly pattern. This provides a solid basis for the future study of PDO evolution mechanisms as done by Dong and Zhou(2014)using FGOALS-gl.
Power spectral analyses of PDO index show that the dominant periods are about 12 and 17 yr for BCC-CSM1-1,13 yr for BUM-ESM,14 and 20 yr for FGOALS-g2,12-13 and 20 yr for FGOALS-s2,and
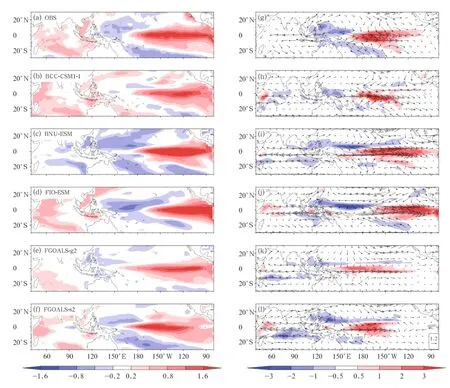
Fig.5.(a,b,c,d,e,f)ENSO-related SST anomalies(K)in the observation and five model runs.The SST anomalies are derived from the EOF analysis applied to the monthly SSTA in the tropical Pacific.(g,h,i,j,k,l)Corresponding precipitation(mm day-1)and 850-hPa wind anomalies(m s-1).
12-14 yr for FIO-ESM(figure omitted).In the observation,the dominant time period of PDO is about 20 yr during 1900-2008(Deser et al.,2010).The comparison indicates that while the Chinese models are able to reasonably simulate the pattern of SST associated with PDO,weaknesses are still evident in the simulation of the time periods of PDO.The limitation of the models in this regard may impact its ability in the simulation of PDO-related climate anomalies over the monsoon domain(Qian and Zhou,2013).
4.5 Global monsoon
The global monsoon system can be seen as a persistent global-scale overturning of atmosphere that varies with the time of year(Trenberth et al.,2000) and can be examined as a whole.It has been an important metric to evaluate the performance of climate models(Zhou et al.,2008b;Zhang et al.,2010;Lin et al.,2012,2013;Kitoh et al.,2013).The climatology of global monsoon is examined from three aspects proposed by Wang and Ding(2008),i.e.,monsoon mode, spring-fall asymmetric mode,and global monsoon domain.
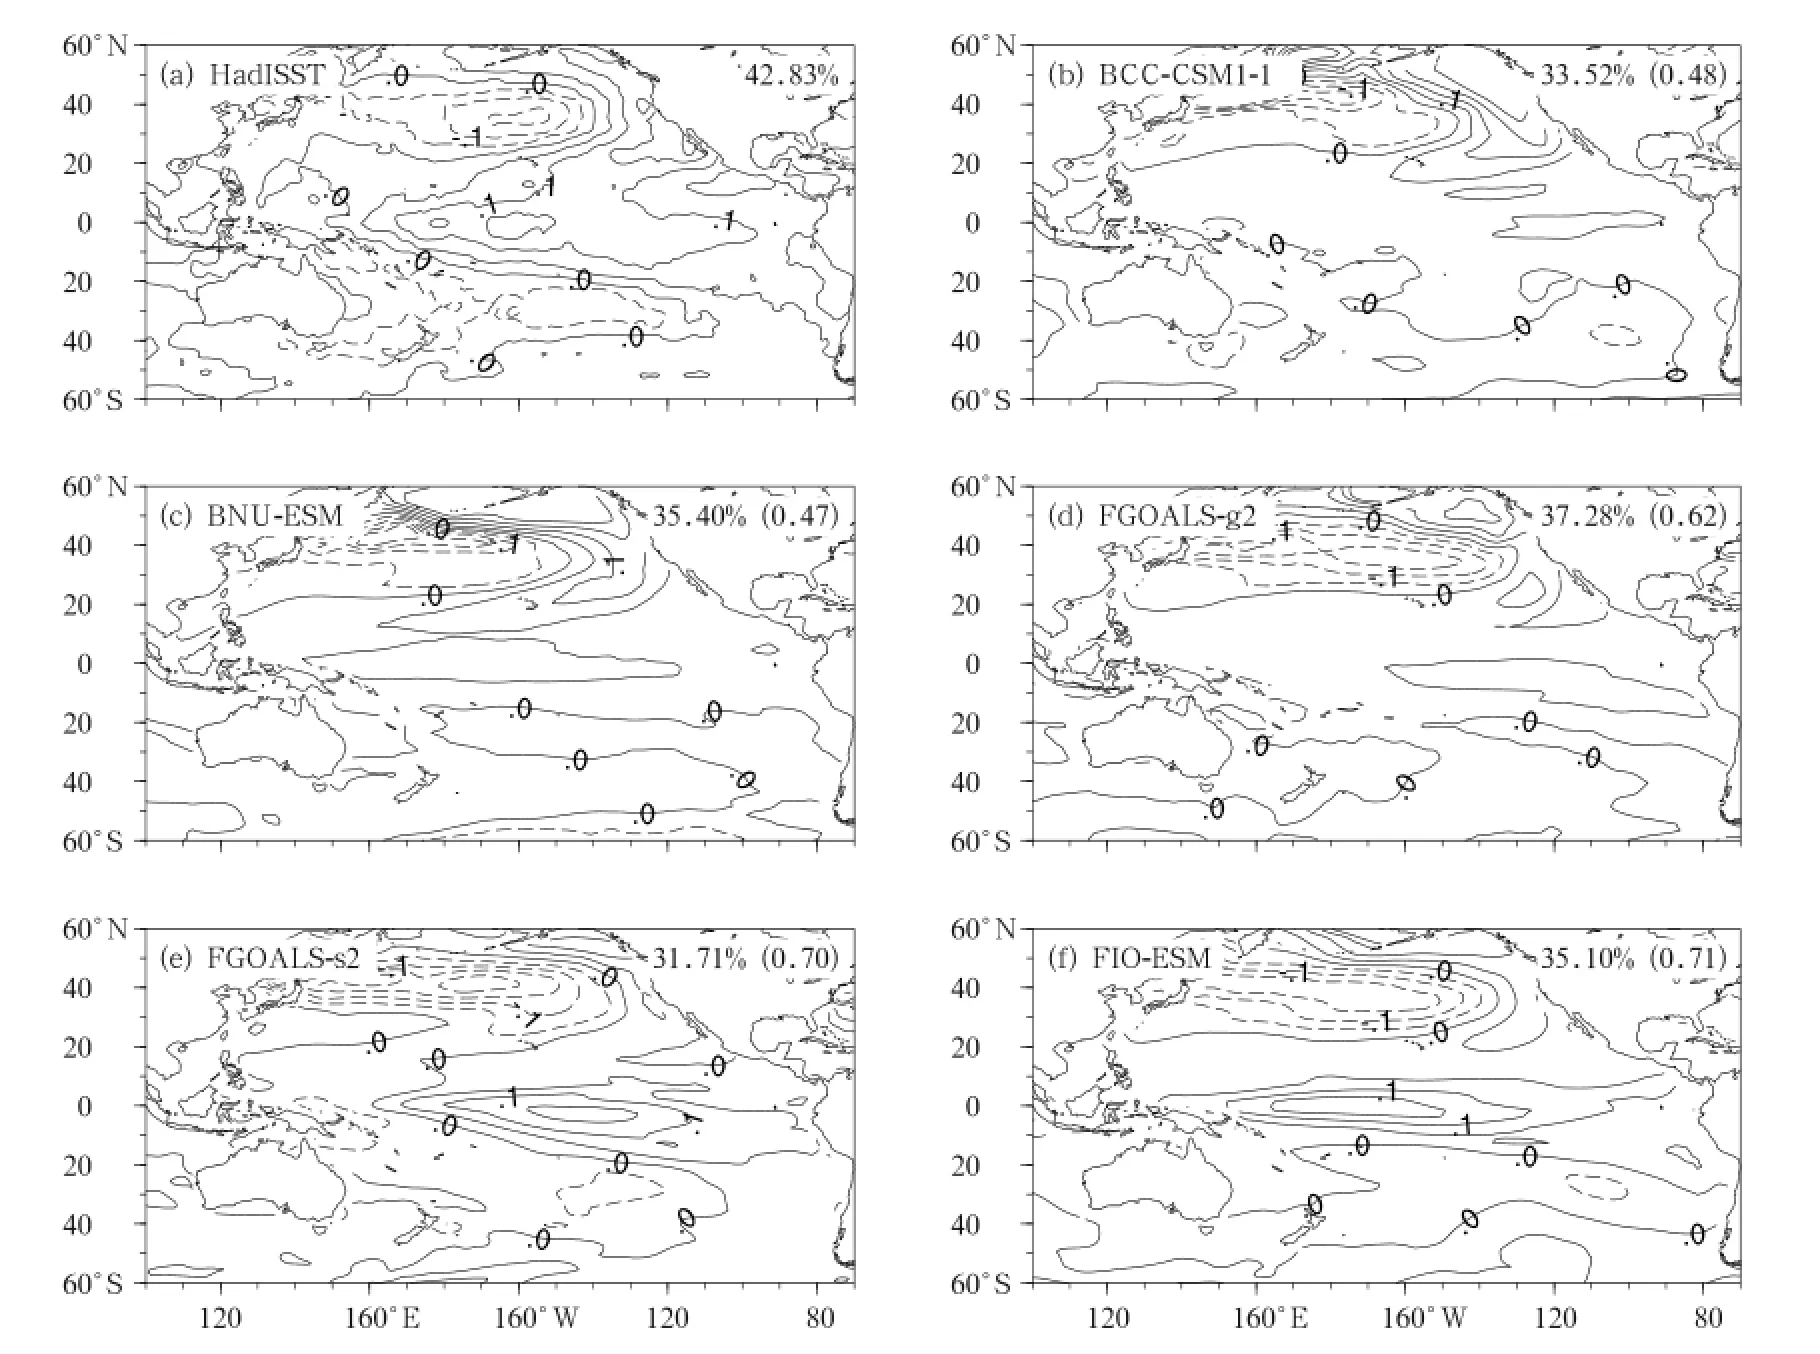
Fig.6.PDO-related SST anomalies(℃)in(a)observation(HadISST)and(b)BCC-CSM1-1,(c)BNU-ESM,(d) FGOALS-g2,(e)FGOALS-s2,and(f)FIO-ESM.PDO index is defined as the principal component of the first leading EOF of 9-30-yr band-pass filtered SST over the North Pacific region(20°-60°N,115°E-115°W).The numbers on the top right of each figure denote the explained percent variance and the pattern correlation coefficient with observation (in bracket),respectively.
The distributions of monsoon and spring-fall asymmetric mode in observation and simulations are shown in Fig.7.The observed monsoon mode shows an anti-symmetric pattern about the equator,while the spring-fall asymmetric mode shows a negative pattern over the Northern Hemispheric ocean and a positive pattern over the Asian continent and Southern Hemispheric ocean.The two modes are realistically reproduced by the five models,with the pattern correlation coefficients(PCC)higher than 0.75 in monsoon mode(Figs.7a-f)and 0.60 in spring-fall asymmetric mode(Figs.7g-i).The monsoon mode over western North Pacific(WNP)and maritime continent is overestimated by BCC-CSM1-1,but underestimated by FGOALS-g2 and FGOALS-s2.In the spring-fall asymmetric mode,all models overestimate the magnitude over the tropical Pacific Ocean.The monsoon mode is best simulated by BNU-ESM(Fig.7c),which has the highest PCC(0.81)and lowest RMSE(1.67), while for spring-fall asymmetric mode the highest PCC is seen in BNU-ESM(Fig.7i)and lowest RMSE(1.46) is seen in FGOALS-g2(Fig.7j).
The distributions of precipitation annual range (shaded)and monsoon domain(contours)in observation and simulations are shown in Fig.8.In the observation,large annual range is seen in the monsoon domains(Fig.8a).All models can well capture the distribution of precipitation annual range and monsoon domains,with the PCC of annual range higher than 0.7(Figs.8b and 8f).However,the northern western Pacific monsoon domain and North American monsoon are smaller than the observation in all models,except for BCC-CSM1-1.The weaker WNP monsoon in FGOALS-s2 is due to its simulated colder SST over the western Pacific warm pool(Zhang and
Zhou,2014).In comparison,BNU-ESM shows the largest PCC and smallest RMSE in simulating annual range,and the monsoon domain in BCC-CSM1-1 is the most similar to the observation.

Fig.7.Observed and simulated monsoon mode(left panels)and spring-fall asymmetric mode(right panels)of precipitation(shaded;mm day-1)that are derived from(a,g)GPCP,(b,h)BCC-CSM1-1,(c,i)BUN-ESM,(d,j)FGOALS-g2, (e,k)FGOALS-s2,and(f,l)FIO-ESM,respectively.Contours range from-3 to 7 by 2(no zero line).Monsoon (spring-fall asymmetric)mode is defined as precipitation in June-September(April-May)minus that in December-March(October-November).
4.6 Genesis potential index(GPI)of tropical cyclone
Tropical cyclone genesis potential index(GPI)is a useful tool for evaluating the performance of global climate models in the tropical cyclone(TC)genesis simulation.Previous study has used GPI to evaluate the LASG/IAP AGCM over western North Pacific (Tian et al.,2013).Following Murakami et al.(2011), GPI is defined as:

where η is absolute vorticity at 850 hPa,RH is relative humidity at 700 hPa,Vmaxrepresents the maximum potential intensity(MPI)(Emanuel,1988),Vsis the magnitude of vertical wind shear between 850 and 200 hPa,and ω is the vertical wind velocity at 500 hPa.
在小学数学教学中,应用数学综合实践活动教学模式,不仅符合新时期的教学需要,而且还可以提高数学课堂教学的效果。但在实际应用中,还存在一些问题,如教学理念僵化,缺乏对学生兴趣的考虑,重视程度不足等。因此,要想充分发挥综合实践教学活动的作用,就应转变教学的理念,优化教学设计,提高对教学模式的重视程度,进而提高教学水平。
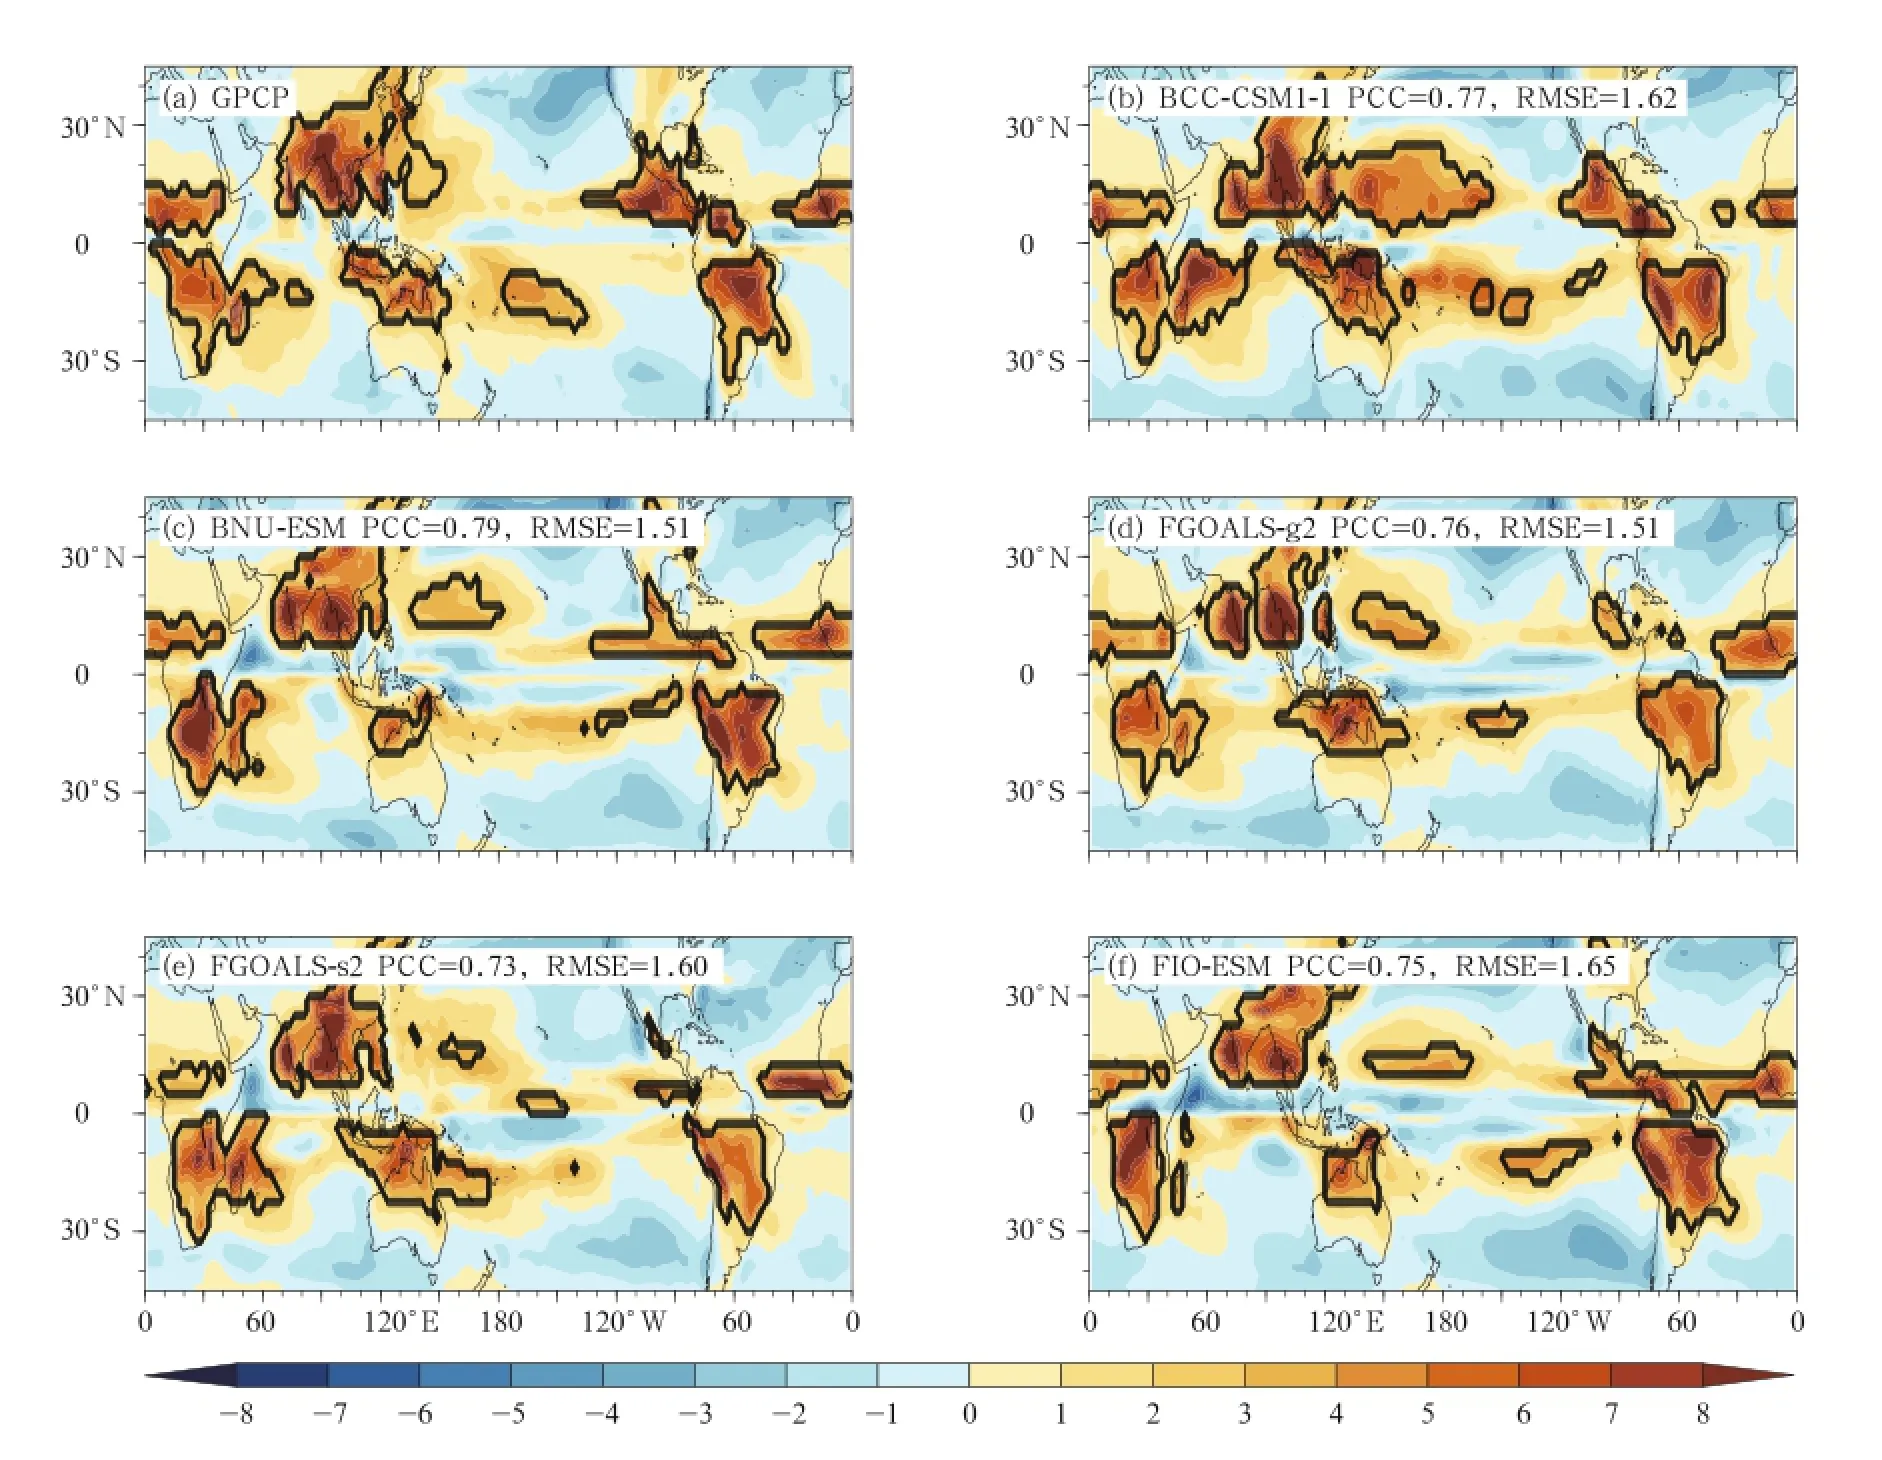
Fig.8.Observed and simulated annual ranges of precipitation(shaded;mm day-1)and global monsoon domain (contour)for(a)GPCP,(b)BCC-CSM1-1,(c)BUN-ESM,(d)FGOALS-g2,(e)FGOALS-s2,and(f)FIO-ESM.The monsoon domain is delineated by the monsoon precipitation index,i.e.,precipitation annual range normalized by the annual mean precipitation.The monsoon domains are the areas where annual range exceeding 300 mm and monsoon precipitation index exceeding 0.5(Wang and Ding,2008).
The climatology of GPI during July-October of 1986-2005 is shown in Fig.9.The TC genesis positions are mainly distributed between 5°and 20°N over WNP.In the ERA-Interim reanalysis(Fig.9a), the spatial structure of GPI reasonably resembles the climatology of TCs distribution.All models can well reproduce the high values of GPI between 5°and 20°N over WNP,while most models overestimate the magnitude of GPI except for BCC-CSM1-1(Fig. 9d).Note that both FGOALS-g2 and FGOALS-s2 overestimate the GPI value to the south of Japan. The PCCs between models and ERA-Interim are 0.82 (BCC-CSM1-1),0.90(BNU-ESM),0.70(FGOALS-g2),0.75(FGOALS-s2),and 0.82(FIO-ESM),respectively.The evaluation suggests that while the five Chinese models can reasonably reproduce the spatial pattern of tropical cyclone genesis,weaknesses are evident in the simulation of GPI magnitude.This provides a useful reference for the future development of high resolution models based on these models.
4.7 Asian-Austrian monsoon
4.7.1 Mean precipitation and 850-hPa wind
The precipitation and wind are important indicators of the monsoon.The Asian-Australian monsoon is a rigorous test for climate models(Zhou et al.,2009a,b). To compare and evaluate the performances of the five Chinese Climate/Earth System Models on Asian-Australian monsoon(A-ASM;20°S-50°N,40°-160°E),we focus on the climatology of June-September precipitation and 850-hPa wind during 1986-2005.The data are derived from the historical runs of CMIP5(Taylor et al.,2012).
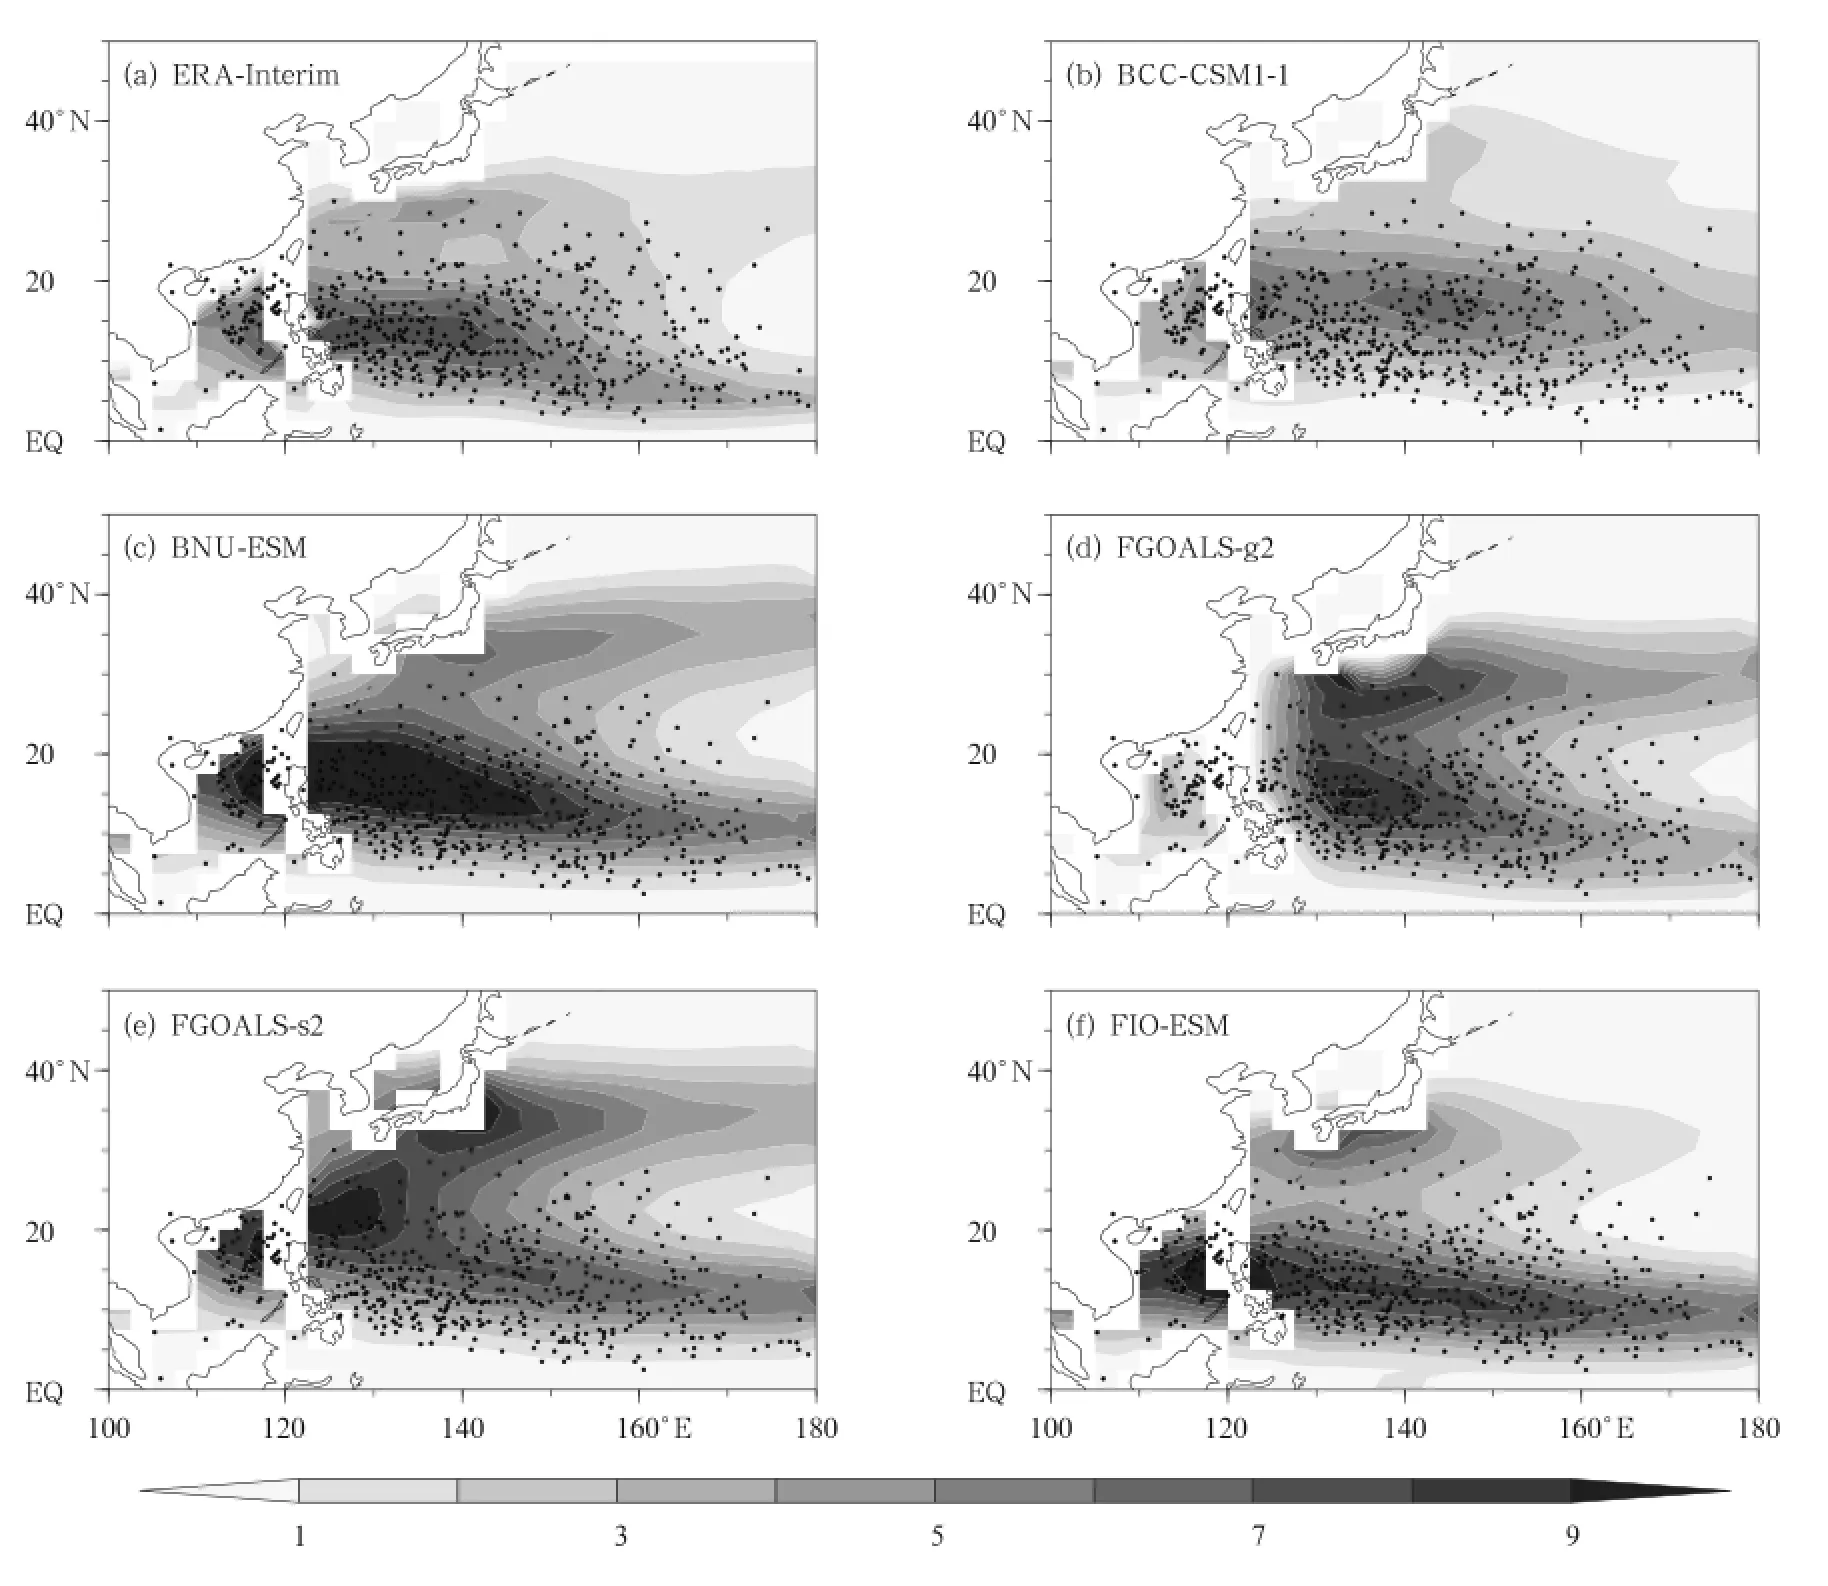
Fig.9.Climatology of tropical cyclone genesis potential index from(a)ERA-Interim,(b)FGOALS-g2,(c)FGOALS-s2, (d)BCC-CSM1-1,(e)BNU-ESM,and(f)FIO-ESM.The black dots denote individual genesis events from 1986 to 2005.
The precipitation products derived from observations such as GPCP and CMAP used in this study have similar climatological patterns with a PCC of 0.93(Fig.10a).Compared with GPCP,the five models can well capture the large-scale monsoon rainfall, with PCCs larger than 0.7(Figs.10b-f).BNU-ESM has the highest skill of 0.83,which is close to the best CMIP5 model analyzed by Sperber et al.(2013). However,model biases are also prominent(Figs.10hl),larger than the uncertainty between the GPCP and CMAP(Fig.10g).The rainfall at the south slope of Himalayas is deficit in all the five models,which is less evident in FGOALS-s2.Except FIO-ESM,the other four models show weak rainfall from southern China to Japan where Meiyu/Baiu/Changma front system is located.The five models show consistent biases of deficit rainfall in tropical eastern Indian Ocean near the Sumatra,accompanied by the redundant rainfall over the Arabian Sea.The rainfall biases over the WNP have large uncertainty,with negative sign in FGOALS-g2 and FIO-ESM and positive sign in BCCCSM1-1,BNU-ESM,and FGOALS-s2.The similarity of climatological pattern of precipitation and corresponding biases in BNU-ESM and FIO-ESM may be dominated by the similar atmospheric component used in models though they have different oceanic components(Qiao et al.,2013;Wu et al.,2013).
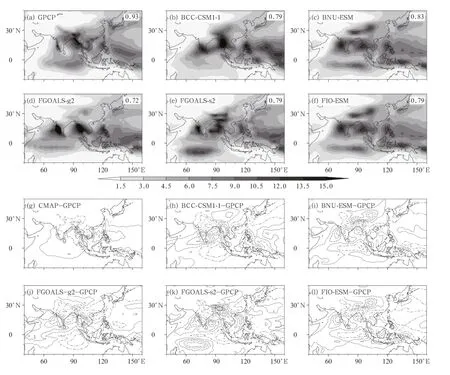
Fig.10.Climatology of June-September precipitation(mm day-1)over the Asian-Australian summer monsoon region during 1986-2005 for(a)GPCP and(b-f)historical run of different models,and bias pattern relative to GPCP for (g)CMAP and(h-l)historical run of different models.Contours in(g-l)range from-7 to 7 by 2(without zero line). Number on the top right of(a-f)is the PCC of CMAP and climate models relative to GPCP.
The 850-hPa wind reflects the monsoon circulation and water vapor transport at the low level.The differences between NCEP2 and JRA-25 show high consistence in reanalysis datasets,with PCC of 0.98 (Fig.11a).In contrast to the climatological pattern of rainfall,wind pattern has higher skill(Figs.11bf).The wind skills of all the five models are close to other CMIP5 models(Sperber et al.,2013).The cross-equatorial flow over the western Indian Ocean, westerly flow from Arabian Sea to the South China Sea,monsoon trough over the Bay of Bengal,southerly wind over East Asia are all reproduced except for some biases.FGOALS-g2 has an evidently weak monsoon trough over the Bay of Bengal,with strong easterlies over the equatorial eastern Indian Ocean(Fig.11j). Except BCC-CSM1-1,the other four models tend to produce a southerly bias over China.Corresponding to the deficit rainfall,FGOALS-g2 and FIO-ESM show an anticyclone bias over the WNP(Figs.11i and 11l). The similarity of wind bias in BNU-ESM and FIOESM may be caused by the similar version of atmospheric component as shown in the rainfall pattern.
The skills on A-ASM of the five models are shown for 850-hPa wind versus precipitation,relative to NCEP2 and GPCP(Fig.12).In the same picture, we show the“skill”of JRA-25 and CMAP and the multi-model ensemble in CMIP3 and CMIP5.BNUESM performs best among the five models,whereas the skill of FOGOAL-g2 is the lowest due mainly to
the precipitation bias. The skills of FGOALS-s2, BCC-CSM1-1,and FIO-ESM are close to each other. From CMIP3 to CMIP5,the ensemble skills of climatology of the A-ASM have improved and are closer to the reanalysis/observation,which is mainly contributed by the improvement of precipitation.

Fig.11.Climatology of June-September 850 hPa wind(m s-1)over the Asian-Australian summer monsoon region during 1986-2005 for(a)NCEP2 and(b-f)historical run of different models,and bias pattern relative to NCEP2 for (g)JRA-25 and(h-l)historical run of different models.Number on the top right of(a-f)is the PCC of JRA-25 and climate models relative to NCEP2.
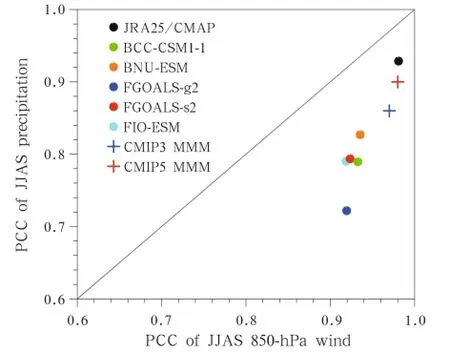
Fig.12.PCC of JJAS precipitation against 850-hPa wind.

Fig.13.Interannual JJAS precipitation anomalies(mm day-1)from linear regression with JJAS Nino3.4 SST anomalies:(a)GPCP rainfall data versus HadISST,(b)BCC-CSM1-1,(c)BNU-ESM,(d)FGOALS-g2,(e)FGOALS-s2,and (f)FIO-ESM.The number on the right top of(b-f)denotes the model pattern correlation with GPCP for the interannual JJAS precipitation anomalies.The GPCP rainfall data and the HadISST are for 1979-2006.The model data are for 1961-1999.
The spatial pattern of the ENSO-forced rainfall anomalies obtained from linear regression of JJAS(June-July-August-September)rainfall anomalies onto JJAS Nino3.4 SST anomalies is shown in Fig. 13.The GPCP rainfall data show the largest rainfall decrease adjacent to the western Ghats and near the foothills of the Himalayas,and a secondary rainfall deficit over central India for El Ni˜no conditions.Over northeastern India and near the Burmese coast,abovenormal rainfall anomalies prevail in the GPCP observations.The BNU-ESM and FIO-ESM simulations exhibit the deficit of rainfall adjacent to the western Ghats and over India,and enhanced rainfall near Burma(Figs.13c and 13f),but the FIO-ESM simulation overestimates the observed deficit of rainfall.However,the BCC-CSM1-1,FGOALS-g2,and FGOALS-s2 simulations have enhanced rainfall over the Arabian Sea,with the FGOALS-s2 simulation displaying additionally strong rainfall over the Bay of Bengal.As discussed in Sperber et al.(2013),there are many critical factors influencing a realistic ENSO-monsoon teleconnection,including the model’s ability to capture the mean monsoon rainfall distribution, the ENSO-related SST and diabatic heating anomalies along the equatorial Pacific,the correct simulation of regional SST anomalies over the tropical Indian Ocean and west Pacific,as well as indirect influences from the June-July and August-September Indian monsoon preceding boreal winter ENSO development.
The East Asian summer monsoon(EASM)is an important component of the A-ASM.The distinctive topography and orography of East Asia produce unique features in the EASM.While the South Asian or Indian summer monsoon is purely a tropical monsoon system,the EASM is composed of both tropical and subtropical systems(Zhou et al.,2009c).There are many indices for measuring the strength of the EASM(Wang et al.,2008),and we adopt the negative zonal wind shear index of Wang and Fan(1999)in this study:

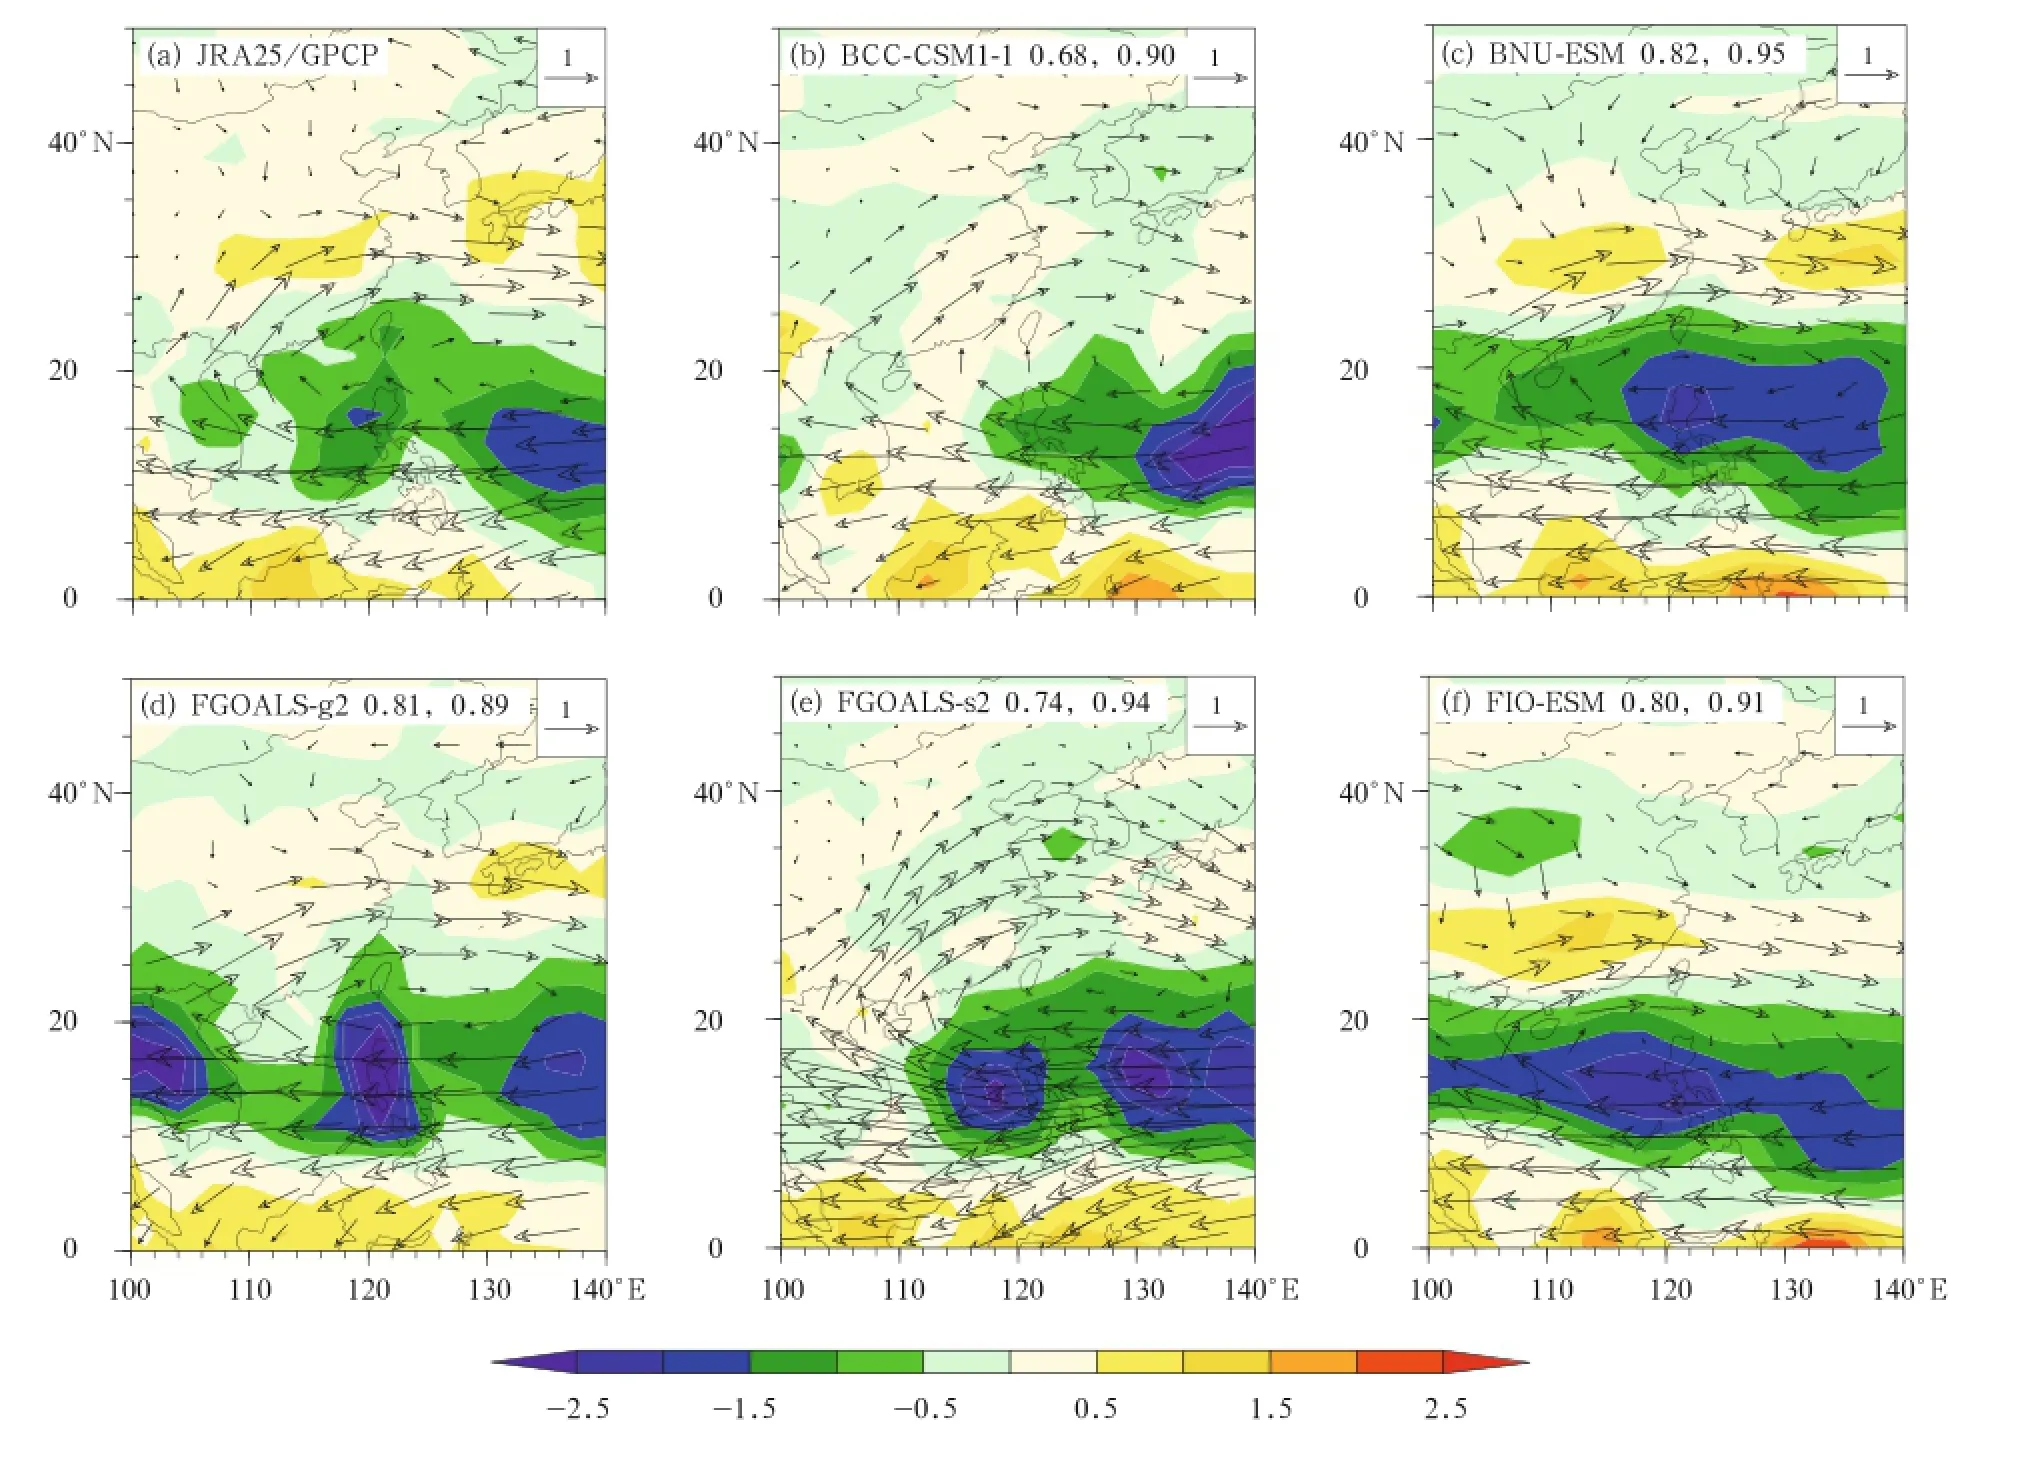
Fig.14.Interannual East Asian summer monsoon JJA 850-hPa wind anomalies and precipitation anomalies from linear regression with the revised JJA Wang and Fan(1999)850-hPa zonal wind index for(a)JRA-25/GPCP,(b)BCC-CSM1-1,(c)BNU-ESM,(d)FGOALS-g2,(e)FGOALS-s2,and(f)FIO-ESM.The numbers on the middle top of(b-f)are the model pattern correlations with JRA-25 and GPCP over the region 0°-50°N,100°-140°E.The units for the 850-hPa wind anomalies and precipitation anomalies are m s-1and mm day-1,respectively.The JRA-25 reanalysis and the GPCP rainfall data are for 1979-2006.The model data are for 1961-1999.
TheinterannualEASM JJA 850-hPawind anomalies and precipitation anomalies from linear regression with the WFN for JRA-25 reanalysis and GPCP rainfall data are shown in Fig.14a.The pattern is characterized by enhanced precipitation along the East Asian subtropical front associated with interannual variations of the Meiyu/Baiu/Changma rainband,and deficit rainfall over the western Pacific.The pattern correlations of these anomalies with those derived from the CMAP rainfall data and the NCEP2 reanalysis are 0.94 and 0.99,respectively(figure omitted),indicating that these features are robust characteristics of EASM variability.All of the five Chinese models reasonably represent the wind anomalies and the deficit rainfall anomalies adjacent to the west coast of the Philippines.However,the models show poor performance in representing the rainfall maxima that extends from central China to Southwest Japan except for the BNU-ESM model.The BNU-ESM model also has the largest rainfall pattern correlation of the models analyzed,with a reasonable representation of the rainfall minima adjacent to the west coast of the Philippines,and the maxima over Southeast China and Southwest Japan(Fig.14f).Compared to the atmospheric model analysis(Song and Zhou,2013), the deficient rainfall anomalies over the western Pacific are considerably improved,indicative of the role of air-sea interaction.However,the rainfall maxima from central China to Japan is almost missing in most atmospheric and coupled models,suggesting that the interannual variation of Meiyu/Baiu/Changma is still a challenge for current models.
4.8 20th-century historical climate simulation and RCP projection
The time evolution of global mean surface air tem-
perature(SAT)simulated by the five Chinese models is compared to other CMIP5 models in Fig.15a.Except for FGOALS-s2,all Chinese models show comparable increasing trend of SAT to other CMIP5 models during the historical period(1861-2005).The surface warming trend in the historical period is about 0.68℃(145 yr)-1in the multi-model ensemble mean(MME) of 35 CMIP5 models.However,while the result of FGOALS-g2 is comparable to the MME with a trend of 0.63℃ (145 yr)-1,all other Chinese models show larger warming trend than the MME.The stronger increasing trend of SAT in FGOALS-s2,which is 1.58℃(145 yr)-1,is related to too strong water vapor feedback and sea-ice albedo feedback(Zhou et al.,2013) and high climate sensitivity(Chen et al.,2014).
Under RCP4.5 scenario,BNU-ESM and FIOESM show the largest(1.94℃(95 yr)-1)and smallest (0.88℃ (95 yr)-1)warming amplitude during 2005-2099,respectively,while the result of BCC-CSM1-1 (1.44℃ (95 yr)-1)is close to the MME(1.75℃ (95 yr)-1).The SAT in FGOALS-s2 begins to decline around the year 2070,in opposite to other models and the reason has been investigated in He et al.(2014).
Under RCP8.5 scenario(Fig.15b),the MME shows a larger warming trend than RCP4.5 scenario, with the magnitude of 4.09℃(95 yr)-1.The warming trends in FGOALS-s2(5.13℃(95 yr)-1)and BNUESM(4.66℃ (95 yr)-1)are larger than the MME, while FGOALS-g2(3.21℃ (95 yr)-1),BCC-CSM1-1 (3.73℃(95 yr)-1),and FIO-ESM(3.90℃(95 yr)-1) underestimate the warming trend as the MME.The different warming trends in different models are closely related to their climate sensitivities(see Section 3.9). As will be shown in Fig.17,the climate sensitivities
in FGOALS-s2 and BNU-ESM are the highest among Chinese models.
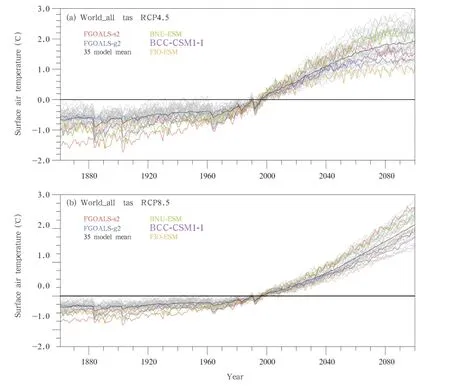
Fig.15.Time series of surface air temperature(℃)averaged over global domain for(a)RCP4.5 and(b)RCP8.5 scenarios.The reference period is 1986-2005 in the historical simulation.Gray lines show all the model simulations and black line show the multi-model ensemble mean results.
The linear trends of SAT of 5 Chinese models during 1950-2005 are displayed in Fig.16.The model results are compared to the observational data of GISTEMP(Hansen et al.,2010).In the GISTEMP,the strongest trends appear over the high-latitude continent(Fig.16a).This feature is well captured by all the Chinese models.However,the observed cooling trends over North Pacific and North Atlantic are still difficult for climate models.The North Pacific cooling is partly reproduced in BCC-CSM1-1,while the North Atlantic cooling is evident in BNU-ESM,FGOALS-g2,and FIO-ESM.During 1950-2005,the global mean SAT trend is 0.55℃(56 yr)-1in GISTEMP,this trend is well captured by FGOALS-g2 which is 0.72℃(56 yr)-1.FGOALS-s2 has the largest trend(1.28℃(56 yr)-1),while other three models show similar trends, which are 1.08,1.01,and 0.96℃(56 yr)-1for BCCCSM1-1,BNU-ESM,and FIO-ESM,respectively.
4.9 Climate sensitivity to greenhouse gasses
Climate sensitivity is an important aspect of Climate/Earth System Models.It is the main source of uncertainty for future climate projection(Meehl et al., 2007b).The climate sensitivity of a coupled model is closely related to its ability in reproducing the past changes of global climate driven by both natural and anthropogenic external forcing agents(Guo and Zhou, 2013). The climate sensitivity of the five Chinese models is evaluated using the benchmark experiment abrupt 4×CO2in CMIP5 based on Gregory-style regression method(Gregory et al.,2004;Taylor et al., 2012).First we show the 150-yr evolution of globally averaged SAT under the forcing of quadrupled CO2relative to pre-industrial period.The change of SAT is relative to the piControl experiment.
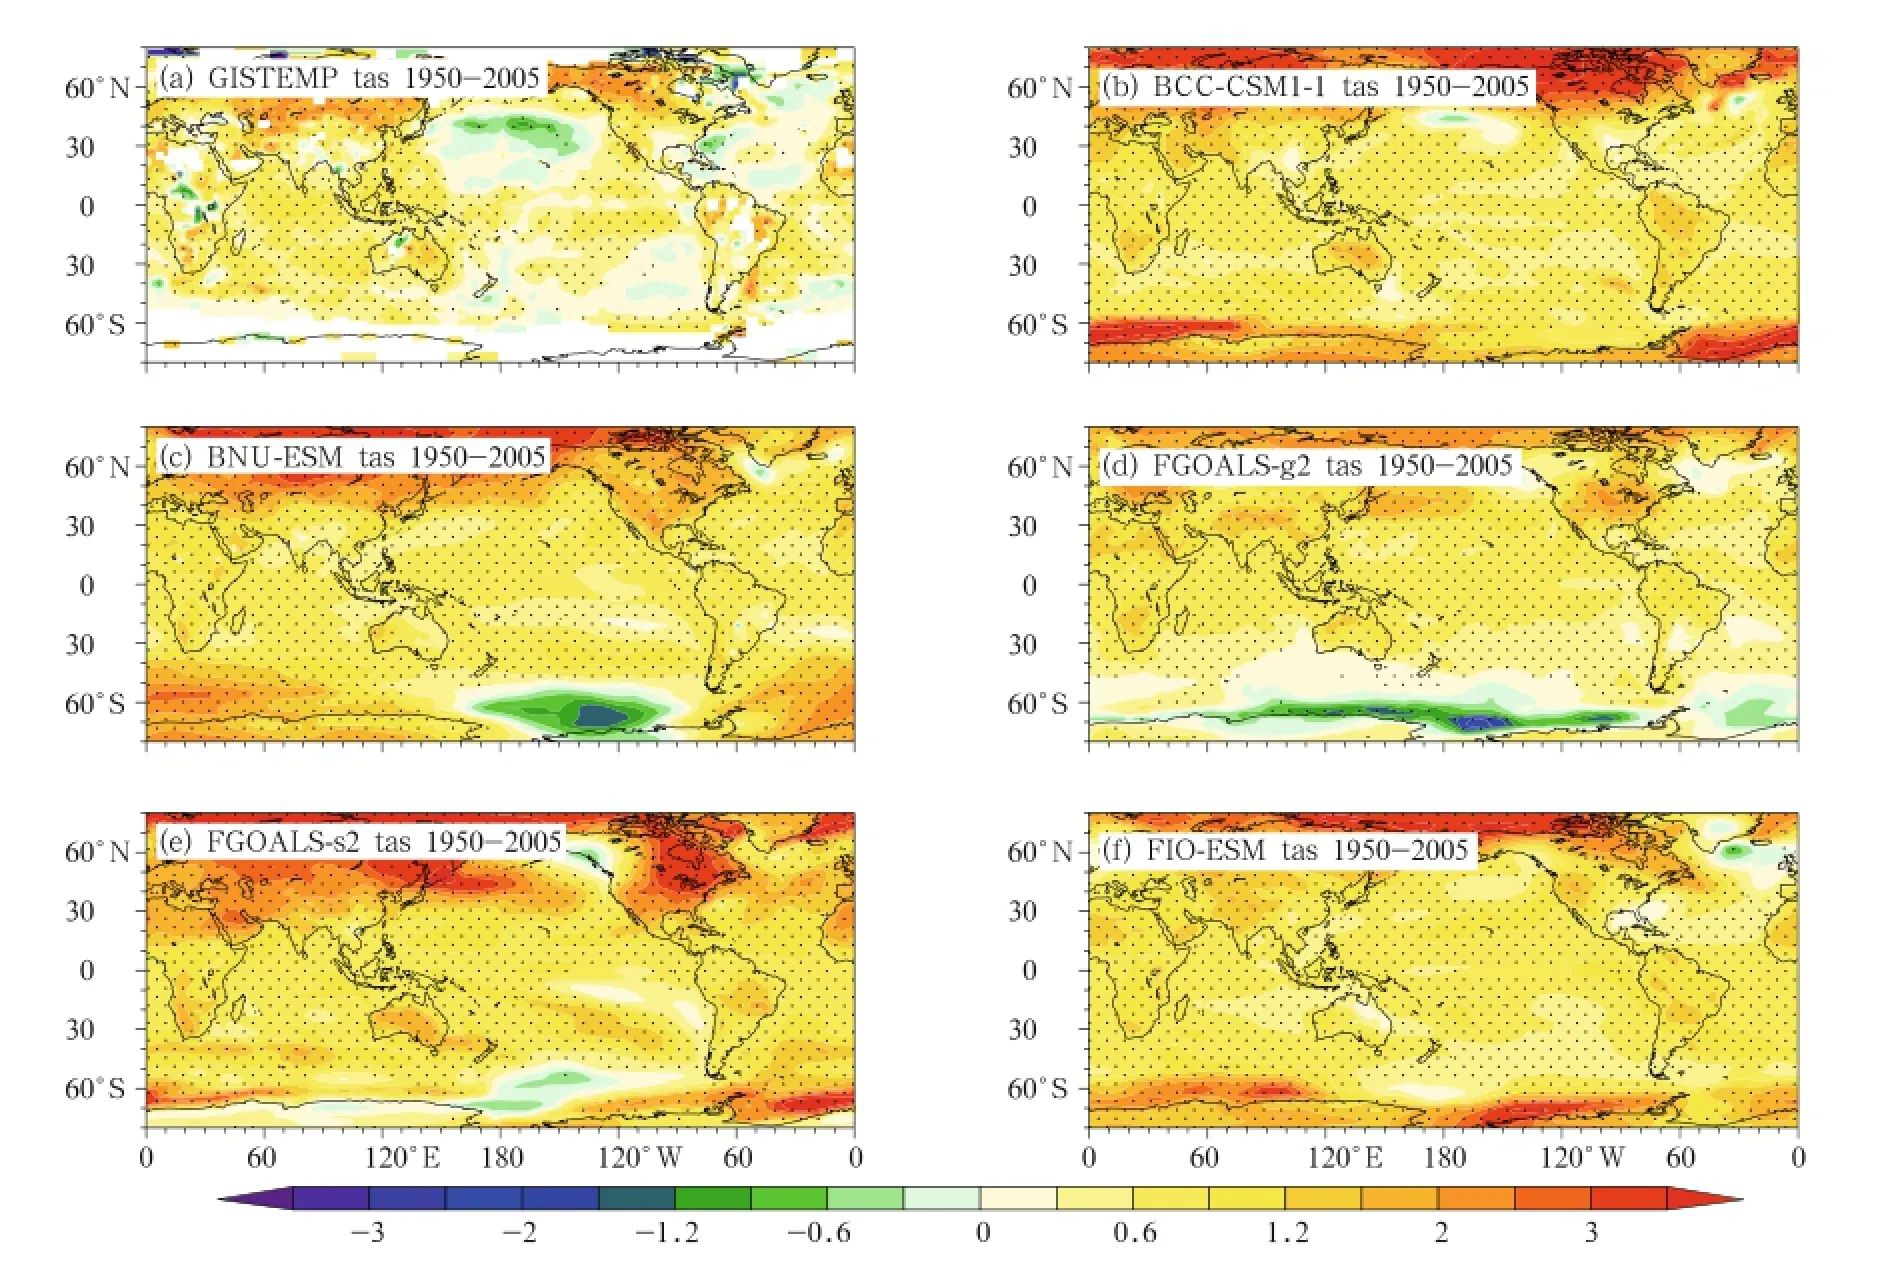
Fig.16.The linear trends of surface air temperature(℃ (56 yr)-1)during 1950-2005 in(a)GISTEMP,(b)BCCCSM1-1,(c)BNU-ESM,(d)FGOALS-g2,(e)FGOALS-s2,and(f)FIO-ESM.Black dots denote where the trends are statistically significant at the 5%level.
Because the FIO has not submitted its abrupt
4×CO2experiment to the CMIP5 dataset archives up to now,only the rest four Chinese models are shown together with other 14 CMIP5 models(Fig.17a).A prominent feature is that SAT increases dramatically during the first 10-20 years,especially in BNU-ESM and FGOALS-s2.In contrast,the evolutions of SAT in BCC-CSM1-1 and FGOALS-g2 are close to the MME. In general,the four Chinese models are within the range of SAT of the 18 models.
Based on a detailed analysis of climate sensitivity for FGOALS-g2 and FGOALS-s2 by Chen et al. (2014),climate sensitivity that estimated from Gregory-style method may be affected by the response during the first 10-20 years.Compared with BCCCSM1-1 and FGOALS-g2,BNU-ESM,and FGOALS-s2 have similar trend of SAT response during 30-150 yr.However,because of the rapid increase of SAT during the first 20 years(Fig.17a),the estimated equilibrium temperature in FGOALS-s2 is 3 K higher than BCC-CSM1-1(Fig.17b).The rapid increase of SAT in FGOALS-s2 is attributed to the strongly positive water vapor and sea-ice albedo feedback(Chen et al.,2014).The high climate sensitivity of FGOALS-s2 causes the warming trend larger than other models in historical and RCP4.5 experiments(He et al.,2014). A preliminary diagnosis shows that the excessive water vapor cloud at the North Pole may be responsible for the extreme warming through water vapor-cloudradiation positive feedback(He et al.,2014).
5.Summary and concluding remarks
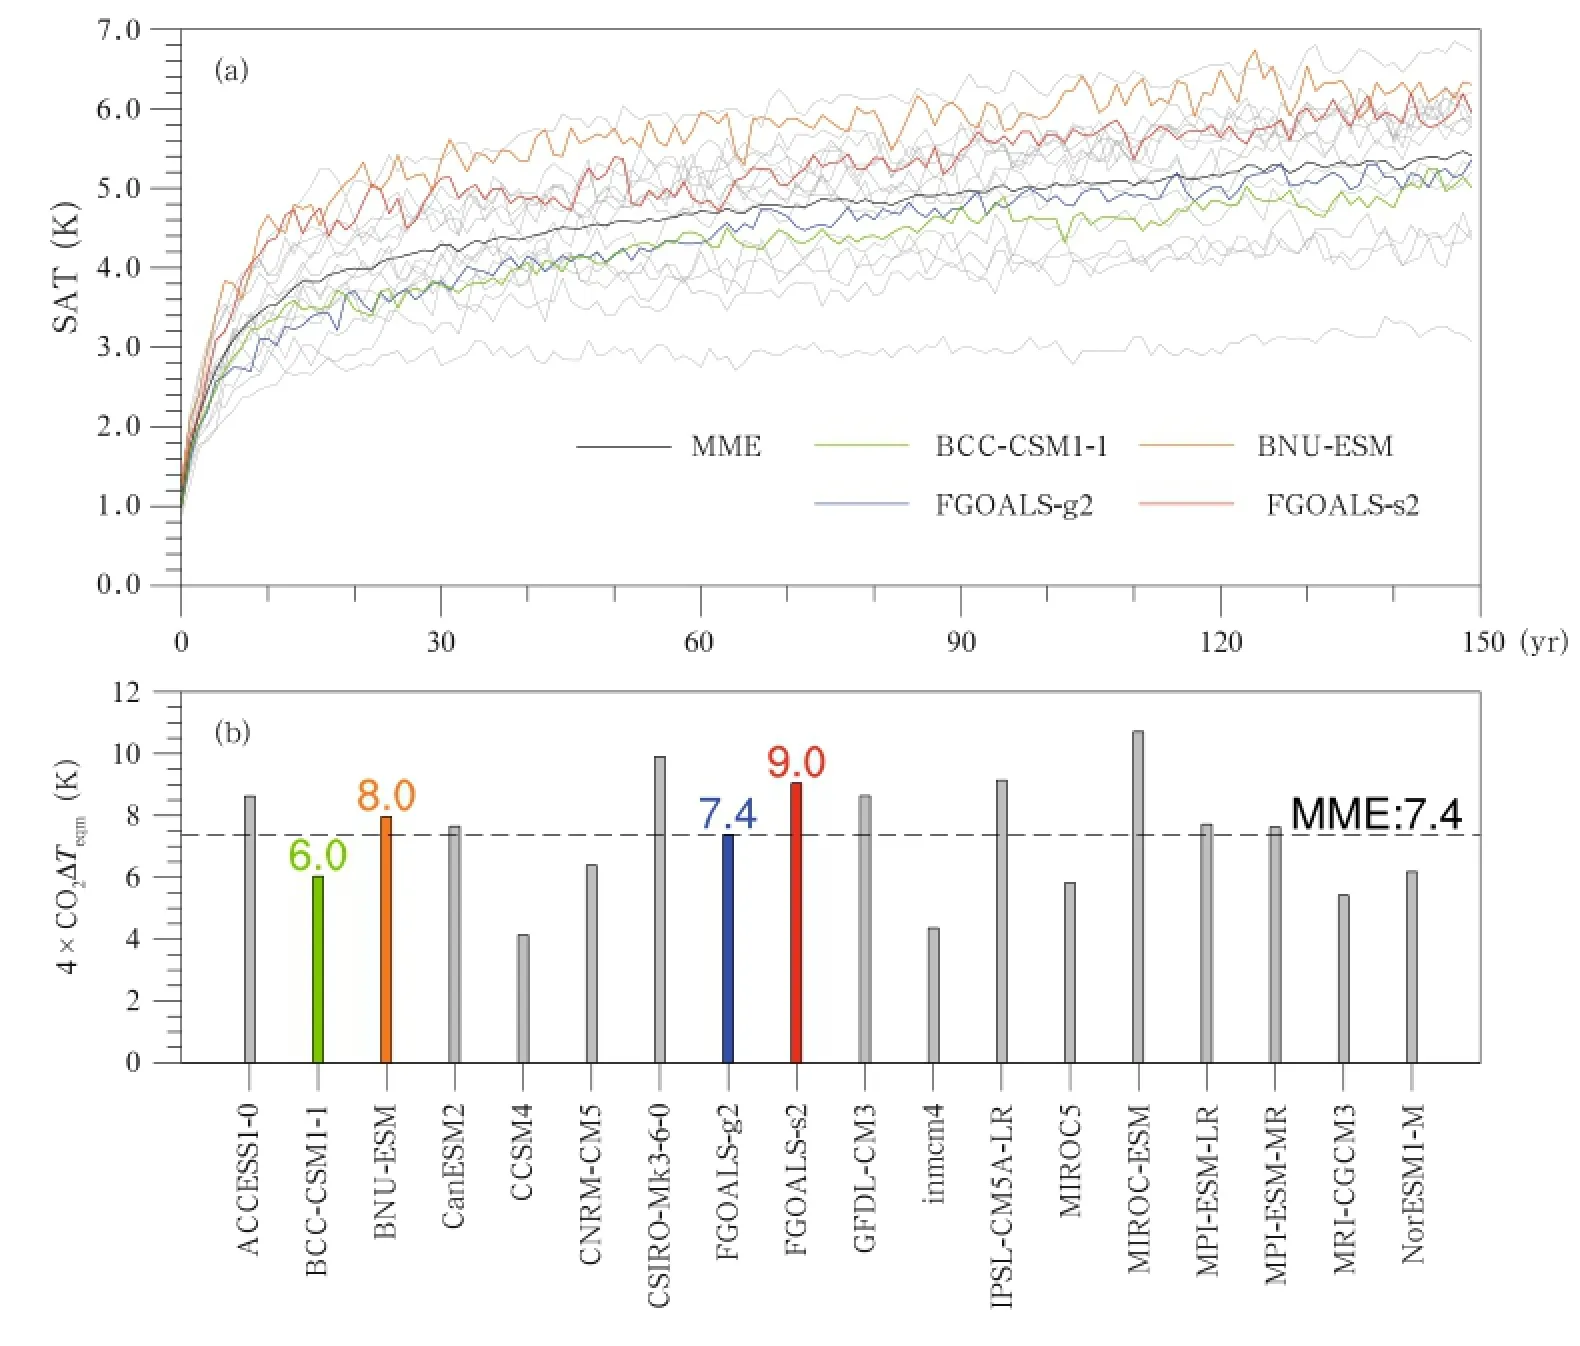
Fig.17.(a)Evolution of globally averaged SAT(K)of abrupt 4×CO2relative to piControl for 4 Chinese models (colored thick line),other 14 CMIP5 models(gray thin line),and multi-model ensemble(black thick line).(b)Climate sensitivity estimated by Gregory-style method represented by the equilibrium ΔT under the forcing of quadrupled CO2.
The contribution of China to the ongoing CMIP5 project includes five ESM/CSM,which are called BCC-CSM1-1,BNU-ESM,FGOALS-g2,FGOALS-s2, and FIO-ESM,respectively.After providing an over-
view of Chinese models that participated in CMIP5, the performances of these five Chinese models are evaluated based on the historical,RCP projection,abrupt 4×CO2,and piControl run of CMIP5.The assessment focuses on the mean state of SST and its seasonal cycle,typical climate variability across intra-seasonal,interannual and interdecadal timescales(MJO,ENSO, and PDO),global monsoon,tropical cyclone,Asian-Australian monsoon in boreal summer,20th-century global warming,future climate change projection,and climate sensitivity.A summary of performance for the five Chinese Climate/Earth System Models is listed in Table 4.Major conclusions are summarized as follows.
1)Great progress has been made in the development of climate models from CMIP3 to CMIP5 in China.Five coupled Climate/Earth System Models have participated in CMIP5.In addition to the traditional modeling center such as LASG/IAP,new climate modeling centers are emerging in China.Interagency collaboration has promoted the development and improvement of Chinese models.In comparison to other CMIP5 models,the resolutions of Chinese models are generally lower,especially for the atmospheric components.
2)All the five Chinese models show reasonable performances in simulating SST mean state and seasonal cycle.The annual cycle in the eastern Pacific is weaker in FGOALS-g2,BCC-CSM1-1,and FIO-ESM, while that in FGOALS-s2 and BNU-ESM are similar to observation.
3)The main MJO characteristics including the intensity,significant period,and propagation are basically reproduced.The MJO variance is overestimated (underestimated)by BCC-CSM1-1(BNU-ESM and FGOALS-g2).The MJO westward propagation power in the models is too strong.The significant period in BCC-CSM1-1 and FGOALS-s2 is shorter than that in the observation.
4)All the five Chinese models show reasonable performances in simulating the ENSO-related SSTA, however,those in the equatorial central-eastern Pacific simulated by BNU-ESM,FGOALS-g2,and FGOALS-s2 extend westward excessively;ENSO amplitudes in BCC-CSM1-1,FGOALS-g2,and FGOALS-s2 are close to that in the observation,while those in BNUESM and FIO-ESM are much stronger;El Nin˜o events simulated by FGOALS-s2 and BCC-CSM1-1 do not show strong phase locking to the seasonal cycle.
5)All the five Chinese models can well capture the main characteristics of PDO-related SSTA pattern, with the highest PCC to observation in FGOALS-s2 and FIO-ESM.But the simulated dominant time period of PDO is model-dependent.
6)The climatology and domain of global monsoon precipitation are well reproduced by five Chinese models.The monsoon mode over WNP in BCCCSM1-1(FGOALS-g2 and FGOALS-s2)is stronger (weaker)than the observation.All models simulate stronger spring-fall asymmetric mode over the tropical Pacific compared with the observation.The WNP monsoon and North American monsoon domains in all models are smaller than the observation,except BCCCSM1-1.
7)The climatology of GPI distribution is well simulated in all models,while most models overestimate the magnitude.The overestimation of GPI to the south of Japan is evident in FGOALS-g2 and FGOALS-s2.
8)The climatology of large-scale Asian monsoon precipitation and 850-hPa wind can be well captured by all the five models.Using PCC as a metric,BNUESM has the highest skill whereas the performance of FGOALS-g2 needs to be improved.The rainfall skill,of which the spread is larger than that of the wind,is the major limitation to individual model performance compared with the reanalysis and CMIP ensemble mean.
9)The time evolution of SAT during the historical period(1861-2005)is well simulated by Chinese models,except for the strong warming trend in FGOALS-s2.Compared to CMIP5 MME,the warming trend in the historical period is overestimated by most Chinese models.The warming trend in the MME during 2005-2099 under RCP4.5 scenario is well captured by BCC-CSM1-1.Under RCP8.5,all Chinese models are comparable to CMIP5 models.FGOALS-s2 and BNU-ESM(FGOALS-s2,BCC-CSM1-1,and
FIO-ESM)overestimate(underestimate)the warming trend compared to the MME.The different warming trends in different models are closely related to their climate sensitivities.

10)The overall warming pattern during 1950-2005 is well captured by five Chinese models. All models have the polar amplification phenomenon, which is most evident in FGOALS-s2 but weak in FGOALS-g2.The observed cooling trends over North Pacific and North Atlantic are not evident in the simulation.The linear trends of SAT during 1950-2005 are overestimated in all Chinese models.
11)Among 18 CMIP5 models,climate sensitivities of FGOALS-g2 and BCC-CSM1-1(BNU-ESM and FGOALS-s2)are equivalent or lower(higher)than that of the MME based on the Gregory-style method. The high sensitivities of BNU-ESM and FGOALS-s2 are caused by the dramatic increase of temperature under CO2forcing during the first two decades.
Acknowledgments.We acknowledge Dr.Xiao Xia and Mr.Chen Kangjun for helping us to collect statistical data of CMIP5 models from the ESG-node.
Adler,R.F.,G.J.Huffman,A.Chang,et al.,2003:The version-2 global precipitation climatology project 11(GPCP)monthly precipitation analysis(1979-present).J.Hydrometeorology,4,1147-1167.
Bao,Q.,P.F.Lin,T.J.Zhou,et al.,2013:The flexible global Ocean-Atmosphere-Land system model, spectral version 2:FGOALS-s2.Adv.Atmos.Sci., 30,561-576,doi:10.1007/s00376-012-2113-9.
Bellenger,H,E.Guilyardi,J.Leloup,et al.,2013: ENSO representation in climate models: From CMIP3 to CMIP5.Climate Dyn.,42,7-8,doi: 10.1007/s00382-013-1783-z.
Bjerknes,J.,1969:Atmospheric teleconnections from the equatorial Pacific.Mon.Wea.Rev.,97,163-172.
Chen,X.L.,T.J.Zhou,and Z.Guo,2014:Climate sensitivities of two versions of FGOALS model to idealized radiative forcing.Sci.China Earth Sci., 57,1363-1373,doi:10.1007/s11430-013-4692-4.
Dee,D.P.,S.M.Uppala,A.J.Simmons,et al.,2011:The ERA-Interim reanalysis:Configuration and performance of the data assimilation system.Quart.J. Roy.Meteor.Soc.,137,553-597.
Deser,C.,M.A.Alexander,S.-P.Xie,et al.,2010:Sea surface temperature variability:Patterns and mechanisms.An.Rev.Mar.Sci.,2,115-143.
Dong Lu and Zhou Tianjun,2014:Contributions of natural and anthropogenic forcings to the twentiethcentury Pacific sea surface temperature variability simulated by a climate system model. Acta Oceanologica Sinica,36,48-60.(in Chinese)
Emanuel,K.,1988:The maximum intensity of hurricanes.J.Atmos.Sci.,45,1143-1155.
Gregory,J.M.,W.J.Ingram,M.A.Palmer,et al., 2004:A new method for diagnosing radiative forcing and climate sensitivity.Geophys.Res.Lett.,31, L03205,doi:10.1029/2003GL018747.
Guo,Z.,and T.J.Zhou,2013:Why does FGOALS-gl reproduce a weak Medieval Warm Period but a reasonable Little Ice Age and 20th century warming?Adv. Atmos.Sci.,30,1758-1770,doi:10.1007/s00376-013-2227-8.
Hansen,J.,R.Ruedy,M.Sato,et al.,2010:Global surface temperature change.Rev.Geophys.,48, RG4004,doi:10.1029/2010RG000345.
He,B.,Y.Liu,T.Zhou,et al.,2014:A preliminary diagnosis of high climate sensitivities simulated by FGOALS-s2 in CMIP5 Historical and RCP4.5 scenarios.Flexible Global Ocean-Atmosphere-Land System Model.Zhou T.J.,Y.Q.Yu,Y.M.Liu,et al., Eds.,Springer Press,225-231.
Hoerling,M.P.,A.Kumar,and M.Zhong,1997:El Ni˜no,La Ni˜na,and the nonlinearity of their teleconnections.J.Climate,10,1769-1786.
Jin,F.F.,1997:An equatorial ocean recharge paradigm for ENSO.Part I:Conceptual model.J.Atmos. Sci.,54,811-829.
Kanamitsu,M.,W.Ebisuzaki,J.Woollen,et al.,2002: NCEP-DOEAMIP-IIReanalysis(R-2). Bull. Amer.Meteor.Soc.,83,1631-1643.
Kitoh,A.,H.Endo,K.K.Kumar,et al.,2013:Monsoons in a changing world:A regional perspective in a global context.J.Geophys.Res.Atmos.,118, doi:10.1002/jgrd.50258.
Li,L.,P.Lin,Y.Yu,et al.,2013:The flexible global ocean-atmosphere-land system model:Grid-point version 2:FGOALS-g2.Adv.Atmos.Sci.,30, 543-560,doi:10.1007/s00376-012-2140-6.
Lin,P.F.,Y.Q.Yu,and H.L.Liu,2013:Oceanic climatology in the coupled model FGOALS-g2:Improvements and biases. Adv. Atmos. Sci.,30, 819-840.
Lin,R.,T.Zhou,and Y.Qian,2013:Evaluation of global monsoon precipitation changes based on five reanalysis datasets.J.Climate,27,1271-1289,doi: 10.1175/JCLI-D-13-00215.1.
Lin Renping,Zhou Tianjun,Xue Feng,et al.,2012: The global monsoon variability revealed by NCEP/NCAR reanalysis data.Chinese J.Atmos. Sci.,36,1027-1040.(in Chinese)
Mantua,N.,and S.Hare,2002:The Pacific decadal oscillation.J.Oceanogr.,58,35-44.
Meehl,G.A.,G.J.Boer,C.Covey,et al.,1997:Intercomparison makes for a better climate model.Eos. Trans.Amer.Geophys.Union,78,445-451.
—-,G.J.Boer,C.Covey,et al.,2000:The Coupled Model Intercomparison Project(CMIP).Bull. Amer.Meteor.Soc.,81,313-318.
—-,C.Covey,B.McAvaney,et al.,2005:Overview of the Coupled Model Intercomparison Project.Bull. Amer.Meteor.Soc.,86,89-93.
—-,—-,T.Delworth,et al.,2007a:The WCRP CMIP3 multimodel dataset:A new era in climate change research.Bull.Amer.Meteor.Soc.,88,1383-1394, doi:10.1175/BAMS-88-9-1383.
—-,T.F.Stocker,W.D.Collins,et al.,2007b:Global Climate Projections.Climate Change 2007:The Physical Science Basis. Contribution of Working Group I to the Fourth Assessment Report of the Intergovernmental Panel on Climate Changes. Solomon,S.,et al.,Eds.,Cambridge University Press,747-845.
Murakami,H.,B.Wang,and A.Kitoh,2011:Future change of western North Pacific typhoons:Projections by a 20-km-mesh global atmospheric model. J.Climate,24,1154-1169.
Onogi,K.,J.Tsutsui,H.Koide,et al.,2007:The JRA-25 reanalysis.J.Meteor.Soc.Japan,85,369-432.
Philander,S.G.H.,1990:El Ni˜no,La Ni˜na,and the Southern Oscillation.Academic Press,293 pp.
Qian,C.,and T.J.Zhou,2013:Multidecadal variability of North China aridity and its relationship to PDO during 1900-2010.J.Climate,27,1210-1222,doi: 10.1175/JCLI-D-13-00235.1.
Qiao,F.L.,Z.Y.Song,Y.Bao,et al.,2013:Development and evaluation of an Earth System Model with surface gravity waves.J.Geophys.Res.,118, 4514-4524,doi:10.1002/jgrc.20327.
Rasmusson,E.,and T.Carpenter,1982:Variations in tropical sea surface temperature and surface wind fields associated with the Southern Oscillation/El Ni˜no.Mon.Wea.Rev.,110,354-384.
Rayner,N.A.,D.E.Parker,E.B.Horton,et al.,2003: Global analyses of sea surface temperature,sea ice, and night marine air temperature since the late 19th century.J.Geophys.Res.,108,4407,doi: 10.1029/2002JD002670.
Song,F.F.,and T.J.Zhou,2013:Interannual variability of East Asian summer monsoon simulated by CMIP3 and CMIP5 AGCMs:Skill dependence on Indian Ocean-western Pacific anticyclone teleconnection. J.Climate,27,1679-1697,doi:10.1175/JCLI-D-13-00248.1.
Sperber,K.R.,H.Annamalai,I.-S.Kang,et al., 2013:Asian summer monsoon:An intercomparison of CMIP5 vs.CMIP3 simulations of the late 20th century.Climate Dyn.,41,2711-2744,doi: 10.1007/s00382-012-1607-6.
Suarez,M.J.,and P.S.Schopf,1988:A delayed action oscillator for ENSO.J.Atmos.Sci.,45,3283-3287.
Taylor,K.E.,R.J.Stouffer,and G.A.Meehl,2012: An overview of CMIP5 and the experiment design. Bull.Amer.Meteor.Soc.,93,485-498.
Tian Fangxing,Zhou Tianjun,and Zhang Lixia,2013: Tropical cyclone genesis potential index over the western North Pacific simulated by LASG/IAP AGCM.Acta Meteor. Sinica,27,50-62,doi: 10.1007/s13351-013-0106-y.
Trenberth,K.E.,D.P.Stepaniak,and J.M.Caron,2000: The global monsoon as seen through the divergent atmospheric circulation.J.Climate,13,3969-3993.
van Oldenborgh,G.J.,M.Collins,J.M.Arblaster,et al.,2013:Annex I:Atlas of Global and Regional Climate Projections.Climate Change 2013:The Physical Science Basis.Contribution of Working Group I to the Fifth Assessment Report of the Intergovernmental Panel on Climate Change.Stocker,T. F.,D.Qin,G.-K.Plattner,et al.,Eds.,Cambridge University Press,Cambridge,United Kingdom and New York,NY,USA,1311-1393.
Wang,B.,and Z.Fan,1999:Choice of South Asian summer monsoon indices.Bull.Amer.Meteor.Soc., 80,629-638.
—-,and Q.Ding,2008:Global monsoon:Dominant mode of annual variation in the tropics.Dyn.Atmos.Oceans,44,165-183.
—-,Z.Wu,J.Li,et al.,2008:How to measure the strength of the East Asian summer monsoon.J. Climate,21,4449-4463.
Wang Bin,Zhou Tianjun,Yu Yongqiang,et al.,2009: A view of earth system model development.Acta Meteor.Sinica,23,1-17.
Wu,B.,and T.J.Zhou,2013:Relationships between East Asian-western North Pacific monsoon and ENSO simulated by FGOALS-s2.Adv.Atmos. Sci.,30,713-725,doi:10.1007/s00376-013-2103-6.
Wu,T.,R.Yu,F.Zhang,et al.,2010:The Beijing climate center for atmospheric general circulation model(BCC-AGCM2.0.1):Description and its performance for the present-day climate.Climate Dyn., 34,123-147.
Wu Tongwen,Song Liancun,Li Weiping,et al.,2014:An overview of progress in climate system model development at the Beijing Climate Center applications for climate change studies.Acta Meteor.Sinica,28, 34-56,doi:10.1007/s13351-014-3041-7.
Wu Qizhong,Feng Jinming,Dong Wenjie,et al.,2013: Introduction of the CMIP5 experiments carried out by BNU-ESM.Adv.Climate Change Res.,9,291-294,doi:10.3969/j.issn.1673-1719.2013.04.008.
Xie,P.,and P.A.Arkin,1997:Global precipitation: A 17-year monthly analysis based on gauge observations,satellite estimates,and numerical model outputs.Bull.Amer.Meteor.Soc.,78,2539-2558.
—-,J.E.Janowiak,P.A.Arkin,et al.,2003:GPCP pentad precipitation analyses:An experimental dataset based on gauge observations and satellite estimates. J.Climate,16,2197-2214.
Yu,Y.,H.Zhi,B.Wang,et al.,2008:Coupled model simulations of climate changes in the 20th century and beyond.Adv.Atmos.Sci.,25,641-654.
—-,J.He,W.P.Zheng,et al.,2013:Annual cycle and interannual variability in the tropical Pacific as simulated by three versions of FGOALS.Adv.Atmos. Sci.,30,621-637.
Zhang Lixia,Zhou Tianjun,Wu Bo,et al.,2010:The annual modes of tropical precipitation simulated by the LASG/IAP coupled ocean-atmosphere model FGOALS-s1.1.Acta Meteor.Sinica,24,189-202.
—-,and—-,2014:An assessment of improvements in globalmonsoon precipitation simulation in FGOALS-s2.Adv.Atmos.Sci.,31,165-178,doi: 10.1007/s00376-013-2164-6.
Zhang,X.,G.Shi,H.Liu,et al.,2000:IAP Global Ocean-Atmosphere-Land System Model.Science Press,Beijing,251 pp.
Zhou,T.J.,and R.Yu,2006:Twentieth century surface air temperature over China and the globe simulated by coupled climate models.J.Climate,19,5843-5858.
—-,Y.Yu,H.Liu,et al.,2007:Progress in the development and application of climate ocean models and ocean-atmosphere coupled models in China.Adv. Atmos.Sci.,24,729-738.
—-,B.Wu,X.Wen,et al.,2008a:A fast version of LASG/IAP climate system model and its 1000-year control integration.Adv.Atmos.Sci.,25,655-672.
—-,R.C.Yu,H.M.Li,et al.,2008b:Ocean forcing to changes in global monsoon precipitation over the recent half-century.J.Climate,21,3833-3852.
—-,B.Wu,and B.Wang,2009a:How well do atmospheric general circulation models capture the leading modes of the interannual variability of the Asian-Australian monsoon?J.Climate,22,1159-1173.
—-,B.Wu,A.A.Scaife,et al.,2009b:The CLIVAR C20C Project:Which components of the Asian-Australian monsoon circulation variations are forced and reproducible?Climate Dyn.,33,1051-1068.
—-,D.Gong,J.Li,et al.,2009c:Detecting and understanding of multi-decadal variability of the East Asian summer monsoon-Recent progress and state of affairs.Meteorologische Zeitschrift,18,455-467.
—-,B.Li,W.Man,et al.,2011:A comparison of the medieval warm period,little ice age and 20th-century warming simulated by the FGOALS Climate System Model.Chinese Sci.Bull.,56,3028-3041.
—-,F.Song,and X.L.Chen,2013:Historical evolutions of global and regional surface air temperature simulated by FGOALS-s2 and FGOALS-g2:How reliable are the model results?Adv.Atmos.Sci., 30,638-657,doi:10.1007/s00376-013-2205-1.
:Zhou Tianjun,Chen Xiaolong,Dong Lu,et al.,2014:Chinese contribution to CMIP5:An overview of five Chinese models’performances.J.Meteor.Res.,28(4),481-509,
10.1007/s13351-014-4001-y.
(Received January 1,2014;in final form April 1,2014)
猜你喜欢
杂志排行
Journal of Meteorological Research的其它文章
- Track of Super Typhoon Haiyan Predicted by a Typhoon Model for the South China Sea
- Variations in Regional Mean Daily Precipitation Extremes and Related Circulation Anomalies over Central China During Boreal Summer
- The Persistent Heavy Rainfall over Southern China in June 2010: Evolution of Synoptic Systems and the Effects of the Tibetan Plateau Heating
- Overview of the Major 2012-2013 Northern Hemisphere Stratospheric Sudden Warming:Evolution and Its Association with Surface Weather
- Characteristics of Meteorological Factors over Different Landscape Types During Dust Storm Events in Cele,Xinjiang,China
- Diagnostic Study of Global Energy Cycle of the GRAPES Global Model in the Mixed Space-Time Domain
