Study of water resources for crop utilization in China from the perspective of Virtual Water
2014-11-26GELiqiangCHENGYanpeiYUEChen
GE Li-qiang, CHENG Yan-pei, YUE Chen
Institute of Hydrogeology and Environmental Geology, Chinese Academy of Geological Sciences, Shijiazhuang 050061, China.
Abstract: Based on the Virtual Water Theory, the research analyzed the spatial and temporal distribution characteristics of major crops in China. Analysis results indicate that the unit virtual water content varies with the type of crop obviously as well as the distribution region.We also found irrational water utilization in some regions, which means that the renewable water sources could not meet the water demand for crop growth. With a view solving these problems found in the research, discussions on agricultural water-saving technology,comprehensive allocation of crops, selection of rational cropping pattern, full use of green water and trade of virtual water were carried out, which may result in some theoretical basis for the sustainable utilization of agricultural water resources in China.
Keywords: Virtual water; Agricultural distribution; Cropping pattern; Sustainable utilization of water resources
The crisis of water resources may become the bottleneck for China's economic development.Agriculture is a sector requiring more water resources than any other sectors do. In China, the water for farm irrigation accounts for 63% of the total water consumption nationwide, making up 35%-40% of the national utmost possible quantity of water supply (FENG Guang-zhi, 2004). The farm irrigation results in some environmental problems including the drawdown of groundwater(LIU Chang-ming et al. 2001; XU Xue-qing et al.2005; WANG Jin-xia et al. 2007), the area of groundwater depression cone increasing from 55 000 km2in 2000 to 70 000 km2in 2008, with increasing rate of 27% (Ministry Water Resources,2001; 2009). How to secure the grain safety, water safety and ecological safety of China has become a vital topic.
It is of great significance to evaluate the utilization condition of water resources in agriculture effectively for agricultural water-saving study and for the sustainable utilization of water resources.Conventionally, agricultural irrigation water was usually a major indicator used to evaluate the consumption and utilization condition of water resources in a country or in a region. However, this method ignored the utilization of soil water in agricultural production. The virtual water contained in various products in an invisible form provides a new perspective for measuring the impact of human activities on water resource system. Basic theories of virtual water include resource flow theory, resource substitution theory and theory of comparative advantage. Based on the virtual water theories, the authors of this paper studied and analyzed the spatial and temporal distribution characteristics of major crop products in China, providing some theoretical basis for realizing the agricultural water saving, rational allocation of crop production and the sustainable utilization of water resources.
1 Crop virtual water
Falkenmark M (1995) divides water into three types: green water, blue water and grey water.“Green water” refers to the water that exists in unsaturated aquifer in soil and can be used by plants in the form of evapotranspiration, which is the commonly called soil water. “Blue water”refers to the surface water and groundwater that exist in rivers, lakes, reservoirs, pools and aquifers.Therefore, the quantity of water consumed during the growth of crops is the sum of green water consumption and blue water consumption. Additionally, during the growing process of plants,fertilizers and pesticides are required and this may result in the contamination of water quality. In order to make the water quality reach the safety standard, water is required to dilute various nutrient elements (N, P, and K) and reagents. The water resource of this type is called grey water,which is usually listed separately in the course of study (Chapagain A K et al. 2006).
In this research, we only analyze the green virtual water and blue virtual water in crops. The green virtual water refers to the rainwater resources that is stored in soil and evaporates during the process of growing of crops. The blue virtual water refers to the fresh water resources consumed mainly in the evaporating during farm irrigation.
2 Research methods and data sources
2.1 Calculation of crop virtual water
To figure out the virtual water of agricultural products, we have to know the crop water requirement for growing, which is calculated based on the crop accumulative evapotranspiration during growing process (Crop Water Requirement,CWR). Factors that influence the CWR include precipitation, air temperature, air pressure, sunshine duration, wind speeds, type of crops, soil conditions and planting time. Generally, the standard Penman Monteith Equation recommend by FAO is employed in the calculation (Richard et al. 1998), but in this paper, we carried out the calculation with CROPWAT software.
CWR includes two parts: the green water (soil water) and the blue water (irrigation water)generally. The irrigation requirement equals to the crop water requirement minus the effective precipitation. The crop green virtual water can be calculated via the ratio between effective precipitation and crop yield while the crop blue virtual water can be calculated via the ratio between irrigation requirement and crop yield. Then the crop virtual water is the sum of the green virtual water plus the blue virtual water.

When ER≥CWR and 0=IR , the content of blue virtual water in crops is 0 while that of green one can be expressed as:

When E R< C WR, the content of blue virtual water can be expressed as:

and that of the green one can be expressed as:

Where, IR - irrigation water requirement; CWR- crop water requirement; ER - effective precipitation requirement; VWprod- virtual water of agricultural products; VWg- green virtual water; VWb-blue virtual water; Y - crop yield.
2.2 Crops category
In this research, we calculated the crop virtual water involving 27 types of crops which can be categorized into 10 categories, namely, grain crops,oil plants, sugar crops, cotton, bast fibre plants,fruit, vegetables, melons, tobacco and tea (Table 1).Employing the CROPWAT model developed by FAO, we divide the calculation area into several geological units by prefecture-level city (district),then we calculate the CWR per unit area of each major type of crop in each region with the CROPWAT model and then by multiplying the CWR per unit area of each province as a whole by the corresponding cultivated area we can get the total water consumption by crops in each province.By dividing the total water consumption by the total yield, we can get the virtual water per unit mass of the corresponding crop.
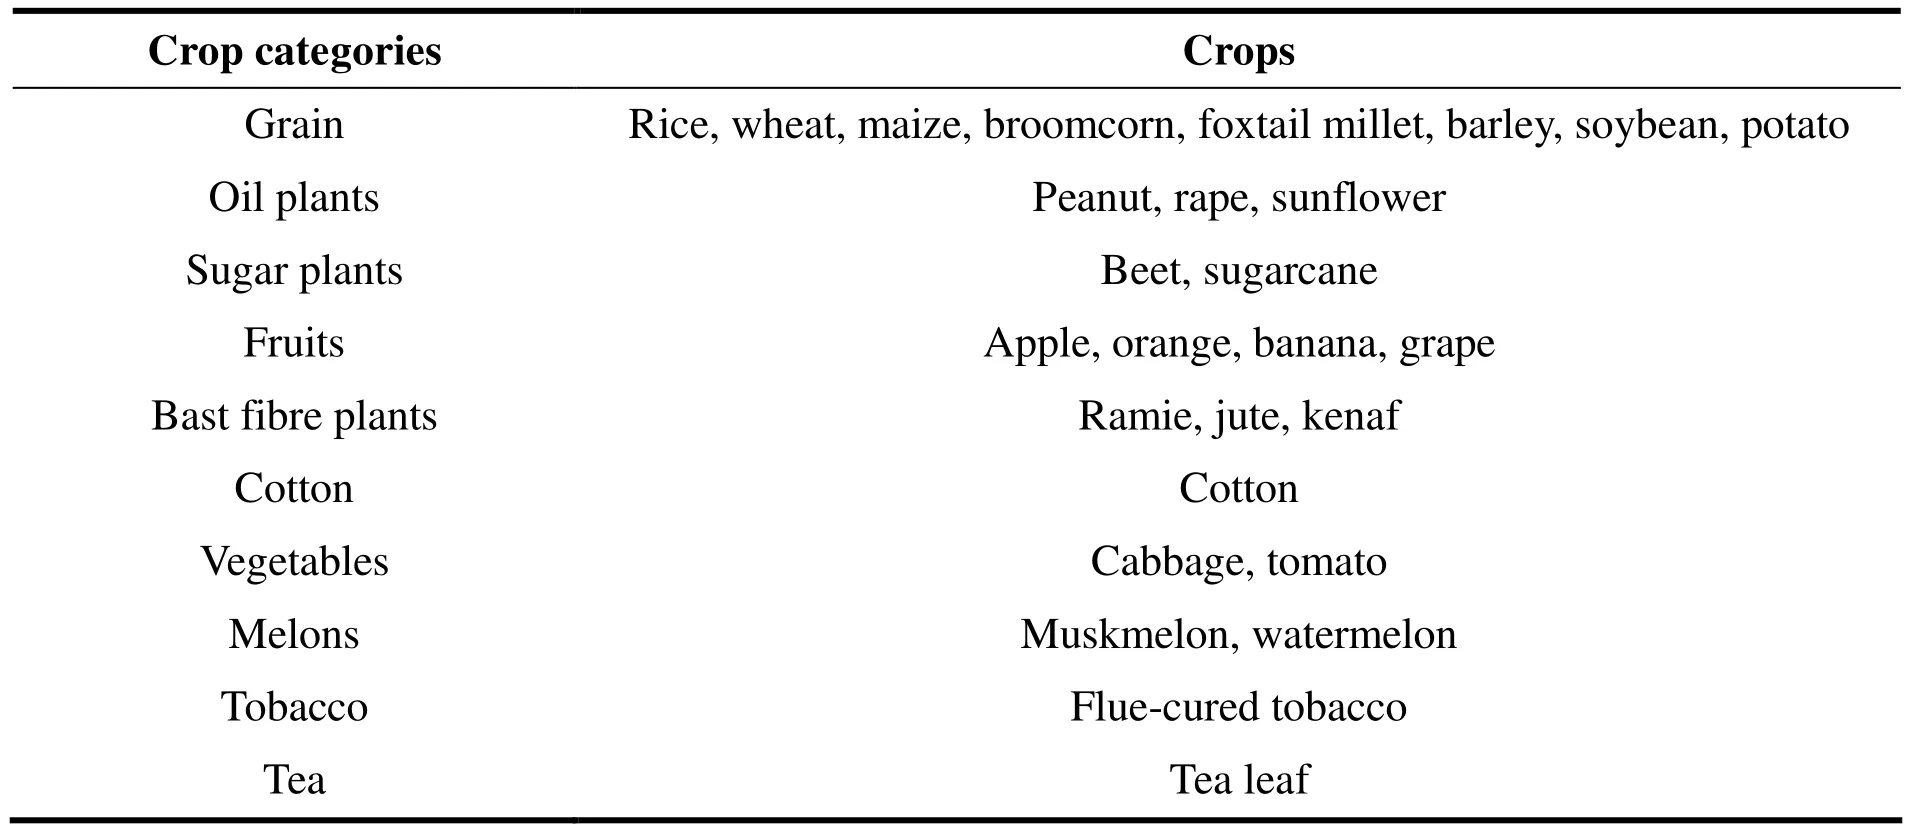
Table 1 List of the calculated crops
2.3 Data sources and processing
(1) Data about crop cultivation and maturity date from Data Set of Crop Growth and Farmland Soil Moisture on 10-Day Basis of China (from China Meteorological Data Sharing Web of Service, http://cdc.cma.gov.cn) and Study on Contour Map of Major Crop Water Requirement in China.
(2) China-related data from the database CLIMWAT and database CROP of FAO.
(3) Statistical Yearbook 1985-2008 involving 31 provinces, municipalities cities and autonomous regions; China Water Resources Bulletin 1998-2007; China Rural Statistical Yearbook; Statistical data about the 30 Years of Reform and Opening-up,etc.
3 Analysis on results
3.1 Virtual water of major agricultural products
The calculation result of the virtual water content per unit of nine among the ten categories of agricultural products involved in this research(excluding the tea leaf which employs the calculation result of Chapagain and Hoekstra(2003)) are listed in Table 2 and Fig. 1. As the calculation result shows, the cotton has the highest virtual water content per unit (4.91-7.42 m3/kg),followed by bast fibre plants (1.22-2.39 m3/kg), oil plants (1.51-2.26 m3/kg), tobacco (1.41-1.92 m3/kg), grain (0.84-1.10 m3/kg), fruits (0.29-1.44 m3/kg), sugar plants (0.14-0.19 m3/kg), vegetables(0.10-0.15 m3/kg), melons (0.11-0.16 m3/kg) successively, the last three having the lowest virtual water content per unit. The result indicates that the virtual water content per unit of each type of agricultural product varies obviously, which is directly due to the water consumption per area and the yield per area of each type of agricultural product and is actually related to the physiological property of plants, such as planting time, growth cycle, cropping pattern, etc.
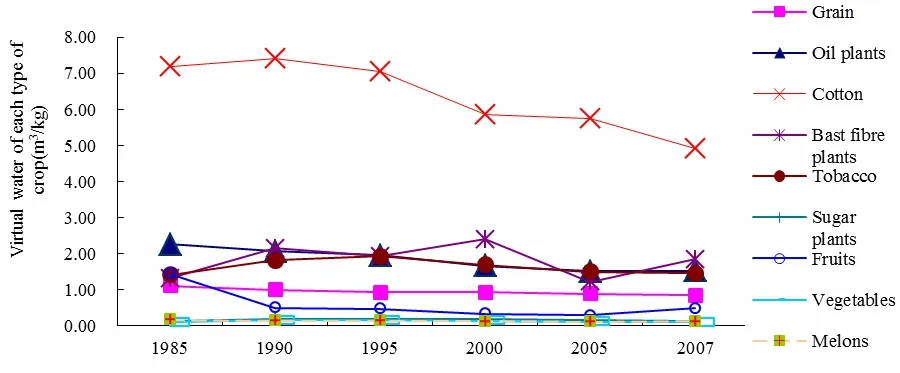
Fig. 1 Virtual water volume per unit crops of China in 1985-2007 (m3/kg)
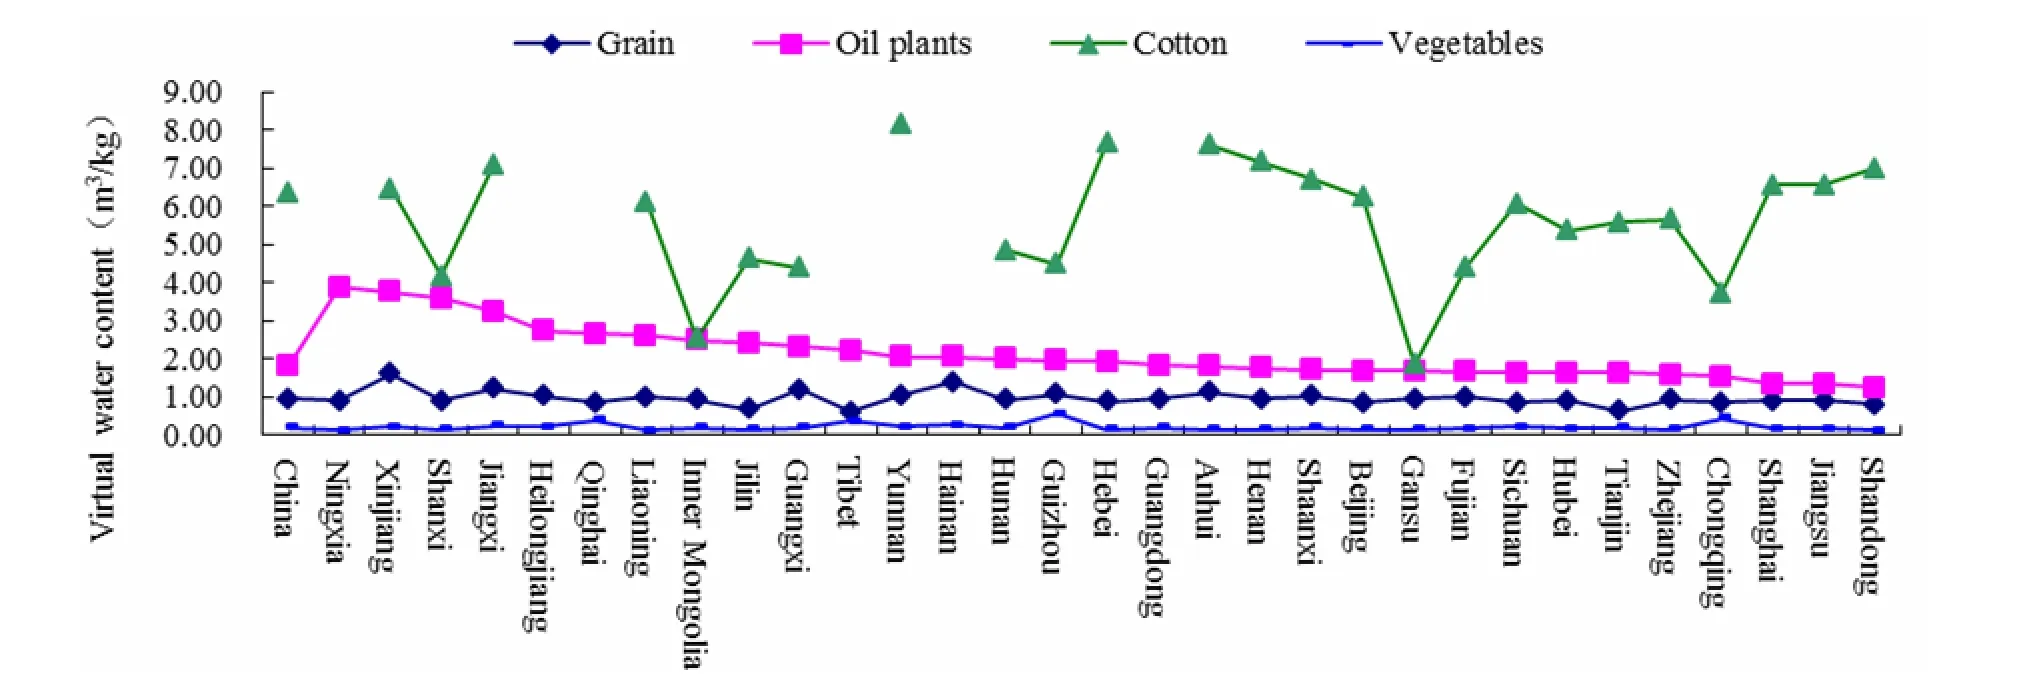
Fig. 2 Virtual water volume per unit crops in different province of China in 1985-2007 (m3/kg)
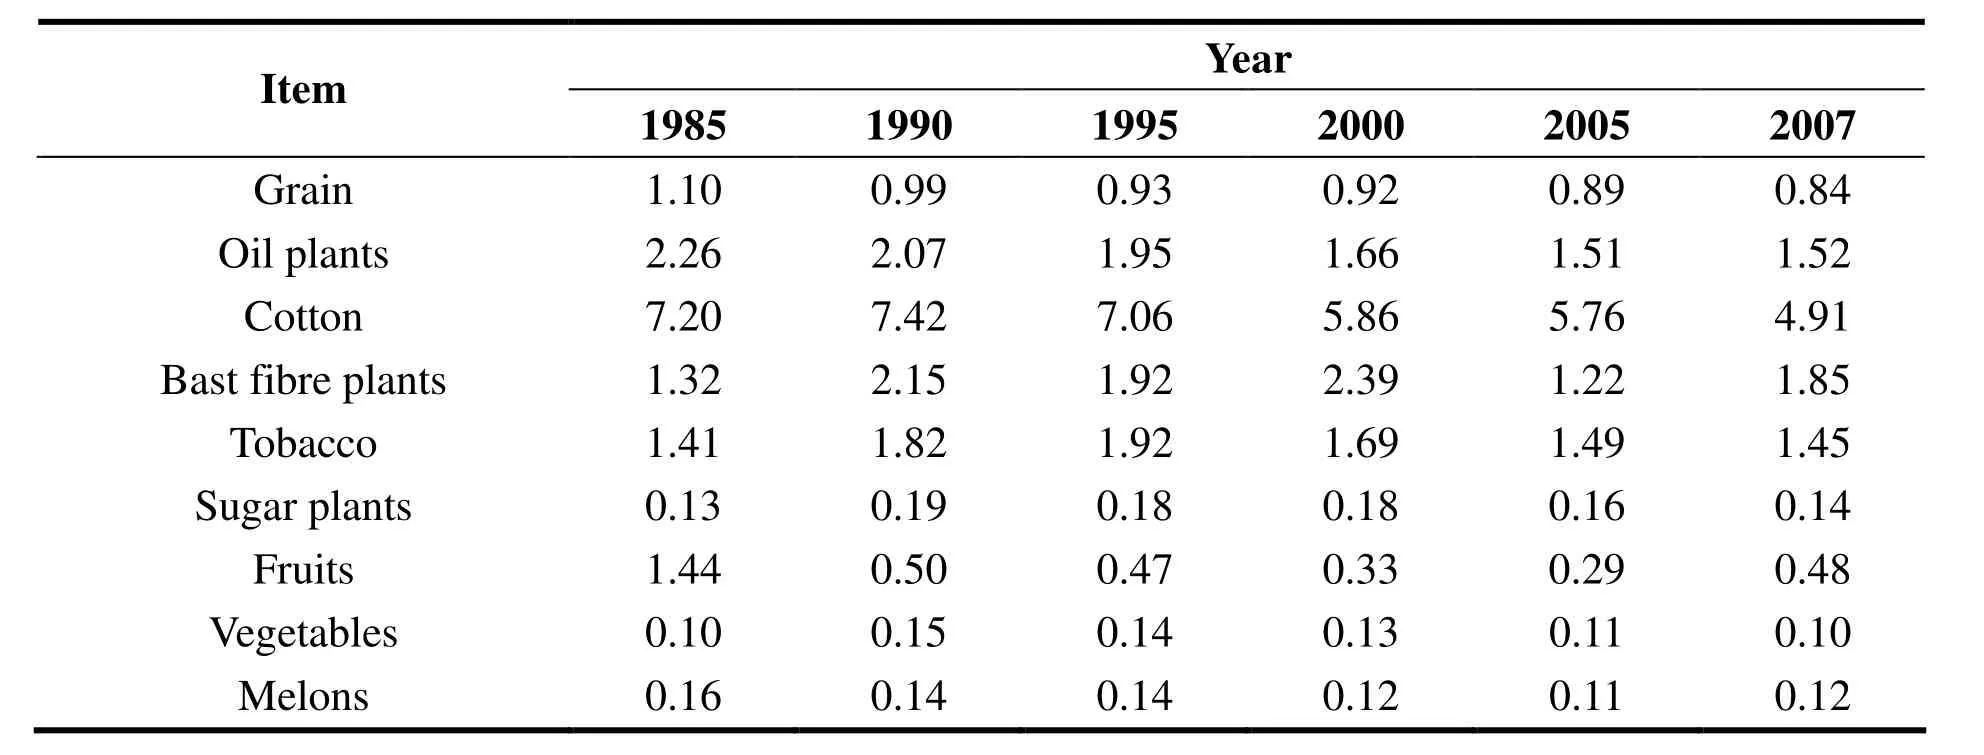
Table 2 Virtual water volume per unit crops of China in 1985-2007(m3/kg)
The result also shows that the virtual water content of most of the agricultural products almost kept unchanged or changed little during 1985-2007 except cotton whose virtual water content kept declining since 1985. This condition occurred may be owing to the new production technology applied in cotton planting, which increases the yield per unit area and the water-use efficiency of cotton for growth.
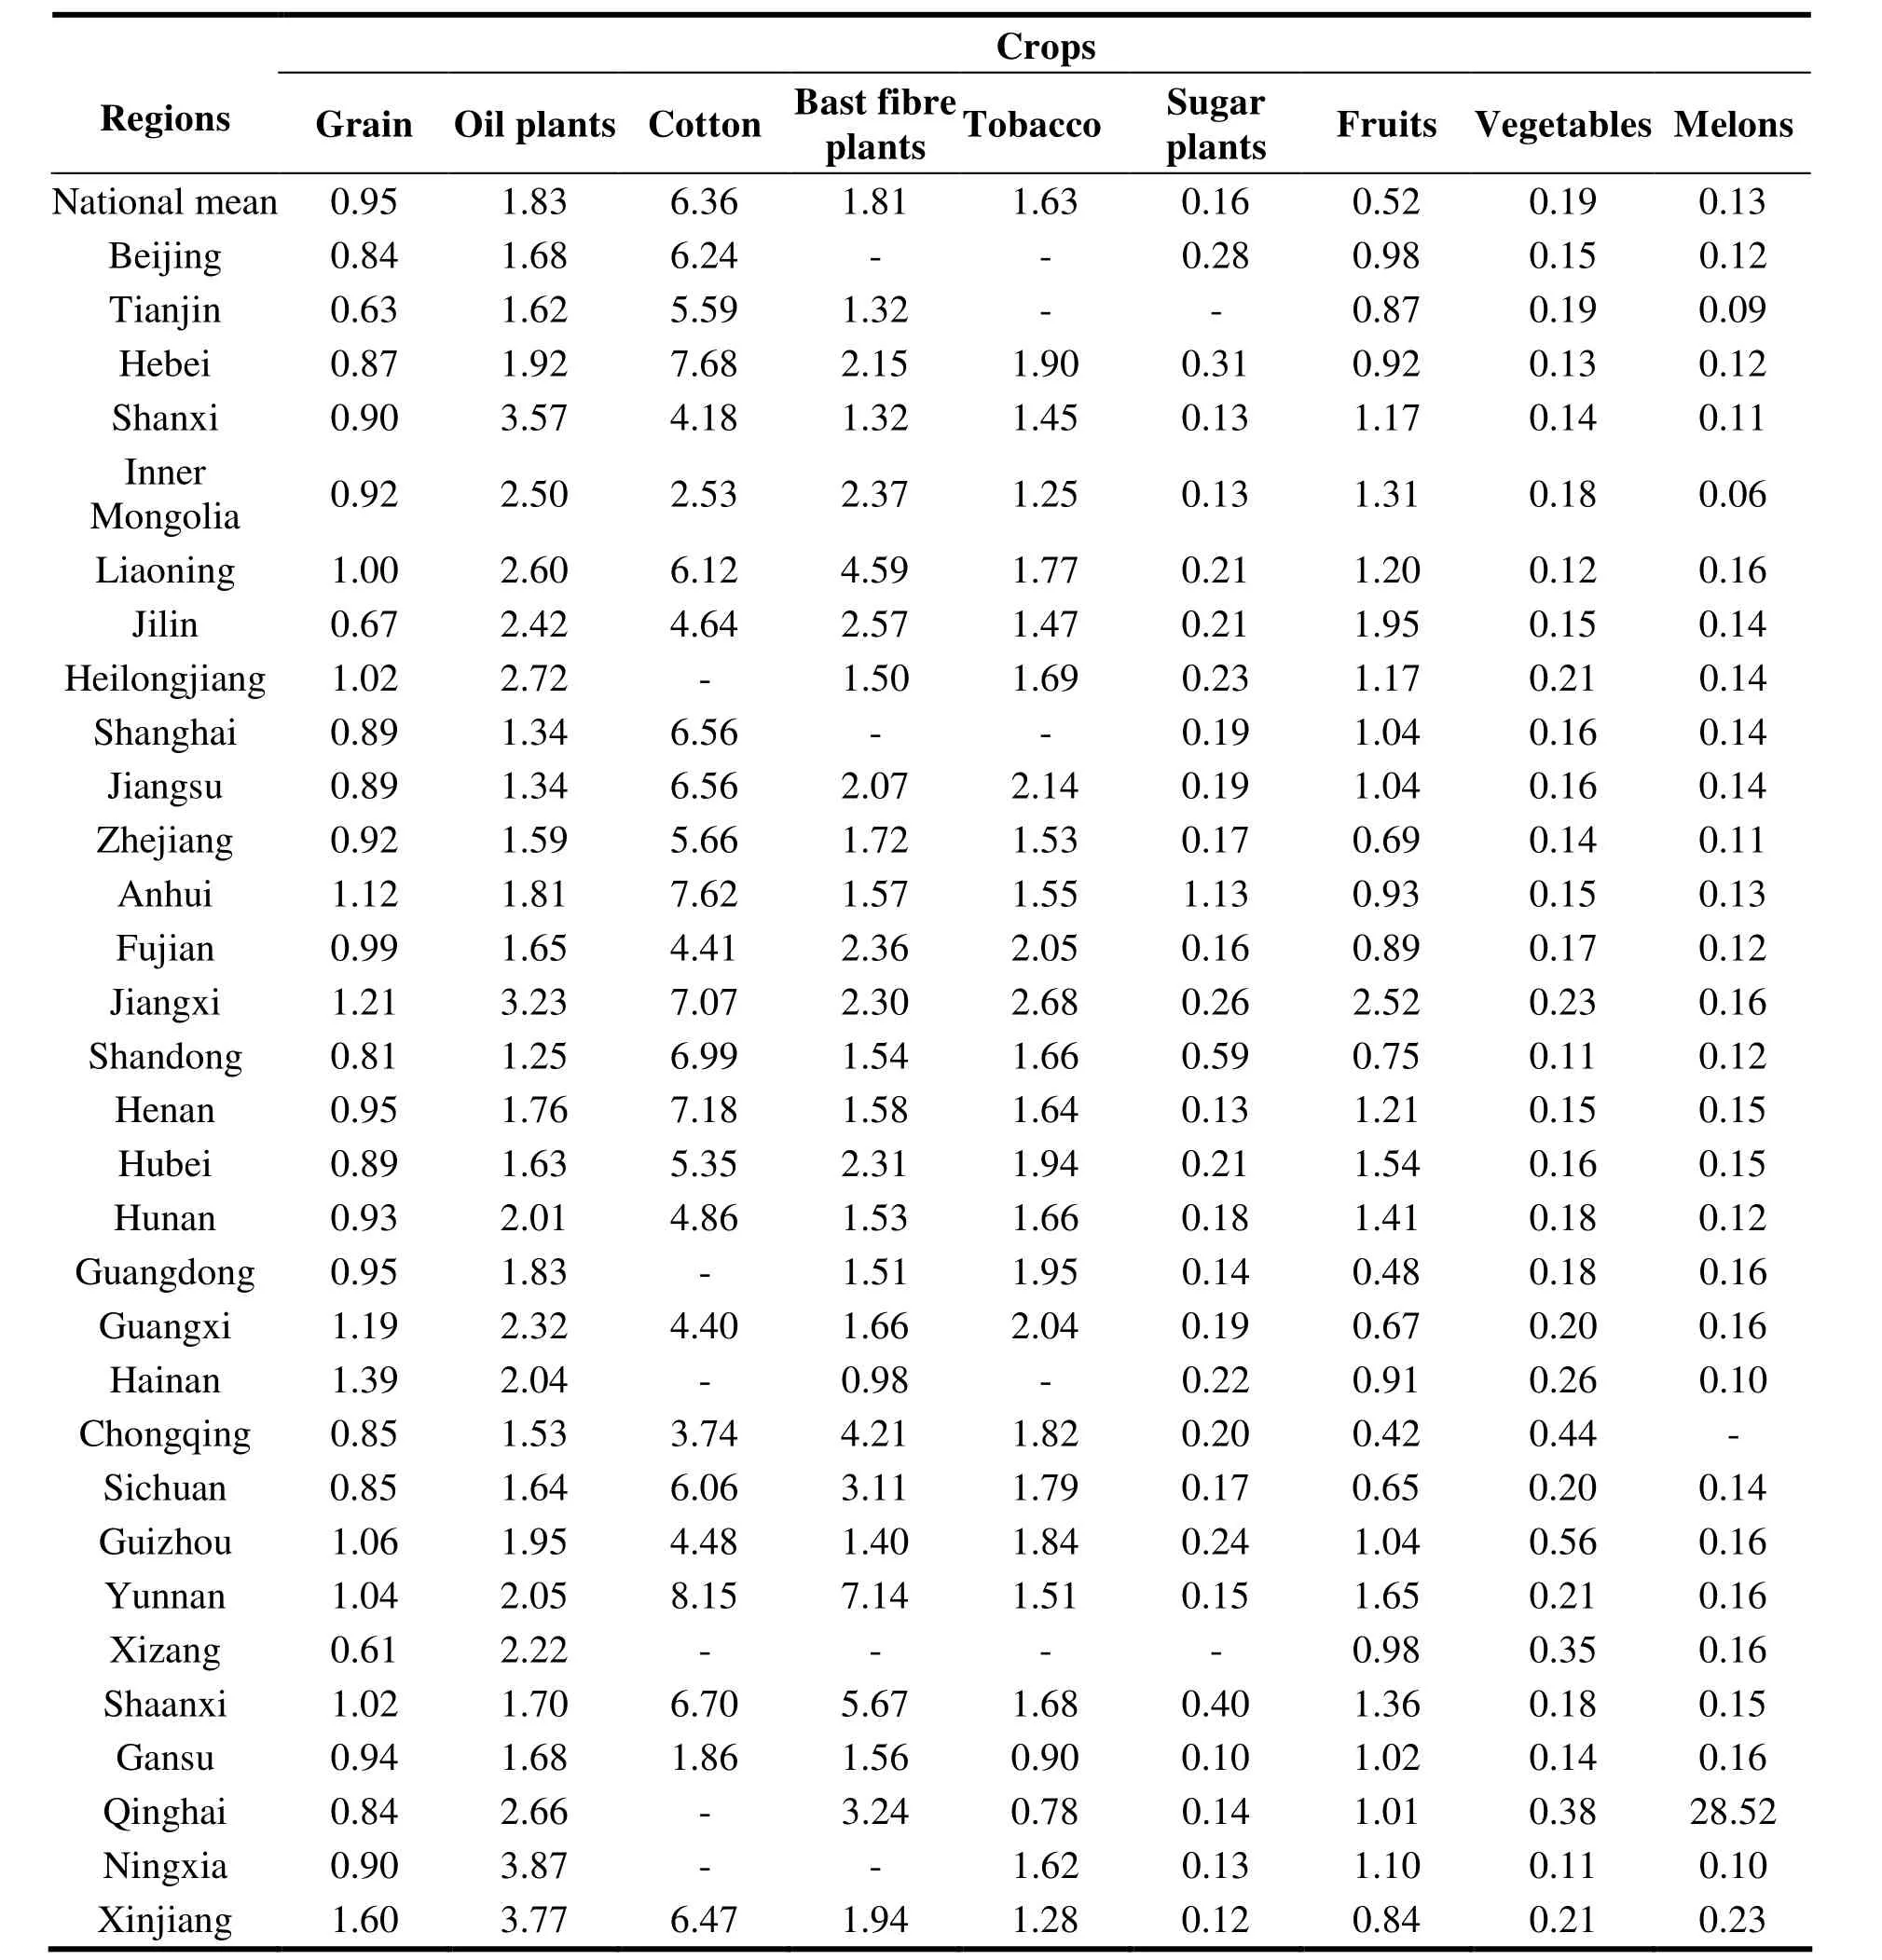
Table 3 Virtual water volume per unit crops in different province of China in 1985-2007 (m3/kg)
3.2 Virtual water of the same type of agricultural product in different regions
The average virtual water content per unit agricultural product of each province of China during 1985-2007 is as shown in Table 3. As shown in Table 3 and Fig. 2, the unit content of virtual water varies with regions. For grain, the national average virtual water content per unit is 0.95 m3/kg, while in Xinjiang, Hainan and Jiangxi,the virtual water content per unit can reach up to 1.60 m3/kg, 1.39 m3/kg and 1.21 m3/kg respectively, and in Jilin, Tianjin and Tibet, the virtual water content reaches the lowest point of 0.67 m3/kg and 0.63 m3/kg and 0.61 m3/kg respectively.For oil plants, the national average virtual water content per unit is 1.83 m3/kg; Ningxia, Xinjiang,Shanxi and Jiangxi with respective virtual water content over 3 m3/kg rank top four, Ningxia with 3.87 m3/kg ranking top one; Chongqing, Shanghai,Jiangsu and Shandong rank the bottom four,Shandong with 1.25 m3/kg ranking the last one.For cotton, the national average virtual water content per unit is 6.36 m3/kg; Yunnan, Hebei,Anhui and Henan rank top four, Yunnan possessing the highest content of 8.15 m3/kg while Gansu possessing the lowest content of 1.86 m3/kg. For other agricultural products like bast fibre plants,tobacco, sugar plants, fruits, etc., the virtual water content per unit varies with regions obviously.
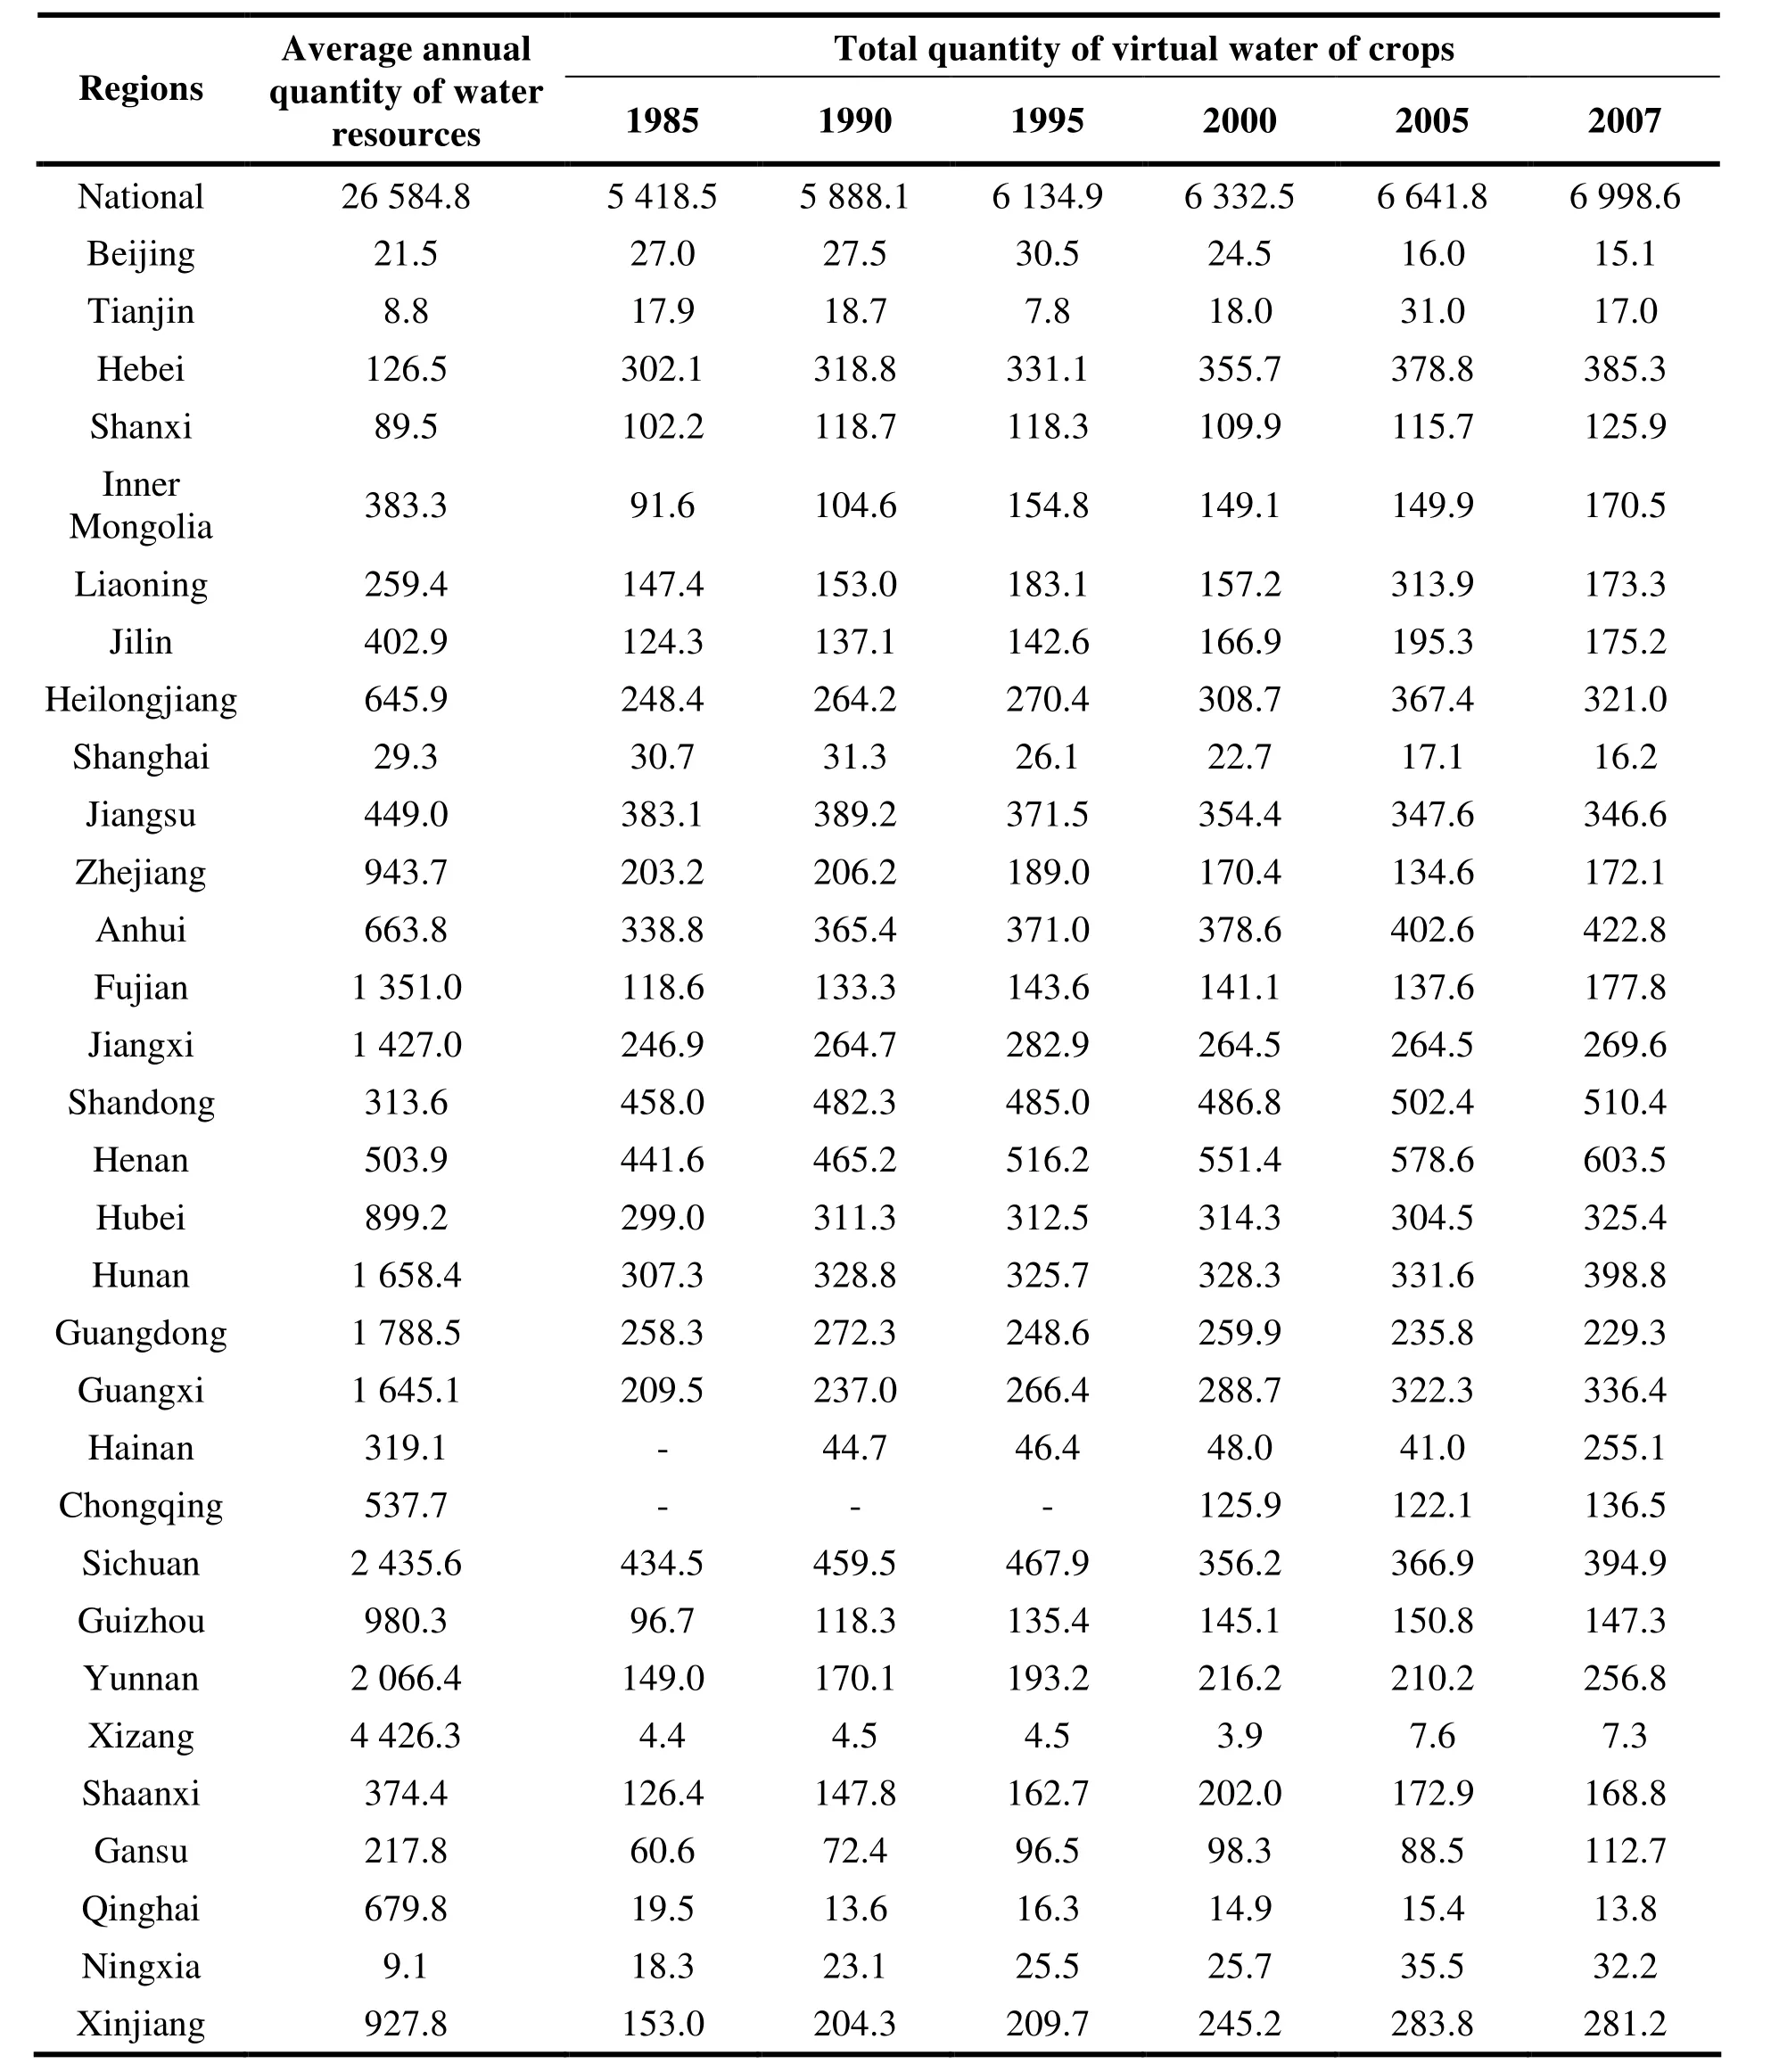
Table 4 Total virtual water volume of crops in China 1985-2007(108 m3)
3.3 Quantity of renewable water resources and total crop virtual water of different regions
The comparison analysis on the local renewable water resources and the water demand of crops for growth has great significance for the future water resources allocation and rational planning of cropping pattern. As shown in Table 4,provinces with ample average annual quantity of water resources are distributed in south of China,such as Fujian, Jiangxi, Hunan, Guangdong,Guangxi, Sichuan and Tibet (over 1 000×108m3),while in northern provinces the quantity of water resources is comparatively less. By comparing the quantity of renewable water resources with that of the total virtual water of agricultural products, we found that the renewable water resources is far from enough to support the growth of crops in regions like Beijing, Tianjin, Hebei, Shanxi,Ningxia, Henan, etc., and irrational utilization of water resources is also found in these regions.
4 Discussions
The theory of virtual water breaks through the conventional concept that studies of water resources must be carried out based on the water entity and expand the research area of water resources and thus provide a new perspective for the discussion on water resource problems,creating an important innovative field for waterrelated researches.
4.1 Popularization of water-saving agriculture
The average quantity of virtual water of grain of China during 1985-2007 calculated in this paper is 0.95 m3/kg, which is lower than the value (1.13 m3/kg) calculated by Wang Xinhua et al in 2000.However, the water consumption for grain production is still high compared with western developed countries like the U.S (0.794 m3/kg) and the 15 EU countries (0.629 m3/kg) (De Fraiture,2004). This condition is closely related to the factors like water-use efficiency, agricultural production technology, management, etc. It is still necessary for China to enhance agricultural science and technology input, popularize water-saving agriculture and reduce the quantity of virtual water of agricultural products, so as to realize the efficient utilization of water resources.
4.2 Comprehensive allocation of crops
In recent years, some experts have come up with a new concept of agricultural-structure water saving, which means realizing the optimal coupling of water resources and agriculture by adjusting the agricultural structure, rationalizing the agricultural distribution and planning integrally(LI Rong-sheng, 1999). In regions lacking water resources, we suggest cutting down the production of crops with high water demand to relieve local water stress and thus to protect the ecoenvironment. In regions with ample water resources, we suggest planting crops with high water demand to make full use of the local copious water resources.
Major factors influencing the water demand of crops include precipitation, air temperature, air pressure, sunshine duration, wind speed, crop category, soil conditions, planting time, etc. The virtual water content per unit of the same type of crop may vary with regions significantly. For example, Henan has a high yield of wheat and maize but low virtual water content. The virtual water content of finished wheat products (flour) in Henan is less than 1/2 of that in Hunan (YAO Lan,2006). This condition is also found in this research.For grain, the region with the highest virtual water content is Xinjiang (1.60 m3/kg), while the lowest is Tibet (0.61 m3/kg). For oil plants, the region with the highest virtual water content is Ningxia(3.87 m3/kg), while the lowest is Shandong (1.25 m3/kg). For cotton, the region with the highest virtual water content is Yunnan (8.15 m3/kg) while the lowest is Gansu (1.86 m3/kg). For other agricultural products like bast fibre plants, tobacco,sugar plants and fruits, the virtual water content per unit also vary with regions obviously.Therefore, grasping and rationalizing the nationwide crop allocation as a whole is one of the important ways to realize rational allocation and efficient utilization of water resources.
4.3 Choosing rational cropping pattern& making full use of green water
Grow the kind of crop that is more adaptive to the local condition. For example, both the peanut and the oilseed rape belong to oil plants, but the yield of the former is 2-3 times of the latter with nearly the same water demand (YAO Lan, 2006).For regions lacking water, the crop with lower virtual water content is suggested for saving water.Comparing with the blue water, the green one requires a relatively lower opportunity cost(Chapagain et al. 2006; Chapagain and Orr, 2009)and causes less negative impact on the environment. Thereby, we suggest choose rational cropping patterns combining with the growth characteristics of the crop, so as to make full use of the green water resources. In the wheat-maize cropping pattern of the North China Plain, the wheat growth mainly relies on the blue water, with the ratio between the blue water and the green one at 4:1, while the maize relies mainly on the green water, with the ratio between the blue water and the green one at 1:4 (GE Li-qiang, 2010). In the region lacking water, choosing a cropping pattern that can use the green water efficiently has great significance for protecting the groundwater resources and the eco-environment.
4.4 Trade of virtual water
The spatial distribution of water resources in China is extremely uneven, the water quantity declining gradually from the southeast coastal area to the northwest inland, water lacking in northern area while ample in southern area. The strategy of virtual water has become a new method for countries and regions all over the world to solve the problem of water safety and grain safety.Hoekstra (2003) thought it is necessary for large countries like China where the water distribution is extremely uneven to carry out study on domestic trade of virtual water. Renault (2003) also put forward that the study on trade of virtual water is not only limited in spatial aspect but can also extend to temporal scale. For example, the agricultural products produced in wet seasons can be stored waiting to sale in dry seasons. Thereby,the value of virtual water stored in food is not the value of production stage but the one of consumption stage. All in all, the virtual water content is not a constant but a variable which can vary with time and space.
In domestic and international trade, the variety and quantity of agricultural products import and export shall be determined by the virtual water characteristics of the local crops. Through “virtual water” trade, the water stress in water-deficient regions can be relieved. That's to say, by employing the theory of comparative advantage, we can change the productive structure, so as to reduce the regional water consumption and realize the sustainable utilization of water resources of China.
Acknowledgements
This work was supported by China Geological Survey under Grant (No. 12120114006401).
杂志排行
地下水科学与工程(英文版)的其它文章
- Emergency water supply capacity analysis of major cities in Hebei
- Sustainable utilization measures of groundwater resources in Beijing
- Analysis of bromate and bromide in drinking water by ion chromatography-inductively coupled plasma mass spectrometry
- Characteristics-based classification research on typical petroleum contaminants of groundwater
- Study of moisture migration in clay soils considering rate of freezing
- Comparison of hydrogeological characteristics between the Sanjiang Plain and the Amur River Basin
