Study of moisture migration in clay soils considering rate of freezing
2014-11-26KudryavtsevKazharskiiGoncharovaBerestianyi
Kudryavtsev S A, Kazharskii A V, Goncharova E D, Berestianyi I B
1 Far Eastern State Transport University (FESTU), Khabarovsk 680021, Russia.
2 Research Construction and Engineering Company “DV-GEOSYNTHETICS”, Khabarovsk 680021, Russia.
Abstract: The paper presents some methods of numerical modelling and a study of moisture changing in frozen clay soils considering rates of freezing in the foundation. An impact assessment of moisture changes in clay soils affecting strength characteristics during thawing was carried out in stability tests.
Keywords: Moisture; Clay soil; Freezing; Numerical modelling
Introduction
Freezing, frost heaving and thawing of wet ground are complex thermodynamical processes.Quantitative assessments of soil deformation considering frost heaving and thawing are one of the most challenging tasks of geomechanics. The main difficulty in conducting these quantitative assessments is the necessityto consider changes in the condition of freezing and thawing soils in the foundation layer as well as thermal and physical characteristics of the changing environment.Freezing and thawing take place simultaneously with changes in the temperature field and are accompanied by moisture migration to the freezing front.
When conducting a study of freezing, frost heaving and thawing activity it is reasonable to take into account a ratio of frost heaving deformation to freezing rate of foundation soils because frost heaving is determined in the main by the suction of water migration from groundwater to the freezing front. The lower the rate of advance in the freezing front, the greater the amount of moisture moving to the freezing front, and consequently considerable frost heave deformation can appear in frozen foundation.
Previous numerous researches show that the main negative process in frozen soils is moisture redistribution due to water migration when freezing. Features of soils and their physical and mechanical characteristics change when water freezes in soil.
Our study analyzed the changes of soil characteristics when water migrates during freezingthawing, and a parabolic equation of lateral resistance versus moisture was established that can assist in the determining the relationship between lateral resistance and soil moisture.
1 Numerical modelling processes of freezing, frost heaving and thawing
Numeric modelling was conducted using the FEM-models program complex developed by geotechnical engineers in St Petersburg, Russia(Kudriavtcev S et al. 2003; Kudriavtcev S et al.2012; Kudriavtcev S et al. 2013). A component of the FEM-models is the “Termoground” program which encourages research into freezing processes,frost heaving and thawing in an annual cycle using spatial programming of numerical modelling by the method of final elements. The core of mathematical modelling of thermophysical processes in the “Termoground” program is the model of high ice, thawed and frozen soils offered by N A Tsytovich, Y A Kronik and V F Kiselev. Numeric modelling of freezing, frost heaving and thawing is solved in two stages. Firstly, the thermotechnical component begins where moisture and temperature fields are determined for every period of time.Secondly, the stress strain behaviour of soils in the foundation layer are determined during the processes of frost heaving and thawing (Kudriavtcev S et al. 2003).
The general equation describing the freezing and thawing processes for a transient thermal regime in a three dimensional soil space can be expressed as follows:
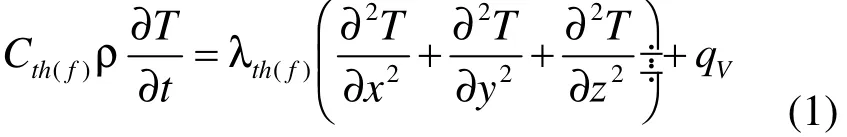
Where Cth(f)- specific heat of soils (frozen or thawed), J/kgK; ρ - oil consistency, kg/m³; T -temperature, K; t - time, c;)(fthλ - thermal conductivity of soil (frozen and thawed), W/mK; x,y, z - coordinates, m; qv- internal heat source capacity, W/m³.
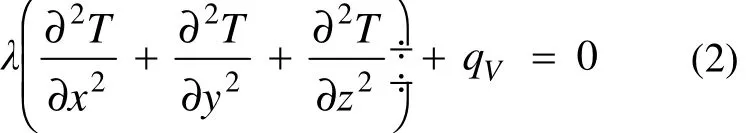
Under steady conditions the inbound and outbound flow of the elementary unit of soil is the same at any time. In these conditions, as the left hand side of the equation is eliminated, the equation is reduced to:
The heat capacity function consists of two parts:(a) volume specific heat of soil (thawed or frozen);(b) latent heat of transition (within a range of negative temperatures) which is absorbed or yielded by soil due to changes in phase of ground water. This can be expressed as follows:
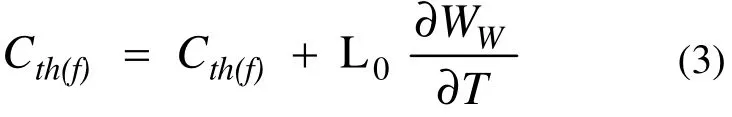
Where Cth(f)- volume specific heat of thawed or frozen soil; L0= 335×106J/m³ = 335×103kJ/m³ = 8 975 Btu/ft3= 79 760 kkal/m³ - water-ice latent heat of transition; Ww- moisture content of unfrozen water.
The volume specific heat Cth(f)can be presented graphically on the heat exchange curve in thawed and frozen areas as shown in Fig. 1.

Fig. 1 Curve of heat exchanges in soil (freezing-thawing)
Average soil moisture within a migration layer(the amount of migration moisture is considered) is determined from the formula:

Where Qwf- amount of migration moisture; γd-specific weight of dry soil. The mass of migration soil is determined from the formula:

Where Qwf- migration flow intensity of mois-ture; А - cross-sectional area of migration flow; t -impact time.
As the migration flow is measured in the unit volume, the specific weight of dry soil γdequals to the mass of dry soil Qd. Thus, the delta of average migration moisture per time period equals:
Having analyzed all existing ratios of the moisture increment Δw1(fr. unit) versus the rate of freezing Vf(m/time) in different types of soil,relevant approximating functions were selected.Average values of the approximating functions for ratios of moisture increment Δw1versus rate of freezing Vfon the freezing front for different soils are expressed by a common formula as follows:

Where V - rate of soil freezing; b, c - empirical coefficients.
On the basis of abundant surveys in frost soil territories of Russia, there are two maximums of ground water level fluctuations a year: spring and autumn. The spring maximum is characterized by the highest level in a year.
2 Experimental designs
A range of variants including different levels of ground water and different rates of freezing were considered in solving thermophysical problems using numerical modelling methods. The tests were conducted for low-plastic silt loam, which is widespread in southern regions of the Far East.
The numeric modelling tasks considered different rates of soil freezing when the average monthly air temperature falls within the 2-9 °C below zero range that corresponds to the freezeto-frost interval of soil condition.
In the study sites, the groundwater level varied from 1.0 m to 2.5 m from the surface.
When the thermophysical task was solved within a day, the interval of changes was split into 4 periods of 6 hours. Every period was set with different air temperatures, both negative and positive. Five series of numerical modelling of freezing with migration moisture changes were conducted at an average daily air temperature Т1 =-2.08 °C; Т2 = -4.16 °C; Т3 = -4.33 °C; Т4 = -6.08°C; Т5 = -8.75 °C.
Fig. 2 shows the temperature distribution in soil during a month in different depths at different rates of freezing.
Diagrams of moisture changes in soil are given in Fig. 3.
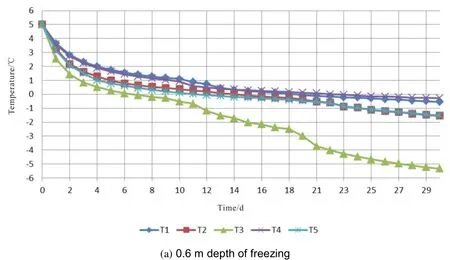

Fig. 2 Daily temperature distribution in depths at average daily air temperature (Т1 = -2.08 °C; Т2 =-4.16 °C; Т3 = -4.33 °C; Т4 = -6.08 °C; Т5 = -8.75 °C)
Fig. 3 Diagrams of moisture changes in soil versus the rate of freezing during average daily air temperature ((a) Т1 = -2.08 °C; (b) Т2 = -4.16 °C; (c) Т3 = -4.33 °C; (d) Т4 = -6.08 °C; (e) Т5 = -8.75 °C)
The moisture changes in soil versus the rate of freezing were determined at the maximum depth during the first 30 days of negative temperature as shown in Fig. 4.
The numerical modelling of moisture changes in frozen soils versus rate of freezing resulted in the following equation:

Where w - moisture of soil; v - rate of freezing,m/day.
The parameters of frozen soil stability were determined according to the results of cylindrical test-piece stability in the triaxle cell of the ASIS measuring and computing complex developed by“Geotech” R&D Co.
Over 30 silt loam tests resulted in a general diagram of spreading. Silt loam taken from southern parts of the Russian Far East was tested for lateral resistance in clay soil in a wide range of moisture. The outcome dependence helps make qualitative and quantitative assessment of how moisture influences lateral resistance and stress and strain condition of a soil structure and its foundation in general.
Fig. 4 Moisture changes in soil versus rate of freezing
Fig. 5 illustrates the range of lateral resistance changes in soil due to moisture.
The study we conducted allowed for the establishment of a parabolic equation to assist in defining the relationship between lateral resistance and soil moisture:

Where Сu- specific cohesion; w - soil moisture.
3 Conclusions
Our study of moisture changes in frozen soils in relation to the rate of foundation freezing in an annual cycle shows that moisture value increases by 68% throughout the year as foundations freeze,while the lateral resistance in clay soils decreases five-fold.
The developed numerical modelling method of determining temperature, moisture and lateral resistance allow to assess the impact of frost heaving, the decrease in strength of building and structure foundations at freeze-thaw action. The numerical model helps to introduce effective modern reinforcement structures with new materials for soil structures and their foundations and to decrease or eliminate negative impact of frost heaving and thawing on build structures.

Fig. 5 Lateral resistance changes in soil due to moisture
杂志排行

地下水科学与工程(英文版)的其它文章
- Emergency water supply capacity analysis of major cities in Hebei
- Study of water resources for crop utilization in China from the perspective of Virtual Water
- Sustainable utilization measures of groundwater resources in Beijing
- Analysis of bromate and bromide in drinking water by ion chromatography-inductively coupled plasma mass spectrometry
- Characteristics-based classification research on typical petroleum contaminants of groundwater
- Comparison of hydrogeological characteristics between the Sanjiang Plain and the Amur River Basin