Genetic and morphological variation in natural teak (Tectona grandis) populations of the Western Ghats in Southern India
2014-09-06SreekanthBalasundaranNazeem
P.M. Sreekanth · M. Balasundaran · P.A. Nazeem
ORIGINAL PAPER
Genetic and morphological variation in natural teak (Tectona grandis) populations of the Western Ghats in Southern India
P.M. Sreekanth · M. Balasundaran · P.A. Nazeem
Received: 2013-04-23; Accepted: 2013-10-07
© Northeast Forestry University and Springer-Verlag Berlin Heidelberg 2014
Teak (Tectona grandis L.f.) is a popular hardwood species native to South and South-East Asia. The possible association of amplified fragment length polymorphism (AFLP) marker with morphological variables of eleven important characters viz. girth at breast height (GBH), height of tree, bole height, branch knots, presence of fluting, spiral stem, leaf hair, leaf length/breadth ratio, branching pattern, bark colour and petiole shape for nine natural populations comprising 180 genotypes of teak (9 populations × 20 trees). The phenogram constructed using Euclidean distances for the eleven morphological characters showed that the populations were not grouped according to their geographical origin. The Mantel’s test for pairwise correlation between Euclidean distances of different morphological variables and genetic distances from AFLP data revealed that only petiole character (r =0.269; p =0.046) and height of tree (r =0.200; p =0.001) were significantly correlated with that of AFLP data matrix. The nine populations in this study covered a geographic area of about 1000 km stretch along the Western Ghat of South India. A test of correlation between genetic and geographic distance matrices revealed a significant positive correlation (r =0.475; p =0.009). The lack of perfect congruence between morphological and molecular data except for geo-graphic distance, tree height and petiole character suggested that the morphological system might be useful for the morphotypes management but not appropriate to study the genetic structure of the teak populations.
AFLP, genetic, teak, morphology, Tectona grandis
Introduction
Teak has a wide but discontinuous distribution in India. It grows well from sea level to an elevation of 1200 m, and with an annual precipitation range from 800-2500 mm. Indian teak provenances show significant variation in terms of adaptability, growth and form under a variety of edaphic and climatic factors. Gunaga and Vasudeva (2003) reported morphological variation in teak clones from Kerala and Karnataka states. Morphological variations in teak clones of Karnataka have been reported with respect to characters like floral traits (Vasudeva et al. 2001), vegetative and reproductive behaviors (Gunaga and Vasudeva 2003), seed germination (Mathew and Vasudeva 2005), and early vigour (Mathew 2001). Bagchi (1999) measured five characters viz. total height, total bole height, diameter at breast height and crown width in 80 sets of teak trees selected from different plantations of Tamil Nadu, Kerala and Karnataka states. Kumar et al. (1997) considered height, diameter and basal area of different teak clones and reported significant genetic variation at the family level. Suri (1984) studied the quantitative and qualitative tree parameters in a provenance trial laid during 1931, comprising five seed sources from Burma, Kerala, Madhya Pradesh, Maharashtra and Karnataka. The statistical analysis showed that teak seeds from moist localities were bigger than those from dry zones. The tree height appears to be a function of site quality rather than origin of seed. Kjaer et al. (1996) while studying the genetic variation in teak from South Asia and Africa observed that differences between populations were much larger for morphological traits like stem form, relative branch size, wood density and allozymes.
Variability studies are important whenever selection forms the basis for genetic improvement (Bedell 1989). Kjaer et al. (2002) demonstrated the genetic and morphological variation inMetroxylon sagu, a sago palm (a South -East Asian crop having high socio-economic importance) using AFLP markers. Sreekumar et al. (2006) conducted molecular and morphometric analysis of different Indian and Srilankan populations of two rattan species (Calamus rivalis and C. metzianus) using RAPD markers and morphological characters. Multivariate analysis of RAPD and morphological data failed to separate rattan populations into two distinct species. Artocarpus altilis (Park) Fusberg is an important fruit vegetable tree grown in homesteads of Southern part of India. In order to provide scientific management practices and conservation measures for this species, Sreekumar et al. (2007) investigated the pattern of morphological and genetic variation existing in six populations of this species using fifteen morphological traits and AFLP markers. They found that genetic variation from AFLP data is not reflected in quantitative morphological variables. However, the genetic and geographical distances were positively correlated which were well supported by the PCoA analysis and Dollo - parsimony tree.
The main objective of teak plantation establishment in India is to produce high quality timber having acceptable growth rates. A large variation in growth and other economically important tree characters such as stem form, mode of branching, flowering habit and wood quality is observed in plantation-grown teak. Teak wood colour seems to be influenced by the site quality and moisture availability. As the golden brown wood colour is one of teak's most attractive timber qualities, the variation in wood colour and texture has been widely studied (Kaosa-ard 1993). The success of planting programmes depends not only on the site quality but also on the genetic quality of the planting materials. Although the growth and yield of the plantations depend mostly on site selection and stem quality (i.e., straightness, persistence of stem axis and branching), is strongly controlled by genetic make-up (Keiding et al. 1986; Wellendorf and Kaosa-ard 1988; Kaosa-ard 1993). The results of international teak provenance trials carried out in Asian, African and Latin American countries have clearly demonstrated the influence of provenance or seed source on growth, stem quality, early flowering habit and health performance (Keiding et al. 1986). However, there is no available information on relation between morphology and genetic data on teak. The objective of the present study was to investigate possible relations between morphology, genetic structure and geographical distribution of natural populations of teak from the Western Ghat region of South India and to identify possible AFLP marker associated with phenotypic characters.
Materials and Methods
Sample collection from natural forest
The details of morphological characters from different study sites and leaf materials for DNA isolation were collected from nine natural teak growing forests of the Western Ghats belonging to the states of Kerala, Karnataka and Tamil Nadu (Table 1 & 2; Fig. 1). These geographical areas were selected because they were the locations of origin of important provenances from the ‘very moist’ to ‘moist’ teak forests of the Western Ghats identified for raising teak plantations. Historically, Konni, Parambikulam, Nilambur, Wayanad and Thrissur provenances were the sources of huge teak logs, and currently, majority of the teak plantations (70,000 ha approx.) and almost the entire seed production plantations of Kerala are located in the first four geographic areas (Prabhu, 2005). Teak from Nilambur Valley had been acclaimed as the most famous teak source used for shipbuilding and structural purposes during 19thcentury itself. Teak population sampled from Tamil Nadu state was from Indira Gandhi Wild Life Sanctuary located at the Eastern slope of the Western Ghats (Kala et al. 2005). Teak from Barchi (Haliyal Forest Division, Karnataka State) was famous as Dandeli teak because of the unique golden colour and fine grain (Dilip Kumar 2005). Virnoli, which was also part of Haliyal Forest Division was supposed to be the locality of origin of the famous Teli variety of teak which showed fast growth, shiny and smooth leaves that escape teak defoliator, Hyblaea puera attack (Katwal 2005). Moreover, except for Virnoli and Shimoga, these locations had very large, mature trees as well as smaller girth trees available for sampling. From each location, we collected expanding leaves and morphometric details from 20 randomly selected trees from a minimum of 2.5 km2area, sufficiently interior from reserve forest boundaries.
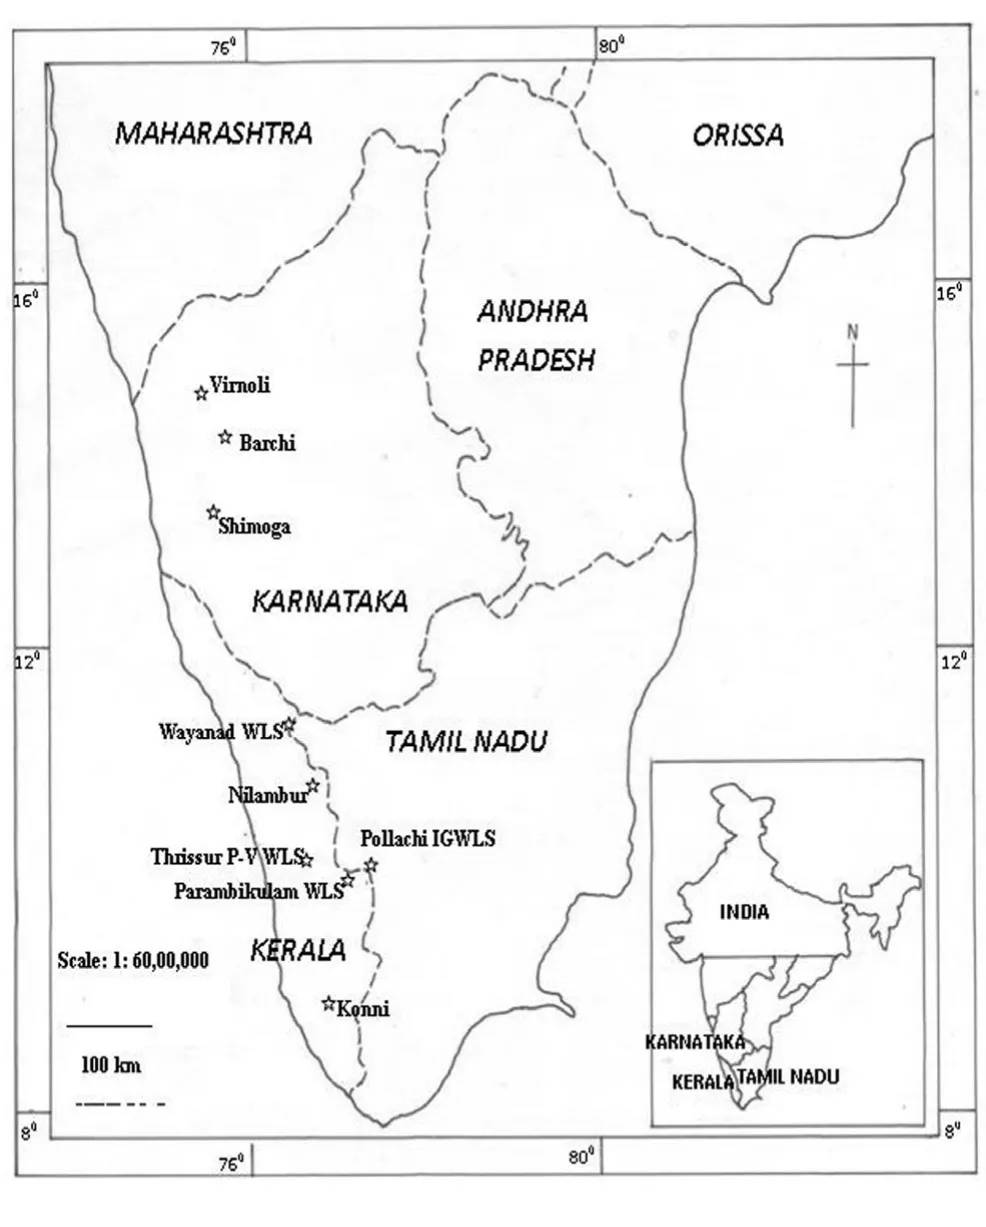
Fig. 1: Map showing the location of natural populations of teak in the Western Ghats region selected for morphological and genetic analysis. WLS: Wildlife Sanctuary; IGWLS: Indira Gandhi Wildlife Sanctuary; P-V WLS: Peechi- Vazhani Wildlife Sanctuary

Table 1: Particulars of the site of teak populations sample collection from the Western Ghats used for AFLP analysis.

Table 2: Characteristics of study sites of nine teak population from the Western Ghats.
Morphological characters
The following are the eleven morphological characters selected. Girth at breast height (GBH): the tree circumference measured at a point 1.37m above average soil level; height of tree: the vertical distance between ground level and tip of the tree; clear bole height: the distance between ground level and the crown point; fluting: the shape of the tree roots extending up from the butt of the tree, measured across the butt end of the log as the maximum inward deviation from roundness; spiral stem: growth of fibers in a spiral direction around the trunk of the tree causing twisting of timber; branching pattern: a secondary woody stem or limb growing from the trunk or main stem of a tree; knots on trunk: results from the inclusion of branches into the tree stem as the tree grows and increases in diameter; petiole shape: winged or sessile; leaf hair: hairs arise as the outward growth of epidermal cells; leaf ratio: the ratio between the leaf length and leaf breadth; bark colour: is the appearance of protective outer covering of the trunk. These characters were recorded in respect of each sampled tree. The details of the characters are listed in Table 3 according to the method suggested by Hush et al. (1972).

Table 3: List of morphological characters used in the study
AFLP analysis
Total DNA was extracted from 0.5 to 1 g of fresh leaf tissues using the modified CTAB protocol of (Doyle and Doyle, 1990). AFLP method was carried out following the standard procedure described by Vos et al. (1995). The reactions were carried out according to the manufacturer’s protocol (AFLP®Analysis System 1 and Starter Primer Kit; Invitrogen Life Technologies, Inc., USA). The amount of DNA was adjusted to 250 ng for the EcoRI and MseI digestion at 37 °C for 2 h. Ligation of EcoRI and MseI adapters was done at 20 °C for 2 h. Five µl of the template DNA from a 1:10 diluted ligation mixture in TE (10 mM Tris–HCl, 1 mM EDTA) buffer was used for pre-amplification with the pre-amplification primer mix. Twenty cycles of amplification were carried out at 94°C for 30 s denaturation, 56°C for 60 s annealing and 72°C for 60 S primer extension in PTC-100 Peltier Thermal Cycler (MJ Research, USA). Five µl of the pre-amplification product was used for selective amplification with ten primer combinations: E-AGG/M-CTT, E-AAC/M-CTG, E-AAC/M-CTT, E-ACT/M-CAG, E-ACC/M-CTT, E-ACA/M-CTT, E-ACC/M-CTA, E-AGG/M-CAG, E-AGG/M-CTG and E-AGG/M-CAT selected out of 64 tested combinations. Primer labeling was performed by phosphorylat-ing the 5' end of the EcoRI primer with γ-p32ATP and T4 kinase. Mix 1 and Mix 2 components were used for selective AFLP amplification in which, Mix 1 was composed of 5 µl of the labeled selected EcoRI primer and 45 µl of MseI primer. Mix 2 was made according to the protocol supplied by Life Technologies with the AFLP kit. Selective amplification was carried out using 5 µl of the pre-amplification product as the template DNA, 5 µl of Mix 1 and 10 µl of Mix 2. A touch down phase of thirteen amplification cycles was carried out initially, with first cycle at 94°C for 30 s denaturation, 65°C for 30 S annealing and 72°C for 60 s primer extension. The annealing temperature was decreased by 0.7°C each cycle during the following 12 cycles. The final 23 cycles were run at 94°C for 30 s, 56°C for 30 s and 72°C for 60 s. Samples were denatured by adding an equal volume of formamide buffer (98% formamide, 10 mM EDTA pH 8, 0.05% bromophenol blue and 0.05% xylene cyanol) and heated at 94°C for 3 min. Five µl of each sample was run in a denaturing 6 per cent, 0.4 mm polyacrylamide gel (1X TBE buffer) in a sequencing gel electrophoretic apparatus (Biorad, USA) at 40 A, 900 V for 2 h. The gel was then transferred onto Whatman No.1 chromatographic paper, dried at 80°C for 2 h on a gel drier (Biorad, USA) and exposed the gel to X-ray film (Kodak®) overnight.
Data analysis
Morphological analysis
The straight forward method of qualitative two state characters recorded as + and - were scored as 1 and 0. Qualitative multistate characters recorded were scored as additive coding, with state (0) character undetectable, state (1) weak positive (+), state (2) moderate positive (++) and state 3 strong positive (+++) (Sneath and Sokal, 1973) (Table 3).
Cluster analysis of morphometric data
Cluster analysis was done for representing morphological distances between populations using the NTSYSpc 2.1 package (Rolf, 2000). The morphological data matrices for eleven characters recorded from nine populations were transferred to STAND option to perform the standardization of data. The standardized data were used to compute pair wise population distance matrices based on Euclidean distance coefficient in SIMINT option and then subjected to unweighted pair group method with arithmetic average (UPGMA) clustering algorithm. Cluster analyses for 180 genotypes individually were also performed using EUCDIST (Euclidean distance) coefficient option in SIMINT module and then subjected to UPGMA clustering (r = 0.86).
PCoA analysis of morphological data
Principal coordinate analysis (PCoA) was carried out for a better representation of morphometric distances between trees of all the populations using the option STAND, SIMINIT, DECENTER and EIGEN options using NTSYSpc version 2.1 (Rolf, 2000).
AFLP data analysis
AFLP data for teak trees from natural forests were utilized to investigate the possible relation between genetic variation and morphological variation existing in teak populations AFLP bands were scored for presence (1) and absence (0) of bands. The data matrices were grouped into nine populations and analyzed using POPGENE, Version 1.32 package for dominant markers and a pair wise comparison of populations was made according to (Sreekanth et al. 2012). The Pair wise genetic distances (Nei 1978) obtained were subjected for correlation studies (Table 4).
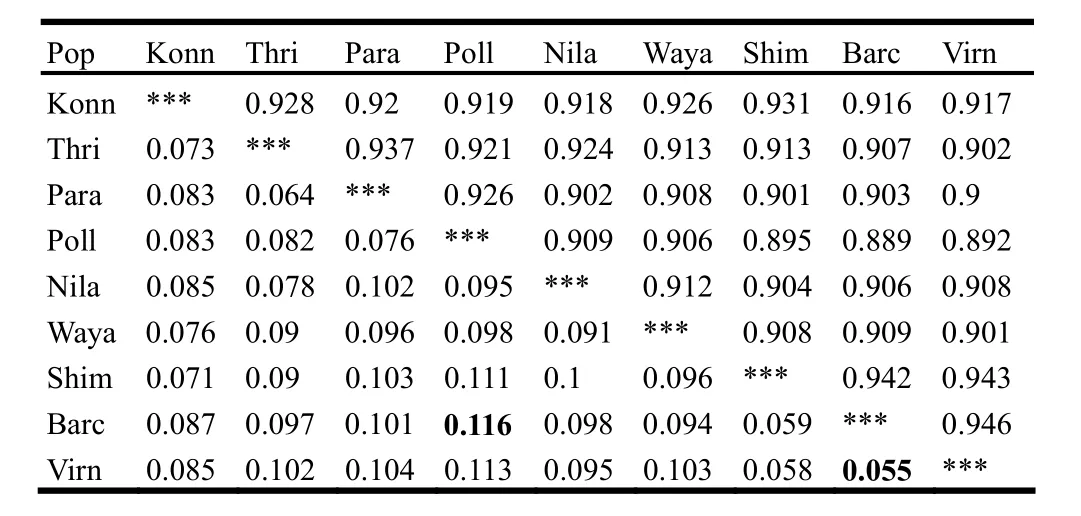
Table 4: Nei’s unbiased measures of genetic identity (above diagonal) and genetic distance (below diagonal) coefficients
Correlation of genetic and morphological distances using Mantel’s test
Pair wise morphological distance matrix was created using EUCDIST (Euclidean distance) option in the SIMINT module of NTSYSpc 2.1 for each morphological character individually, as well as for the overall morphological data set. In order to find out possible relation between the morphological variation and genetic variation, product moment correlation coefficients were calculated between the genetic distance matrices and morphological distance matrices for each character individually as well as for the overall morphological characters using Mantel test (Mantel, 1967). Statistical significance was evaluated with 1000 permutations using TFPGA software, version 1.3 (Miller, 1997).
Correlation between geographic data and genetic data
The values of latitude and longitude recorded for each geographic location of each of the nine natural teak populations were entered in a prescribed format of GenAlex6 software package (Peakall and Smouse, 2006) for creating pair wise geographic distance matrix. The correlation test between the geographic distance matrices and the corresponding genetic distance matrices (as given in the above paragraph of AFLP data analysis) was performed using Mantel test (Mantel, 1967) and statistical significance was evaluated with 1000 permutations using TFPGA software, version 1.3 (Miller, 1997).
Results
Clustering and PCoA of morphological characters
The phenogram constructed using Euclidean distances for eleven morphological characters showed that the nine populations werenot grouped according to their geographical proximity except Para and Thri (Fig. 2). There existed two main clusters, first main cluster formed by Konn, Nila, Shim, Waya, Barc, Virn and Tami and second main cluster comprised of Thri and Para which clustered separately. The cluster analysis of 180 trees from nine populations for similarity in morphological characters showed that the trees were generally scattered among different clusters without any geographical grouping based on their origin.
The PCoA analysis of 180 trees based on eleven morphological characters failed to reveal any major separation in the pattern of morphological variations clearly indicating lack of distinct grouping of populations based on phenetic structure. None of the populations from neighbouring geographic regions tend to fall together in a given proportion of the two dimensional factor spaces. Some of the Para individuals were separated based on morphology (Fig. 3).

Fig. 2: UPGMA dendrogram of morphological characters obtained using Euclidean distance between the nine teak population.
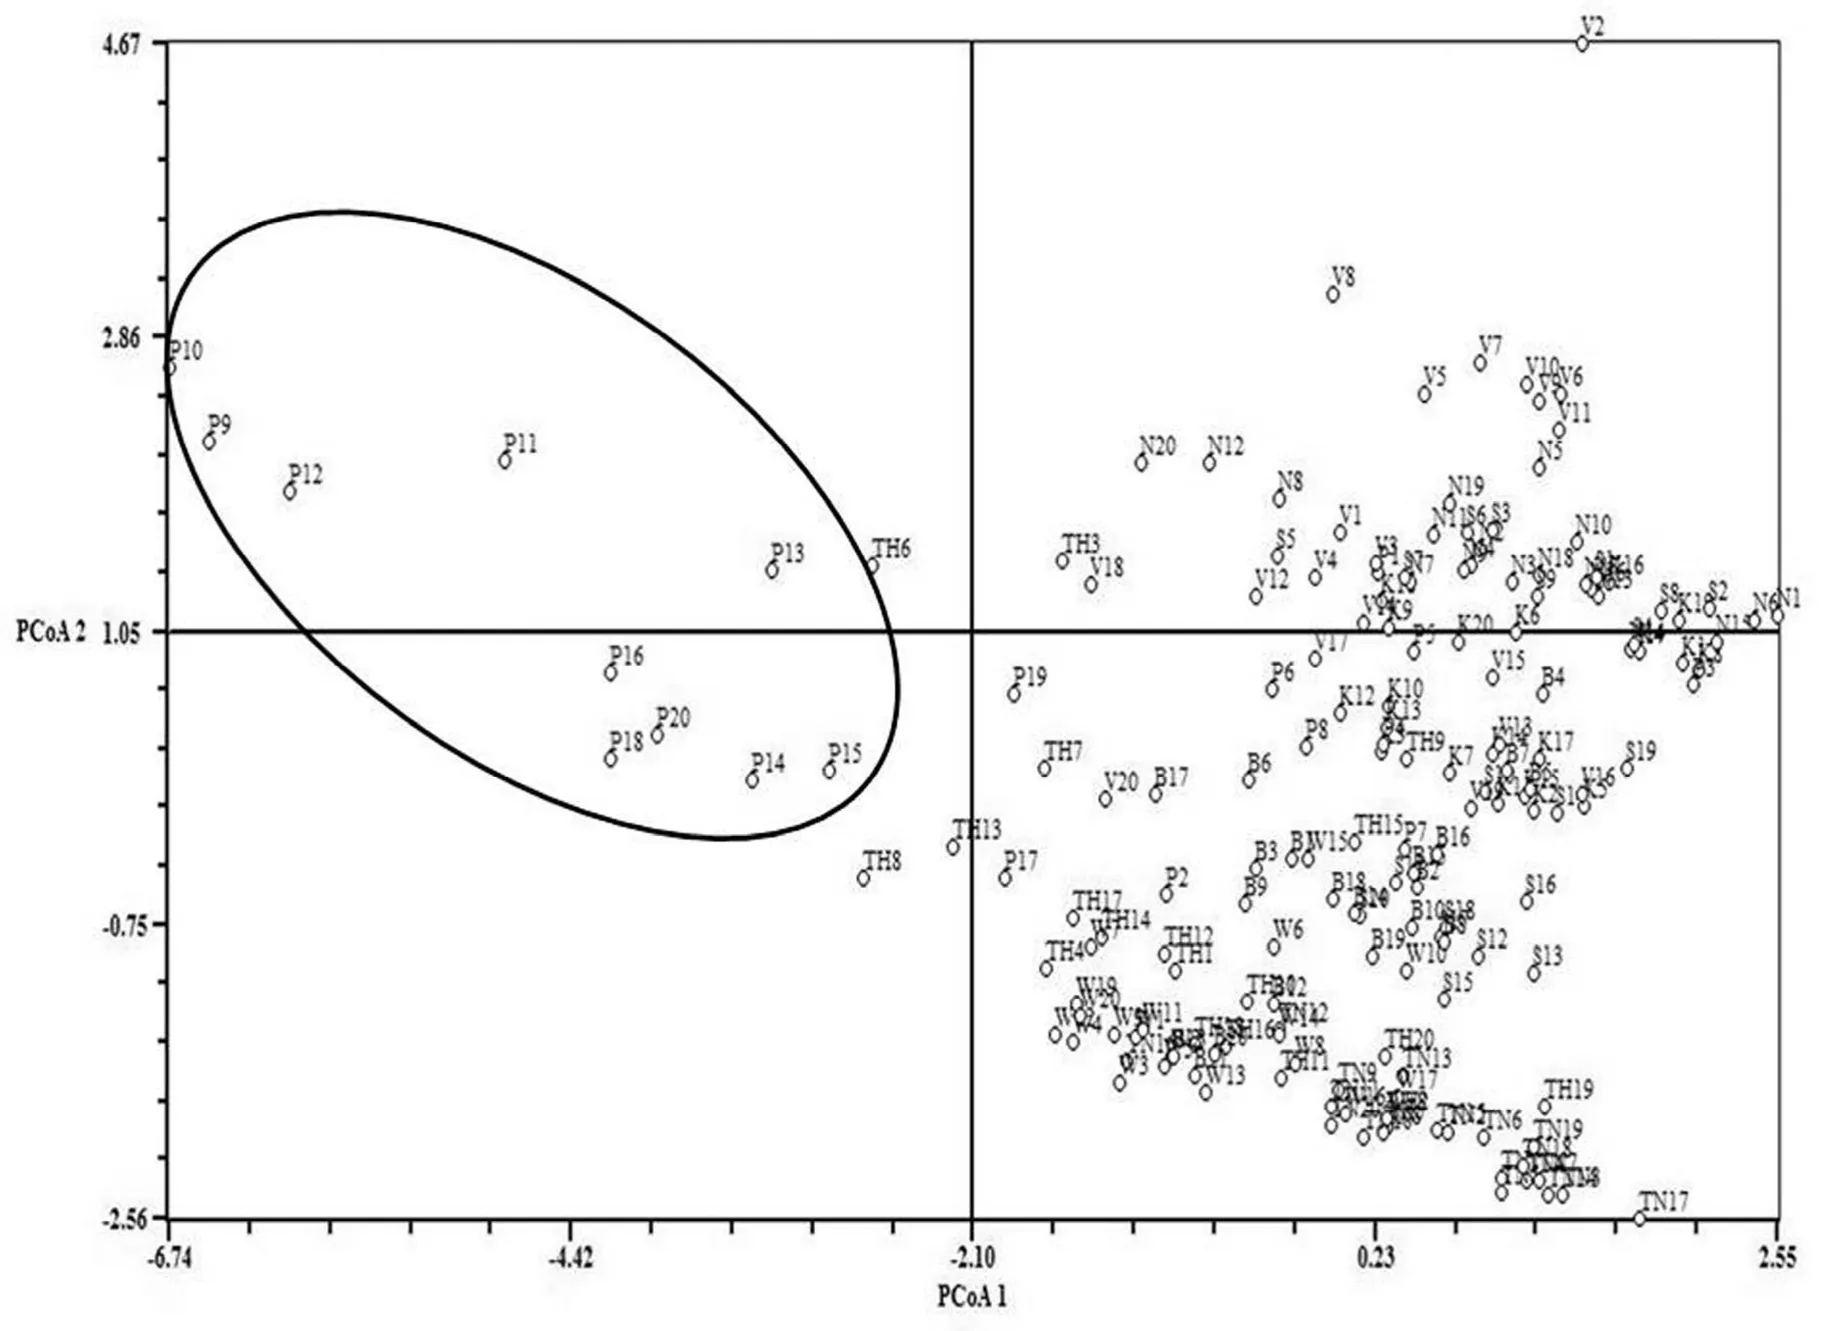
Fig. 3: Principal coordinate analysis (PCoA) of 180 genotypes using eight morphological characters.
AFLP analysis
The standard genetic distance (D) unbiased for the sample size (Nei 1978) for all pair wise population comparisons were provided in the Table 4 and the data were used to test the correlation between genetic data and morphological data.
Mantel Test
The mantel test did not reveal any correlation between Euclidean distance of overall morphological characters and AFLP genetic distance data (r =-0.1463; p =0.1740). The Mantel's test of pair wise correlation between Euclidean distance of individual morphological characters and genetic distance of AFLP data revealed that two morphological characters i.e. petiole character (r =0.2688; p =0.0460) and height of tree (r =0.2002; p =0.0010) were significantly correlated to AFLP data matrix. The test of correlation between genetic and geographic distance matrices also revealed a significant positive correlation (r =0.4748; p =0.0090) (Table 5).
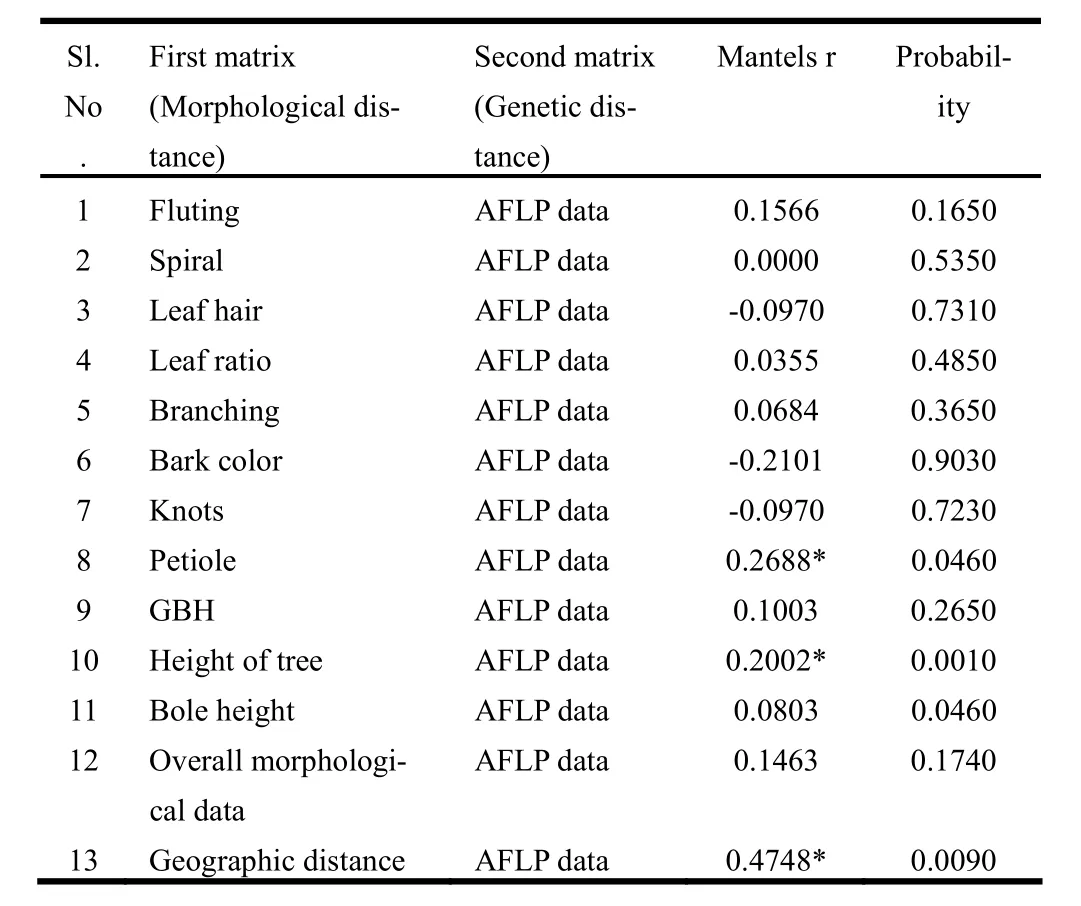
Table 5: Mantel’s Correlation between distance value based on pair wise morphological features and the corresponding pair wise genetic distance value.
Discussion
AFLP analysis was applied to reveal patterns of genetic variation in teak. The comparison between phenotypic and genotypic data depicted a low correlation. The nine populations used in this study covered a wide geographic range in latitudes and geographical distances. The multivariate analyses of morphological data clearly indicated that populations from the neighboring localities did not show any tendency to group together (Fig. 2 and 3). The PCoA analysis supported the observation that the selected morphological characters scattered along 2D-scatter plot without a phenetic gap between each individual population. The detailed analysis of individual characters revealed that there is no clear distinction between nine populations based on quantitative and qualitative morphological characters analysed. A few of the Para individuals from Parambikulam Wildlife Sanctuary clustered together in one axis because of higher GBH which ranged from 2400 cm to 6520 cm. The discrimination among population variables might be strongly controlled by abiotic factors. In Baobab (Adansonia digitata) populations across different climatic zones of Benin (West Africa), Assogbadgo et al. (2006) observed significant correlation of morphometric characters with abiotic factors of the environment.
The correlation between genetic distances and morphological characters revealed positive correlation of petiole shape and height of tree with AFLP data (Table 5). Mantel’s test of significance further gave an additional support and revealed that the two characters were significantly correlated with that of genotypic data. Similar result was obtained in an AFLP marker study on genetic variation in a teak clonal seed orchard comprising 1200 trees of 31 clones established in Southern Kerala in 1985 (Sreekanth and Balasundaran, 2012). Mantel's test did not reveal any correlation between overall morphology and genetic distance. The results of the Mantel’s test indicated that the genetic variation detected by AFLP is not reflected in quantitative and qualitative morphological characters measured. Ehara et al. (2002) performed RAPD analysis of 38 accessions of Metroxylon sagu from Malay Archipelago and found that none of the morphological variables were useful in identification of specific genotypes. In the present study, the lack of correlation between genetic data and morphological variables was clearly indicated in the dendrogram and PCoA.
One of the aims of the study was to find AFLP markers that are significantly more likely to co-occur with a morphological trait than expected by chance, that is, a marker that has a statistically significant association with the phenotypic trait. Ideally, we could not specifically reveal unique AFLP bands related to the phenotypic variables such as height of tree and petiole shape existed. Additional experiments such as QTL mapping studies are needed to identify specific genes or genome regions that might have direct influence on the observed morphometric variation.
The nine populations in this study covered a wide geographical area. The most genetically similar populations were Virn and Barc and they were geographically very close by location, while the genetically distant populations of Barc of Karnataka State and Tami of Tamil Nadu State were far separated. The geographical and genetic distances were positively correlated (r =0.4748; p =0.0090). Mantel's test of significance also proved a significant relation between geographic and genetic distance showing genetic divergence between distant populations. This significant correlation indicated that long distance dispersal of seeds had been rare. This was well supported by the UPGMA dendrogram and PCoA analysis (Sreekanth et al. 2012).
The morphological clustering showed no geographical structure. On the other hand, the molecular analysis showed that the genetic structure was related to the sample collection site. The lack of perfect congruence between morphological and molecular data suggested that the morphological system might be useful for the morphotype management but was not appropriate to study the genetic structure of the teak population. The spatial structure of the genetic diversity may be related to the evolution of the species and the discordance between the morphological and molecular structures might have resulted from similar selection pressures at different places leading to similar forms with a different genetic background.
Conclusions
In a previous study of nine natural teak populations of the Western Ghats of South India strong association between genotype of natural teak populations and their respective geographic origin has been reported through AFLP marker study (Sreekanth et al. 2012). About 75% of the total genetic diversity occurred within populations while only 25 % of the diversity was present among populations. The present study showed very little relation between morphological variations and geographic distances be-tween populations. Moreover, variation between populations in respect of most of the economically important phenotypical characters is not supported by genetic diversity revealed through AFLP markers. These findings show that ecological factors such as altitude, rainfall, soil characters, etc. also play a major role in phenotype of teak trees. Teak is a cross pollinated tree species; bole height, log size, tree form, wood colour, etc. are some of the economically important characters of teak trees. Hence, it can be concluded that for tree improvement of teak through phenotypic selection process, the number of plus trees selected from a population should be sufficiently large in order to exploit the large intra-population genetic variation. The results of these studies further emphasize the importance of progeny trial in teak tree improvement.
Acknowledgements
The authors acknowledge the financial support provided by the Department of Biotechnology, Government of India (S.O. No. BT/PR/2302/AGR/08/161/2000). We are thankful to the Forest Departments of Kerala, Karnataka and Tamil Nadu for giving permission for the collection of leaf materials.
Assogbadjo AE, Kyndt T, Sinsin B, Gheysen G, Van damme P. 2006. Patterns of genetic and morphometric diversity in Baobab (Adansonia digitata) populations across different climatic zones of Benin (West Africa). Ann Botany, 97: 819−830.
Bagchi SK. 1999. Correlation of age element in Tectona grandis Linn. f. Indian For, 125: 522−525.
Bedell PE. 1989. Preliminary observations on the variability of teak in India. Indian For, 115: 72−73.
Dilip Kumar PJ. 2005. Teak in Karnataka state, India. In: K.M. Bhat, K.K.N. Nair, K. V Bhat E. M. Muralidharan Sharma J.K. (eds), Quality timber products of teak from sustainable forest management. Kerala Forest Research Institute, India and International Tropical Timber Organization, Yokohama, pp 45–46.
Doyle JJ, Doyle J. 1990. Isolation of plant DNA from fresh tissue. Focus, 12:13–15.
Ehara H, Kosaka S, Shimura N, Matoyoma D, Morita O, Mizota C, Naito H, Susanto S, Bintoro MH, Yamamoto Y. 2002. Genetic variation of sago palm (Metroxylon sagu Rottb.) in the Malay Archipelago. In: K. Kainuma, M. Okazaki Y, Toyada Y and Cecil J.E. (eds), New frontiers of sago palm studies. Tokyo: Universal Academy Press, pp. 93−100.
Gunaga RP, Vasudevan R. 2003. Genetic variation for fruiting phenology in teak clones among provenances of Karnataka (Tectona grandis L.f). Indian J Fores, 25: 215−220.
Hush B, Miller CI, Beers TW. 1972. Forest Mensuration. New York: The Ronald Press Company.
Kala JC, Kumaravelu G, Krishnakumar N. 2005. Status report of teak in Tamil Nadu, India. In: K.M. Bhat, K.K.N. Nair, K. V Bhat E. M. Muralidharan Sharma J.K. (eds), Quality timber products of teak from sustainable forest management. Kerala Forest Research Institute, India and International Tropical Timber Organization, Yokohama, pp. 47–53.
Kaosa-ard A. 1993. Teak international provenance trials I. Growth and stem quality. In Proceedings "50th Year of Huay Tak Teak Plantation: Teak Seminar", pp 113−129.
Katwal RPS. 2005. Teak in India: status prospects and perspectives. In: K.M. Bhat, K.K.N. Nair, K. V Bhat E. M. Muralidharan Sharma J.K. (eds), Quality timber products of teak from sustainable forest management. Kerala Forest Research Institute, India and International Tropical Timber Organization, Yokohama, pp 1–17.
Keiding H, Wellendorf H, Lauridsen EB.1986. Evaluation of an international teak provenance trials. Danida Forest Seed Centre, p.81.
Kjaer A, Barfod AS, Asmussen CB, Seberg O. 2002. Genetic and morphological variation in the sago palm Metroxylon sagu Rottb. (Arecaceae) in Papua New Guinea. In: K. Okazaki M. Toyada and Cecil J. E. (eds), New frontiers of sago palm studies. Tokyo: Universal Academy Press, pp. 100−101.
Kjaer ED, Seigismund HR, Suangtho V.1996. A multivariate study on genetic variation of teak (Tectona grandis. L.). Silvae Genet, 45: 361−368.
Kumar A, Gogate, M.G, Sharma R, Mandal, AK 1997. Genetic evaluation of teak clones of Allapali region, Maharashtra. Indian For, 123: 187−189
Mantel NA.1967. The detection of disease clustering and a generalized regression approach. Cancer Res, 27: 209–220.
Mathew J. 2001. Variation for germination and early seedling vigour among Half Sib Families of Teak ( Tectona grandis L.f.) Clones of Karnataka. M.Sc. thesis, College of Forestry, University of Agricultural Sciences, Sirsi, Karnataka, p 102.
Mathew J, Vasudeva R. 2005. Clonal variation for seed germination in teak (Tectona grandis L.f.). Curr Sci, 84: 1133−1136.
Miller MP. 1997. A Windows program for the analysis of allozyme and molecular population genetic data (TFPGA). Department of Biological Sciences Northern Arizona University Flagstaff USA.
Nei M.1978. Estimation of average heterozygosity and genetic distance from a small number of individuals. Genetics, 89: 583–590.
Peakall R, Smouse, PE. 2006. GENALEX 6: genetic analysis in Excel. Population genetic software for teaching and research. Mol Ecol Notes, 6: 288–295.
Prabhu NH. 2005. Teak in Kerala: past present and future. In: K.M. Bhat, K.K.N. Nair, K. V Bhat E. M. Muralidharan Sharma J.K. (eds), Quality timber products of teak from sustainable forest management. Kerala Forest Research Institute, India and International Tropical Timber Organization, Yokohama, pp. 83–92.
Rolf J. 2000. NTSYS-pc, Numerical Taxonomy and Multivariate Analysis System, Version.2.1 Exeter, New York
Sneath PHA, Sokal, RR. 1973. Numerical taxonomy. W.H. Freeman San Francisco California.
Sreekanth PM, Balasundaran M, Nazeem PA, Suma TB. 2012. Genetic diversity of nine natural Tectona grandis Lf populations of the Western Ghats in Southern India. Conserv Genet, 13: 1409−1419.
Sreekanth PM, Balasundaran M. 2012. AFLP diversity of teak clonal seed orchard. Indian J Genet Plant Breed, 4: 484−487.
Sreekumar VB, Binoy AM, Sarah, TG. 2007. Genetic and morphological variation in breadfruit (Artocarpus altilis (Park.) Fosberg) in the Western Ghats of India using AFLP. Genet Resour Crop Ev, 54: 1659−1665.
Sreekumar VB, Renuka, C, Suma TB, Balasundaran, M. 2006. Taxonomic reconsideration of Calamus rivalis Thw. ex Trim. and C. metzianus Schlecht (Arecaceae) through morphometric and molecular analyses. Bot Stud, 47: 443−452.
Suri, SK.1984. Analytical study of teak provenance tests in North Raipurdivision of Madhya Pradesh. Indian For, 110: 345−363.
Vasudeva R, Gunaga RP, Hanumantha M. 2001. Implication of variation in reproductive traits among teak clones to management and genetics of seed orchards. Advances in Forestry Research, 24: 120−135.
Vos P, Hogers R, Bleeker M, Reijans M, Vande Lee T, Hornes M, Frijters A, Pot J, Peleman J, Kuiper M, Zabeau M. 1995. AFLP: a new technique for DNA fingerprinting. Nucleic Acids Res, 23: 4407–4414.
Wellendorf H Kaosa-ard A. 1988. Teak improvement strategy in Thailand. Forest Tree Improvement No.21 p.43.
DOI 10.1007/s11676-014-0528-0
Project founding: This work was financially supported by the Department of Biotechnology, Government of India (S.O. No. BT/PR/2302/AGR/08/161/2000).
The online version is available at http://www.springerlink.com
Biotechnology and Applied Genetics, Bangalore City College New Campus, Kalyan Nagar, Banaswadi Outer Ring Road, Bangalore 560043, India. Tel.: +91 – 80-25459946; Fax: +91 –80-25459958
Email: sreekanthpm@gmail.com
M. Balasundaran
Environmental Biotechnology, Tropical Institute of Ecological Sciences, Velloor P.O, Kottayam – 686501, Kerala, India.
P.A. Nazeem
Centre for Plant Biotechnology and Molecular Biology, Kerala Agricultural University, KAU Campus P.O, Thrissur 680656, Kerala, India Corresponding editor: Chai Ruihai
杂志排行

Journal of Forestry Research的其它文章
- Growth and yield of two grain crops on sites former covered with eucalypt plantations in Koga Watershed, northwestern Ethiopia
- Carbon stock in Korean larch plantations along a chronosequence in the Lesser Khingan Mountains, China
- Biomass accumulation and nutrient uptake of 16 riparian woody plant species in Northeast China
- Cloning and sequence analysis of nine novel MYB genes in Taxodiaceae plants
- Improved salt tolerance of Populus davidiana × P. bolleana overexpressed LEA from Tamarix androssowii
- Growth performance of Avicennia officinalis L. and the effect of spacing on growth and yield of trees planted in the Western coastal belt of Bangladesh