Icon memory research under different time pressures and icon quantities based on event-related potential
2014-09-06NiuYafengXueChengqiLiXuesongLiJingWangHaiyanJinTao
Niu Yafeng Xue Chengqi Li Xuesong Li Jing Wang Haiyan Jin Tao
(1School of Mechanical Engineering, Southeast University, Nanjing 211189, China)(2Key Laboratory of Child Development and Learning Science of Ministry of Education, Southeast University, Nanjing 210096, China)
Icon memory research under different time pressures and icon quantities based on event-related potential
Niu Yafeng1Xue Chengqi1Li Xuesong2Li Jing1Wang Haiyan1Jin Tao1
(1School of Mechanical Engineering, Southeast University, Nanjing 211189, China)(2Key Laboratory of Child Development and Learning Science of Ministry of Education, Southeast University, Nanjing 210096, China)
In order to obtain related brain electrical components and neural bases of physiology assessment of icon elements in a digital human-computer interface, the modified sample-delay matching task experimental paradigm is used under different time pressures (4 000 and 2 000 ms) and different icon quantities (three, five and ten icons) on icon memory based on event-related potential (ERP) technology. Experimental results demonstrate that P300 has significant volatility changes and the maximum amplitude around the middle line of the parietal area (PZ) and P200 has obvious volatility changes around the middle line of the frontal and central area (FCZ) during icon cognition. P300 and P200 amplitudes increase as tasks become more difficult. Thus, P300 latency is positively correlated with task difficulty. ERP research on the characteristics of icon memory will be an important reference standard in guiding user neurocognitive behavior and physiology assessment on interface usability.
time pressure; icon quantity; event-related potential (ERP); P200; P300
With the wide application of computer and information technologies in the digital human-computer interface (DHCI), the computer digital interface has increasingly replaced traditional man-machine hardware interfaces and becomes a main carrier of complex systems and human-computer interaction systems. As a key component of the DHCI, icons have become a bridge connecting users and human-computer interactions of complex systems. As information sources for computer digital interfaces in complex systems become more and more informative, information structural relations become more complicated. In this line, icons can simultaneously improve cognitive efficiency and operating performance in task execution. Batch repetitive operation, information overlap, processing and memory load for numerous icons have brought about a sharp increase in memory load, which has led to misuse and human error. Moreover, the interface is an important component of the user experience, eliciting a purely subjective feeling while using a product.
Event-related potential (ERP) means brain electrical activity and it is an important methodology in cognitive neuroscience research, since it has high time resolution, good reliability and validity and can realize synchronization lock between EEG and experimental task operation. Indicators such as the amplitude, latency, potential and spatial frequency of the electric current of ERP can provide information on working brain processes. This, in turn, directly reflects the electrical activity of nerves and builds mapping and corresponding relationship among operational tasks, brain electrical signals and functional regions. ERP technique application in the DHCI is to seek the DHCI research methods of human endogenous law. Using real-time tracking and brain electrical signal analysis during interface cognition, we can examine the detailed cognitive rules of visual information for different interfaces, and build a visual information evaluation method and design specifications.
ERP research on icon memory can examine user brain electrical activity in their local interface experience. Using the ERP physiological assessment method, we can obtain the usability and reliability of icons in the interface by electrical indicators. This will be an essential part of interface evaluation, providing corrections and improvements for late-stage icon design. We obtain the brain electrical basis of the user’s icon memory, which is a positive interdisciplinary contribution to both human-machine interactive areas and cognitive neuroscience. Previous icon research is mainly based on icon usage[1], icon visual features[2], computer icon design[3], user age[4], tactile icon technology[5]and a special case study of emergency medical information system icons[6]. Since these studies are based on behavioural and not physiological user data, the purpose of this study is to investigate the neural mechanism of icon memory.
In cognitive load and working memory of visual information processing, researchers have conducted the following studies: the relationship between reaction time (RT) and prompt forms[7]; colour, direction and movement distribution in attention systems[8]; length and interference influence in working memory stores[9]; cognitive function disorders[10]; ERPs in spatial working memory tasks[11]; test time selection of memory process in working memory[12]; and fERN under high load[13].
In P300 ERP research, some scholars have investigated P300 in air traffic control systems[14], electrophysiological evidence of dual task interference by the use of P300 latency[15], P300 amplitude[16]and P300a and P300b[17]. In P200 ERP research, studies are conducted on P200 in visual search experiments[18], P200b in related task processing[19]and P200 in early semantic processing of visual information[20].
Main task measurement[21]is adopted in this study, in which icon quantities and time pressures are control conditions under the same task component type and complexity. The experimental paradigm used in this study is the modified sample-delayed matching task paradigm based on the experimental working memory paradigm[22-23], which contains the following three stages: stimulus presentation, learning and memorization, and judgment and reaction.
1 Experimental Procedures
1.1 Participants
Participants consist of 20 students (10 males and 10 females) with different majors from Southeast University, including 6 undergraduates, 10 graduates and 4 doctors, with a high proficiency with computer systems or digital interfaces. The participants are between 20 and 28 years of age (mean=24 years), and they are right-handed. They have normal or corrected visual acuity and have no history of mental illness or brain trauma. The study protocol is approved by the Southeast University Ethics Committee.
1.2 Tasks and procedures
Each participant put on an electrode cap and sat in a comfortable chair in a soft light and soundproofed room, and eyes gazed at the center of the screen. A 17-inch CRT monitor with a 1 024×768 pixel resolution was used in the experiment. The distance between participant eyes and the screen was approximately 100 cm, while the horizontal and vertical picture viewing angle was within 2.3°[24].
Fig.1 is the schematic of the experimental flow. In order to make participants familiar with the task, practice is carried out before the experiment. The first step, the continuous different icon quantities (first 3, then 5, at last 10.) under different times (first 4000 ms, then 2000 ms.) are shown to the participants who need to remember the characteristics of these icons. The second step, a sample icon is present randomly to the participants who recall whether the sample icon has appeared before. The third step, participants make judgments and reactions after the emergence of the blank screen and respond by pressing the “A” key if the icon has appeared and the “L” key if not. The last step, participants are asked to fixate on a black cross in the center of a CRT screen for 1 000 ms, and then the next round task starts.

Fig.1 Modified sample-delayed matching task paradigm
In this experiment, the stimulus variable is set icons, with each icon uniformly applied most commonly as 48×48 pixel. Icons with identical style and size and no colour from different areas are selected to exclude interference from other factors. Icon quantities[25](three, five and ten icons) and time pressures (2 000 and 4 000 ms) are used in this study. There are six changes between the variables and 60 superposition times for each level to ensure experimental reliability.
1.3 EEG recording
Stimuli are presented using E-prime1.1 software. Neuroscan SynamP2 amplifier (Scan 4.3.1, Neurosoft Labs, Inc.) continuously records EEG (0.05 to 100 Hz band-pass; 500 Hz/channel sampling rate) using an electrode cap with a 64 Ag/AgCl electrode based on the extended international 10-20 system. A reference electrode is placed in the binaural protrusions. The ground electrode is located at the midpoint between FZ and FPZ. Electrode impedance is maintained below 5 kΩ throughout the experiment.
1.4 Data analysis
EEG recording started from a white screen with a time segment from -100 to 600 ms, causing EEG artifact/fragment rejection when volatility was greater than 80 μV. Epoch depended on the variable type (time pressures: 2 000 and 4 000 ms; icon quantities: three, five and ten icons); each of which needed superposition and were averaged separately. Next, the EEG needed a 30-Hz low-pass filter (48 dB/octave). For subject data analysis, repeated measures by ANOVA and paired-sample t-tests were used, and the significance level was set to be 0.05.
2 Results
2.1 Behavioural data analysis
Behavioural data, including icon memory recognition accuracy rate (ACC) and reaction time (RT), are recorded in accordance with key answers provided by the participants. ACC refers to the ratio between the number of correctly recognized icons and the total number of icons used. Non-reaction test data is not included in the calculation. RT refers to the period between seeing the target stimulus and identification (pressing “A” or “L”), which is based on the shortest icon memory discrimination recognition time and indicates the differences between cognitive memory processing and learning recognition.
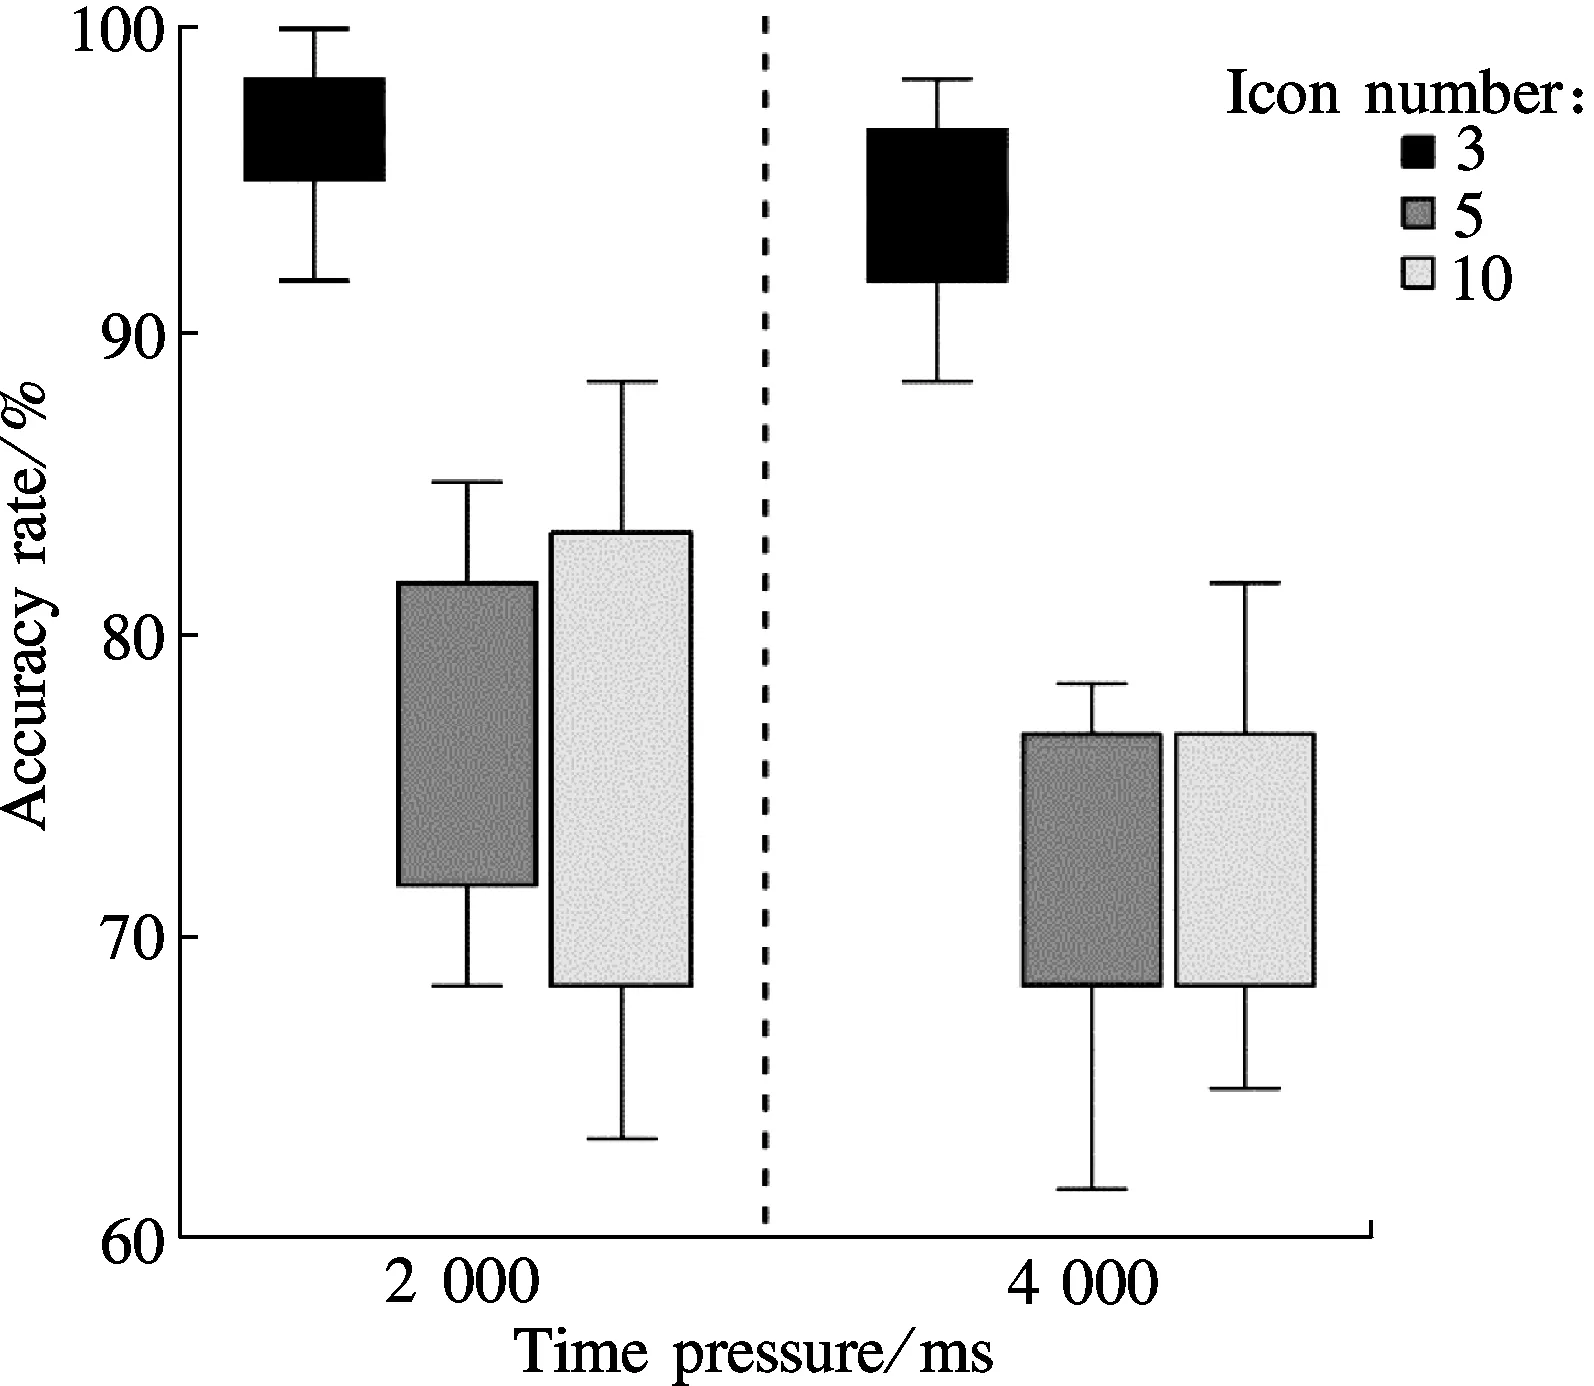
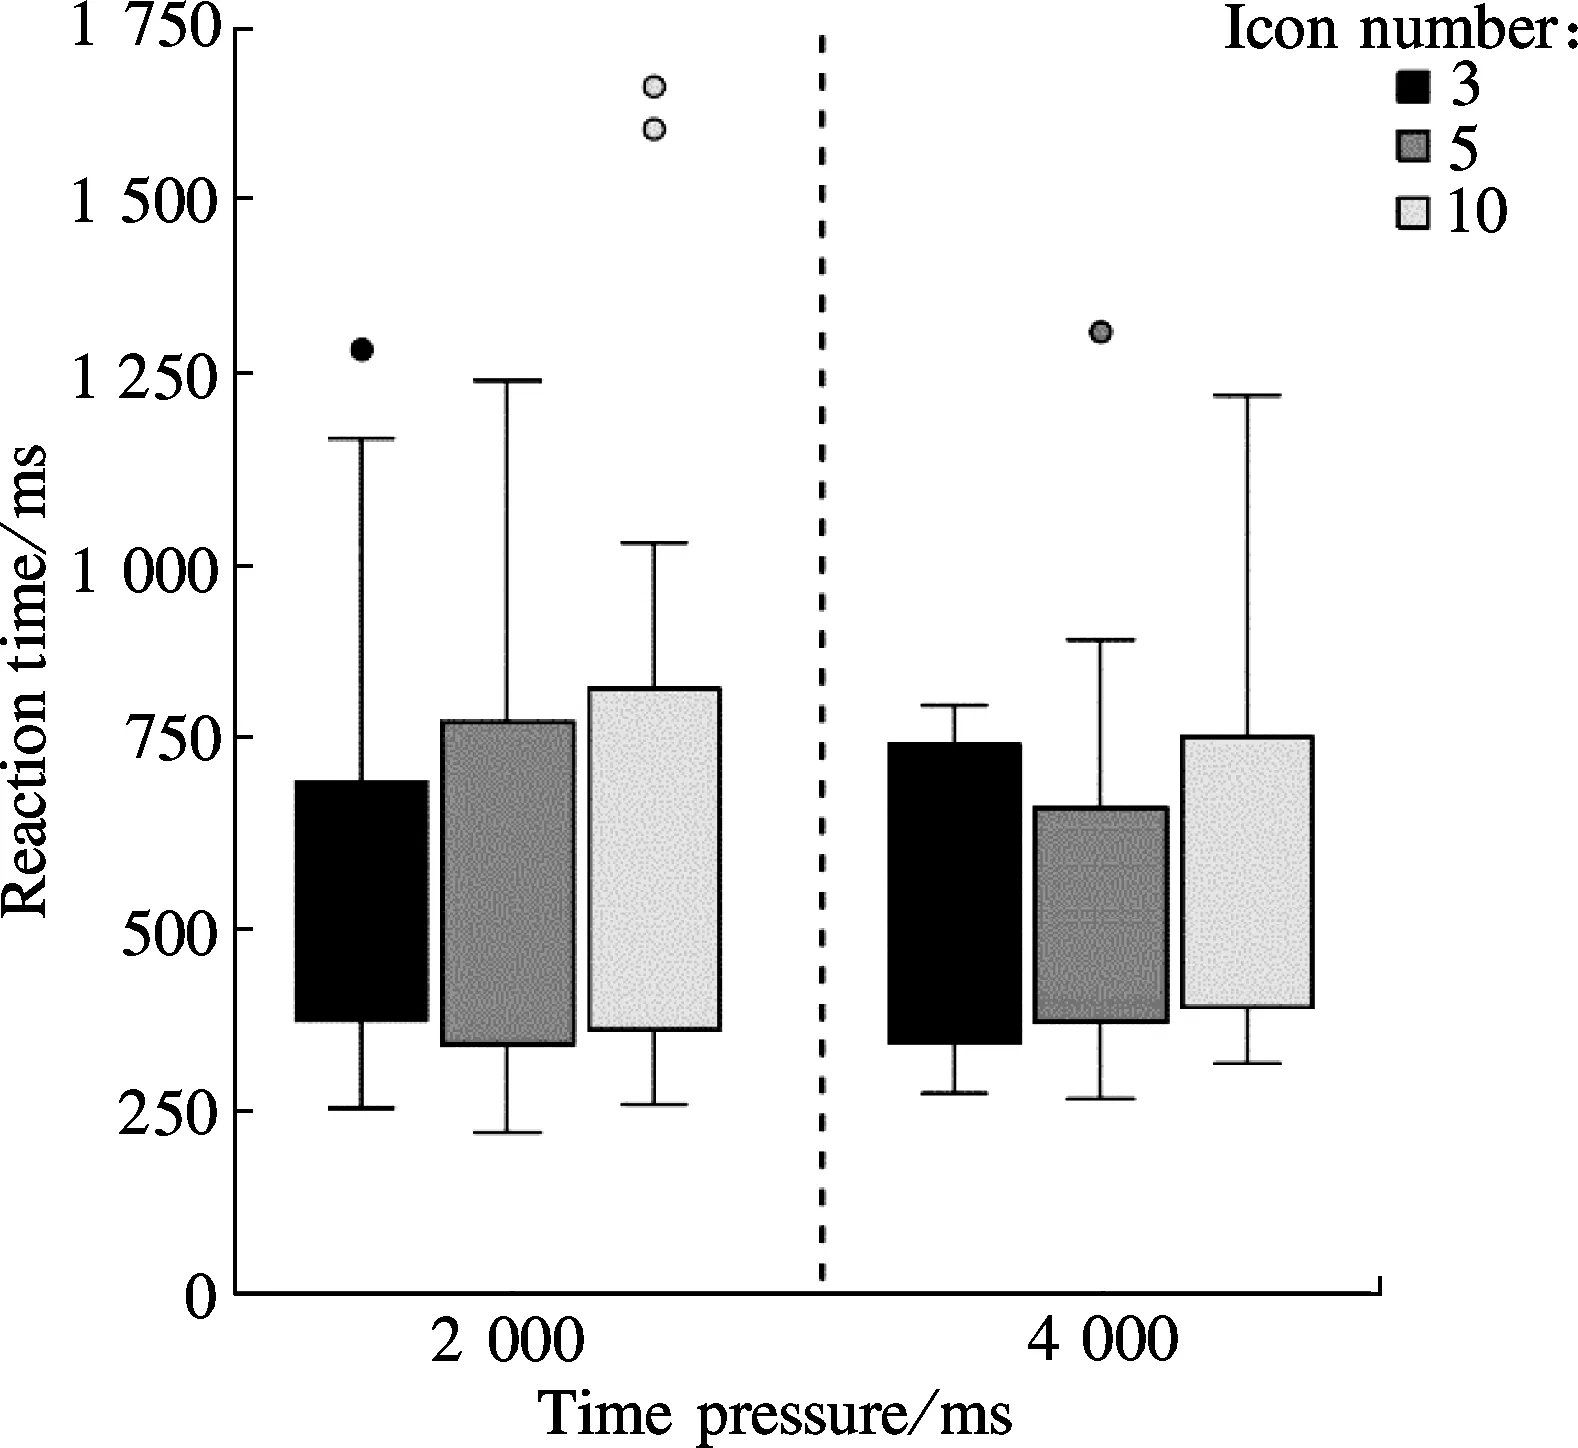
For the same number of icons, the average deviation and standard deviation (SD) of the ACC and RT under 4 000 ms are lower and faster, respectively, than those under 2 000 ms (see Fig.2). The size order of the ACC to different icon quantities under 4 000 and 2 000 ms is 3>10>5 and 3>5>10 icons, respectively, and the SD order is 10>5>3 icons under both 4 000 and 2 000 ms. The size order of RT to different icon quantities under 4 000 and 2 000 ms is 5>10>3 and 10>3>5 icons, respectively, and the SD order is 5>10>3 and 10>5>3 icons, respectively.
(a)
(b)
Fig.2 Box plot. (a) Accuracy rate under different conditions; (b) Reaction time under different conditions
The ACC and RT data are analyzed using paired-sample t-tests and results are as follows: 1) The mean ACC has significant differences for three (p=0.028 3) and five icons (p=0.000 5) between 2 000 and 4 000 ms. The mean RT shows significant differences for three (p=0.004 8) and ten icons (p=0.020 2) between 2 000 and 4 000 ms. 2) The mean ACC shows significant differences under 4 000 (p=0.000 0) and 2 000 ms (p=0.000 0) between three and five icons. Significant differences between three and ten icons under 4 000 ms (p=0.000 0) are also found.
2.2 Brain electrical data analysis
We selected six electrodes in the prefrontal cortex, including F3, FZ, F4, FC3, FCZ and FC4 and seven electrodes in the parietal-occipital-temporal association cortex, including the left P3, PO3 midline of CPZ, PZ, POZ, and the right side P4 and PO4.
Based on ERP components related to numerous studies on working and short-term memory in the prefrontal and parietal-occipital-temporal association cortex[26-32], P200 and P300 are especially important for icon memory. The peak latency of the P300 ERP component is approximately 300 to 600 ms.
P300 indicates neuronal activity in the cognitive process. Numerous studies have shown that P300 is reflected by elements such as subjective probability, stimulus importance, decision making, decision-making confidence, stimulus uncertainty, attention, memory, emotion and other factors.
P200 usually appears as a significantly positive component after N1 in the fronto-central cortex, where the latency is approximately 200 ms, which is related to the early identification of target stimuli and reflects task-related processing.
2.2.1 P300 analysis
The EEG analysis under different icon quantities is as follows. Repeated ANOVA of mean amplitudes for 300 to 500 ms in 2 (i.e., different time pressures: 4 000 and 2 000 ms)×7 (i.e., seven selected electrodes: PO4, P4, POZ, PZ, CPZ, PO3 and P3), and 3 (i.e., the number of icon quantities: three, five and ten)×7 (i.e. seven selected electrodes: PO4, P4, POZ, PZ, CPZ, PO3 and P3) were conducted. ANOVA showed that mean amplitudes at 300 to 500 ms had significant differences neither between time pressures and electrodes nor between icon quantities and electrodes. Furthermore, there were no interactions not only between time pressures and electrodes but also between icon quantities and electrodes, since allpvalues were less than 0.05.
Therefore, the ANOVAs of mean amplitudes in both time pressures and the three brain regions (left, middle and right) with different icon quantities were conducted, wherein the seven electrodes were divided into right (PO4, P4), middle (POZ, PZ and CPZ) and left sides (PO3, P3). ANOVA results showed that the mean amplitudes of brain areas all had main effect significances in different icon quantities (three icons:F(4,16)=4.664,p=0.045; five icons:F(4,16)=8.185,p=0.012; ten icons:F(4,16)=13.940,p=0.002). Paired-sample t-tests of mean amplitudes among the right, middle and left sides with different icon quantities were performed separately; if there were significant differences in any region, further t-tests of the mean electrode amplitude included in each region were conducted to determine electrodes with significant differences under both time pressures. Results show that the mean amplitude of PZ has significant differences (p=0.018) in the maximum amplitude between 4 000 (M=1.364 2) and 2 000 ms (M=2.281 4) with three icons.
Using the same method as above, the EEG analysis shows that the mean amplitude of all the electrodes except PZ does not have significant differences among different icon quantities under both time pressures. According to the above P300 results, the central zone of the parietal cortex presents obvious positive voltage under 2 000 ms compared with that under 4 000 ms; therefore, the PZ potential in the parietal cortex is of utmost concern with three icons under different time pressures. With three icons, the PZ electrode has an obvious P300 late component during the 300 to 500 ms time period under 4 000 and 2 000 ms. The wave peak of 2 000 ms is larger than that of 4 000 ms, consistent with the aforementioned average statistical analysis, revealing that subjects require more psychological and cognitive resources and endure heavy memory load under 2 000 ms (see Fig.3). The P300 amplitude at 2 000 ms is larger than that at 4 000 ms, which is also in accord with previous studies of the dual task experiment in which amplitude is positively correlated with psychological resources[22]. P300 latency under 2 000 ms is longer than that under 4 000 ms, which is also in accord with Kutas’s conclusion[33]which states that P300 latency is positively correlated with task difficulty.
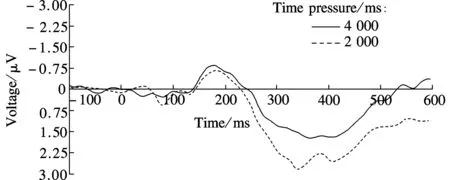
Fig.3 PZ electrode potential oscillogram of three icons under 2 000 and 4 000 ms
2.2.2 P200 analysis
The P200 component analysis procedure is similar to that of P300. Compared to P300, the differences of P200 component analyses are the selected electrodes (FC4, F4, FCZ, FZ, F3 and FC3) and the time period (100 to 300 ms). Results show that under the five-icon condition, the mean FCZ electrode amplitude under 2 000 ms (M=0.439 3) is significantly higher (p=0.0256) than that of 4000 ms (M=0.2319) in the middle region. Moreover, the FCZ electrode in the prefrontal central region is the key factor with five icons under different time pressures. Using five icons, the FCZ electrode has an obvious P200 component during the 100 to 300 ms period under 4 000 and 2 000 ms time pressures, and the latency of P200 under 2 000 ms is posterior to that under 4 000 ms (see Fig.4). The difficulty of early task identification and P200 latency may have a positive correlation. Additionally, N1 also appears in the fronto-central cortex prior to P200, in accord with the conclusion obtained previously by Potts et al[19].
The peak potentials of P300 and P200 are distributed in the parietal and prefrontal central cortices; the P300 for three icons under 2 000 ms (peak value: 2.850 μV, 342 ms) is more remarkable than that under 4 000 ms (peak value: 1.746 μV, 364 ms) in the parietal cortex, while the P200 for five icons under 2 000 ms (peak value: 1.504 μV, 228 ms) is more notable than that under 4 000 ms (peak value: 0.839 μV, 225 ms) in the prefrontal cortex (see Fig.5).
3 Discussion
P300 amplitude is used as an indicator of information processing capacity, revealing event stimulus classification network activities that are jointly regulated by attention and working memory[16]. Our study also proves that the memory capacity is related to P300 amplitude, which needs further elucidation with respect to icon memory and recall. Previous studies concluded and summarized on P300a and P300b, wherein P300b was found to be reflected in the parietal cortex, which might be related to attention and memory mechanisms of top-down driven tasks[17]. Overall, we find that the heavier the task load, the larger the P300 amplitude of PZ. This is consistent with previous findings on working memory[33].
With regard to P200, a previous study[20]found that P200 latency might be associated with early semantic processing of visual information. In FCZ potential, we can
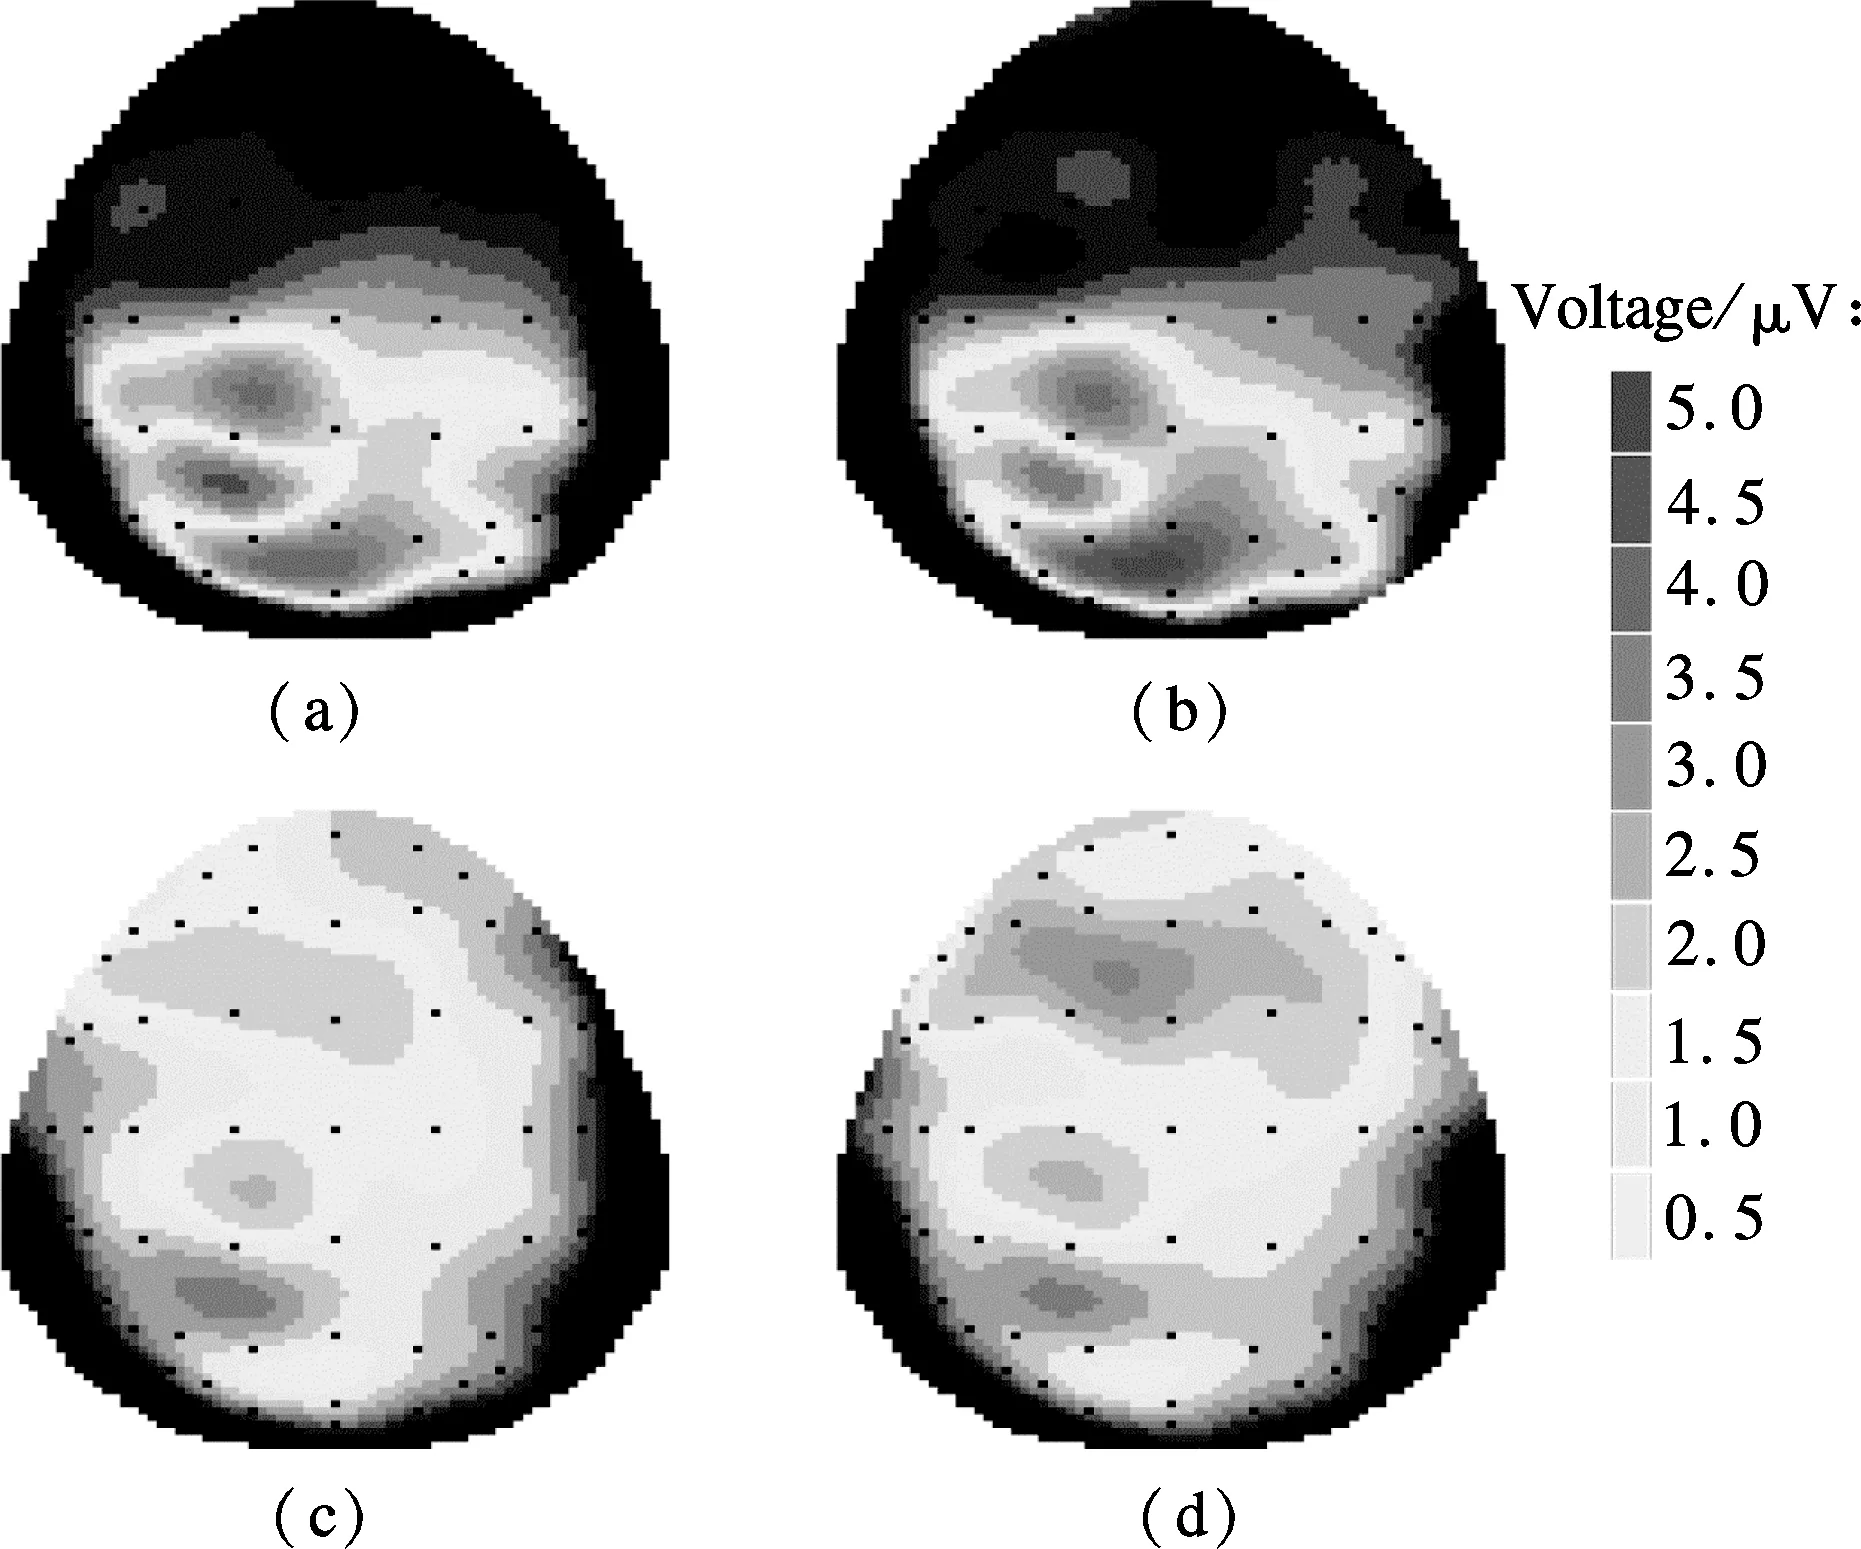
Fig.5 Topographic maps of maximum amplitudes of P300 at PZ and P200 at FCZ. (a) P300: 3 icons×4 000 ms (364 ms); (b) P300: 3 icons×2 000 ms (342 ms); (c) P200: 5 icons×4 000 ms (225 ms);(d) P200: 5 icons×4 000 ms (228 ms)
find an obvious N400 which was originally discovered in a semantic experiment in which sentences had incongruent endings[34]. After the experiment, we conduct a survey and find that 76% of participants translated the image codes into literal codes in order to finish the task. The N400 component in our study might have been evoked by multiple dimensional conflicts of icon quantities and time pressures, as well as icon semantic transition including image and literal codes. Focus analysis on FCZ of the fronto-central cortex found the emergence of N100 preceding the appearance of P200. This conclusion is consistent with a previous report on presentation law in the early visual recognition component[19].
One previous study[25]found that short-term memory span was (7±2) chunks and short-term memory capacity was approximately 7 chunks. Compared with the icon quantities in our study, only three and five icons under different time pressures had significant ERP differences in different brain areas. However, there were no differences in ERP when ten icons appeared. This phenomenon might be caused by icon overload, although the reason behind selecting ten icons was based on the complexity of the interface element in a complex system. Biederman’s object identification theory[35]showed that object identification depended on the object’s edge rather than surface information, such as colour. Based on this theory, we chose icons without a colour code to eliminate its potential effect on the aim of our experiment. The “real” icon, which includes colour and shape codes, will be sequentially analyzed in future experiments. Why were three and five icons capable of causing noticeable P300 and P200 EEG changes, while ten icons were not? What is the connection between RT and ACC? These questions will be addressed in future studies. Furthermore, we will explore the brain mechanism involved in the functional modules of the digital interface, such as layout, navigation bar and information coding form.
4 Conclusion
P300 has significant volatility changes and the maximum amplitude around the PZ area and P200 has significant changes around the FCZ area under different conditions. Overall, the more difficult the task, the larger the P300 and P200 amplitudes. P300 latency is positively correlated with task difficulty. The user experience engineer and GUI designer can utilize P200 and P300 as a reference standard in interface design and evaluation processes.
[1]Rogers Y. Icons at the interface: their usefulness [J].InteractingwithComputers, 1989, 1(1): 105-117.
[2]Lin R. A study of visual features for icon design [J].DesignStudies, 1994, 15(2): 185-197.
[3]Huang S M, Shieh K K, Chi C F. Factors affecting the design of computer icons [J].InternationalJournalofIndustrialErgonomics, 2002, 29(4): 211-218.
[4]Lindberg T, Näsänen R, Müller K. How age affects the speed of perception of computer icons [J].Displays, 2006, 27(4): 170-177.
[5]Chan A, MacLean K, McGrenere J. Designing haptic icons to support collaborative turn-taking [J].InternationalJournalofHuman-ComputerStudies, 2008, 66(5): 333-355.
[6]Salman Y B, Cheng H I, Patterson P E. Icon and user interface design for emergency medical information systems: a case study [J].InternationalJournalofMedicalInformatics, 2012, 81(1): 29-35.
[7]Posner M I. Orienting of attention [J].QuartExperimentPsychol, 1980, 32(1): 3-25.
[8]Girelli M, Luck S J. Are the same attentional mechanism used to detect visual search targets defined by color, orientation, and motion?[J].CognitiveNeuroscience, 1997, 9(2): 238-258.
[9]Kusak G, Grune K, Hagendorf H, et al. Updating of working memory in a running memory task: an event-related potential study [J].InternPsychophysiology, 2000, 39(1): 51-65.
[10]Missonnier P, Deiber M P, Gold G, et al. Working memory load-related electroencephalographic parameters can differentiate progressive from stable mild cognitive impairment [J].Neuroscience, 2007, 150(2): 346-356.
[11]Rader S K, Holmes J L, Golob E J. Auditory event-related potentials during a spatial working memory task [J].ClinicalNeurophysiology, 2008, 119(5): 1176-1189.
[12]Yi Y, Friedman D. Event-related potential (ERP) measures reveal the timing of memory selection processes and proactive interference resolution in working memory [J].BrainResearch, 2011, 1411: 41-56.
[13]Krigolson O E, Heinekey H, Kent C M, et al. Cognitive load impacts error evaluation within medial-frontal cortex [J].BrainResearch, 2012, 1430: 62-67.
[14]Isreal J B, Wickens C D, Donchin E. The dynamics of P300 during dual-task performance [J].ProgressinBrainResearch, 1980, 54: 416-421.
[15]Luck S J. Sources of dual-task interference: evidence from human electrophysiology [J].PsychologicalScience, 1998, 9(3): 223-227.
[16]Kok A. On the utility of P300 amplitude as a measure of processing capacity [J].Psychophysiology, 2001, 38(3): 557-577.
[17]Polich J. Updating P300: an integrative theory of P300a and P300b [J].ClinicalNeurophysiology, 2007, 118(10): 2128-2148.
[18]Luck S J, Hillyard S A. Electrophysiological correlates of feature analysis during visual search [J].Psychophysiology, 1994, 31(3): 291-308.
[19]Potts G F, Tucker D M. Frontal evaluation and posterior representation in target detection [J].CognitiveBrainResearch, 2001, 11(1): 147-156.
[20]Zhao L, Li J. Visual mismatch negativity elicited by facial expressions under non-attentional conditions [J].NeuroscienceLetters, 2006, 410(2): 126-131.
[21]Huang Y Q, Li X, Li R L.Designhuman-computerinterface[M]. Beijing: Beijing Institute of Technology Press, 2007: 100-110.(in Chinese)
[22]Wei, J H, Luo Y J.Thetheoryandtechnologyofevent-relatedpotentials[M]. Beijing: Science Press, 2010:52-55.(in Chinese)
[23]Smith E E, Jonides J, Koeppe R A. Dissociation verbal and spatial working memory using PET [J].CerebralCortex, 1996, 6(1): 11-20.
[24]Wang H L, Feng T Y, Suo T, et al. The process of counterfactual thinking after decision-making: evidence from an ERP study [J].ChineseScienceBulletin, 2010, 55(12): 1113-1121.
[25]Miller G A. The magic number seven, plus or minus two: Some limits on our capacity for processing information [J].PsychologicalReview, 1956, 63(2): 81-97.
[26]Cowan N, Saults J S, Morey C C. Development of working memory for verbal-spatial associations [J].JournalofMemoryandLanguage, 2006, 55(2): 274-289.
[27]Unsworth N, Spillers G J. Working memory capacity: attention control, secondary memory, or both? A direct test of the dual-component model [J].JournalofMemoryandLanguage, 2010, 62(4): 392-406.
[28]Pimperton H, Nation K. Suppressing irrelevant information from working memory: evidence for domain-specific deficits in poor comprehenders [J].JournalofMemoryandLanguage, 2010, 62(4): 380-391.
[29]van der Ham I J, van Strien J W, Oleksiak A, et al. Temporal characteristics of working memory for spatial relations: an ERP study [J].InternationalJournalofPsychophysiology, 2010, 77(2): 83-94.
[30]Shucard J L, Tekok-Kilic A, Shiels K, et al. Stage and load effects on ERP topography during verbal and spatial working memory [J].BrainResearch, 2009, 1254: 49-62.
[31]Agam Y, Sekuler R. Interactions between working memory and visual perception: an ERP/EEG study [J].NeuroImage, 2007, 36(3): 933-942.
[32]Hajcak G, Moser J S, Simons R F. Attending to affect: appraisal strategies modulate the electro cortical response to arousing pictures [J].Emotion, 2006, 6(3): 517-522.
[33]Kutas M, Mccarthy G, Donchin E. Augmenting mental chronometry: P300 as a measure of stimulus evaluation time [J].Science, 1977, 197(4305): 792-795.
[34]Kutas M, Hillyard S A. Reading senseless sentences: brain potentials reflect semantic incongruity [J].Science, 1980, 207(4427): 203-205.
[35]Biedermann I, Ju G. Surface versus edge-based determinants of visual recognition [J].CognitivePsychology, 1988, 20(1): 38-64.
基于事件相关电位的不同时间压力和数量下的图标记忆
牛亚峰1薛澄岐1李雪松2李 晶1王海燕1金 涛1
(1东南大学机械工程学院, 南京 211189) (2东南大学儿童发展与学习科学教育部重点实验室, 南京 210096)
为获取人机交互数字界面中图标元素生理评估的相关脑电成分和神经学依据,基于事件相关电位技术,采用改进的样本延迟匹配任务实验范式,研究在不同时间压力(4 000 ms,2 000 ms)和不同图标数量(3个图标,5个图标,10个图标)下图标记忆.实验结果表明:在图标认知过程中,P300有显著波幅差异,并在PZ电极附近存在最大波幅;P200在FCZ附近有明显波幅变化;P300和P200的波幅随任务难度的增加呈增大趋势;P300的潜伏期和任务难度呈现负相关现象.图标记忆特征的事件相关电位研究,对用户神经认知行为和界面可用性生理评估有非常重要的参考价值和指导意义.
时间压力;图标数量;事件相关电位;P200;P300
TP301
s:The National Natural Science Foundation of China (No.71271053, 71071032), the Scientific Innovation Research of College Graduates in Jiangsu Province (No.CXZZ12_0093).
:Niu Yafeng, Xue Chengqi, Li Xuesong, et al. Icon memory research under different time pressures and icon quantities based on event-related potential[J].Journal of Southeast University (English Edition),2014,30(1):45-50.
10.3969/j.issn.1003-7985.2014.01.009
10.3969/j.issn.1003-7985.2014.01.009
Received 2013-07-12.
Biographies:Niu Yafeng (1988—), male, graduate; Xue Chengqi (corresponding author), male, doctor, professor, ipd_xcq@seu.edu.cn.
猜你喜欢
杂志排行

Journal of Southeast University(English Edition)的其它文章
- Speech emotion recognitionusing semi-supervised discriminant analysis
- Shape retrieval using multi-level included anglefunctions-based Fourier descriptor
- Performance analysis of ammonia-water absorption/compression combined refrigeration cycle
- Optimization of cross-coupling reaction for synthesis of antitumor drug vismodegib
- Flexural behaviors of FRP strengthened corroded RC beams
- Notes on well-posedness for the b-family equation