呼兰河湿地夏、秋两季浮游植物功能分组演替及其驱动因子
2014-08-11陆欣鑫范亚文
陆欣鑫,刘 妍, 范亚文
(哈尔滨师范大学,植物学省级重点实验室,哈尔滨 150025)
呼兰河湿地夏、秋两季浮游植物功能分组演替及其驱动因子
陆欣鑫,刘 妍, 范亚文*
(哈尔滨师范大学,植物学省级重点实验室,哈尔滨 150025)
于2012年夏、秋两季把呼兰河湿地划分为湿地保护区、湿地农业区、湿地工业区三部分,根据不同生境设置采样点并进行浮游植物标本采集。研究期间共鉴定浮游植物191个分类单位,隶属于7门9纲19目28科69属。浮游植物种类组成主要以硅藻门种类数最多(43%),绿藻门其次(28%),另外裸藻门(17.2%)和蓝藻门(8.3%)也占较大的比例。浮游植物丰度从夏季的1.23×10⁷个/L上升为秋季的1.98×107个/L,两季平均1.6×107个/L。夏、秋两季共划分浮游植物功能分组19个, X1/W2/MP/Lo/J组藻种在夏、秋两季中均有稳定的出现,并占较大丰度比例,H1/Y/W1组的藻种只在特定的季节或地点出现,D/P/TB组藻种虽出现的频率较高但相对丰度较低。代表性功能分组从夏季的H1/MP/Lo/TB/J/G演替为秋季的MP/W2/X1/J/W1/Y。在采集浮游标本的同时,对电导率(SpCond)、总磷(TP)、水温(WT)等环境因子进行监测。利用典范对应分析探讨环境因子与浮游植物功能分组间的相互关系。研究结果显示,电导率,总磷和水温是驱动呼兰河湿地浮游植物功能组演替的主要环境因素。
浮游植物功能分组;季节演替;环境变化;呼兰河湿地
湿地占地球表面积6%,是世界上的三大生态系统之一,具有巨大的经济、社会和生态学价值,是生物多样性最丰富的生态系统。呼兰河湿地位于哈尔滨市呼兰区南部,松花江北岸,总面积19262 hm2,是目前中国最大的城市湿地,由于近年来农业化和工业化的严重,导致呼兰河湿地内物种多样性锐减,水体呈富营养化状态。因此,湿地的恢复和重建是我们面对可持续发展的重要问题[1]。
藻类是生态系统的初级生产者,对环境的变化敏感,近年来越来越多的藻类学者利用藻类植物群落结构的演替来指示水环境的变化[2]。有研究表明藻类植物在不同的生境条件下会主动或被动地适应生境的改变[3]。2002年Reynold等[4]提出了浮游植物功能分组(Phytoplankton functional classifation)的概念,浮游植物功能分组在经典分类学的基础上,简化了分类和了解相似集群对环境适应性的难度[5]。利用浮游植物功能分组能够更精确的描述浮游植物群落适应不同水体的生活周期及环境因子(包括水动力学、营养盐浓度以及光照等)的相关性[6]。
目前国内外关于浮游植物功能分组的研究多集中在河流生态系统中[7- 11]。本文在Reynold浮游植物功能分组的基础上,利用典范对应分析(CCA)的方法,对呼兰河湿地浮游植物及8个环境因子进行相关性分析,探讨呼兰河湿地浮游植物功能分组的演替特点,以及驱动浮游植物功能分组变化的主要环境因子,以期为呼兰河湿地的恢复和保护提供科学依据和基础生物学资料。
1 材料和方法
1.1 采样点的设置
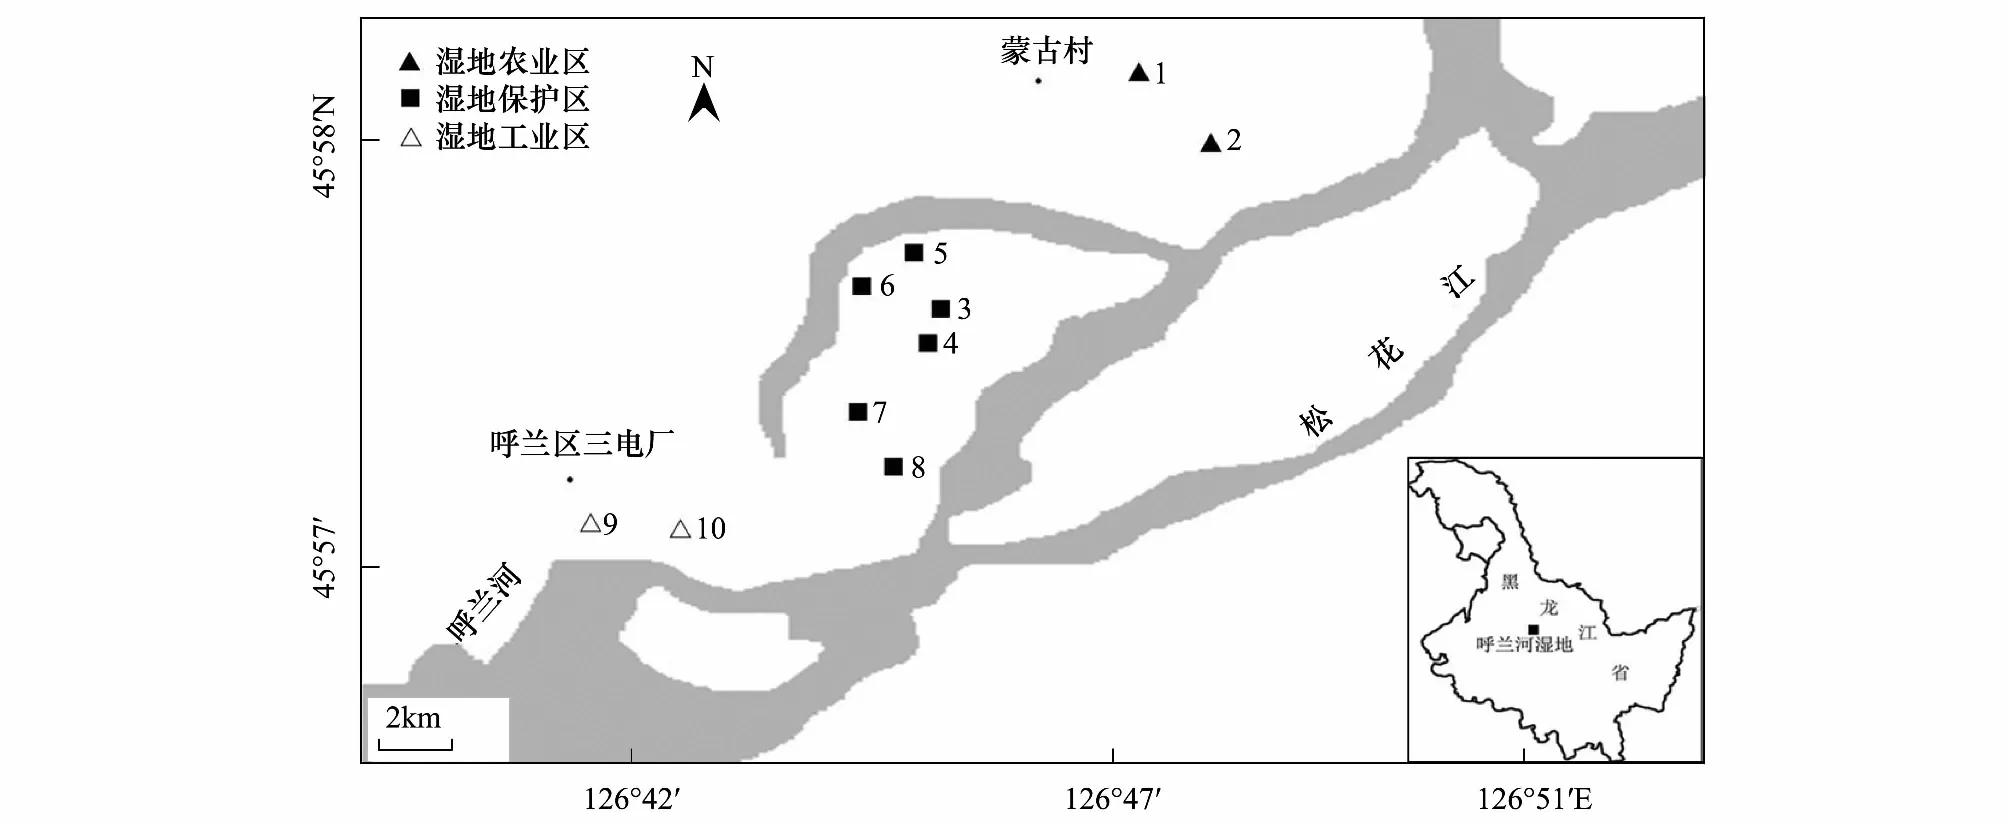
根据呼兰河湿地修复情况及生境特点[12],共在呼兰河湿地按湿地农业区(45°58′N,126°47′E)、湿地工业区(45°57′N,126°42′E)以及湿地保护区(45°57′N, 126°46′E)划分3个采集区域,共设置10个采样点(图1)。
其中,湿地农业区包括采样点1、2,设定在哈尔滨市呼兰区蒙古村附近,此处有大量的农田,常年有放牧,人为活动频繁。湿地保护区包括采样点3—8,是正在治理和修复中的湿地,在此处根据芦苇沼泽、人造景观、开阔水域等生境特点共设置6个采样点。湿地工业区包括采样点9、10,位于呼兰河湿地下游的呼兰区第三发电厂附近,此处受工业排水影响较大。

图1 呼兰河湿地标本采集图Fig.1 The locations of the sampling sites at Hulan River Wetland
1.2 标本的采集和鉴定
用常规方法对浮游藻类标本进行采集[13],标本鉴定主要依据胡鸿钧、魏印心等著作文献[14- 20]。在采样现场用Manta 2多功能水质检测仪(Eureka, 美国)进行pH、电导率(SpCond)、水温(WT)、溶解氧(DO)、浊度(Turb)以及氨氮(NH4-N)测定,用GPS导航仪对采集样点进行坐标定位,24h内在实验室进行总氮(TN)总磷(TP)的测定[21]。
1.3 数据的分析
用Excel 对藻类细胞密度进行计算,去趋势分析(DCA)、典范对应分析(CCA)利用CANOCO 4.5软件进行。
2 结果与分析
2.1 浮游植物群落组成
2012年夏、秋两季呼兰河湿地共鉴定浮游植物191个分类单位,包括186种5变种,隶属于7门9纲19目28科69属。其中硅藻门30属83种,占浮游植物种类总数的43%;绿藻门22属55种,占28%;裸藻门5属33种,占17.2%;蓝藻门7属16种,占8.3%;甲藻门2属3种,占总数1.5%;隐藻门2属4种,占总数1.9%;黄藻门1属1种,占总数0.5%。优势种分别为硅藻门的放射舟形藻(Navicularradiosa)、膨胀桥弯藻(CymbellatumidaVan Heurck.)、小型异极藻(GomphonemaparvulumKütz.);绿藻门的小球藻(ChlorellavulgarisBeijerinck.)、隆顶栅藻(Scenedesmusprotuberans)、镰形纤维藻(AnkistrodesmusfalcatusWest.);裸藻门的旋转囊裸藻(Trachelomonasvolvocina)、矩圆囊裸藻(TrachelomonasoblongaLemm.)、椭圆鳞孔藻(LepocinclissteiniiLemm.);蓝藻门的固氮鱼腥藻(Anabaenaaoztica)、绿色颤藻(OscillatoriachlorinaKütz.)。另外隐藻门的卵形隐藻(CryptomonasovataEhr.)和甲藻门的威氏多甲藻(PeridiniumwilleiHuilfeld-Kaas.)也多次被检测到。
呼兰河湿地夏、秋两季浮游藻类组成有明显的演替现象(图2),夏季共鉴定浮游植物116个分类单位。浮游植物组成主要以硅藻门、绿藻门和裸藻门为主,其中硅藻门38种(32%)>绿藻门37种(31%)>裸藻门28种(24%)>蓝藻门8种(6%)>甲藻门2种(1.7%)>隐藻门2种(1.7%)>黄藻门1种(0.8%)。秋季共鉴定浮游植物162个分类单位。藻类组成以硅藻门、绿藻门和裸藻门为主,其中硅藻门67种(41%)>绿藻门53种(32%)>裸藻门24种(14%)>蓝藻门11种(6%)>隐藻门4种(2%)>甲藻门3种(1.8%)。浮游植物群落结构季节变化明显,夏季以蓝藻门的固氮鱼腥藻(Anabaenaaoztica)、绿藻门的隆顶栅藻(Scenedesmusprotuberans)为优势种,秋季硅藻门的放射舟形藻(Navicularradiosa)、裸藻门的旋转囊裸藻(Trachelomonasvolvocina)生长占优势。

图2 呼兰河湿地夏秋两季各门藻类种数对比Fig.2 The seasonal variation of the phytoplankton community at Hulan River Wetland
2.2 浮游植物丰度变化
呼兰河湿地夏、秋两季浮游植物丰度有明显的变化(图3),两季浮游植物总丰度为3.21×10⁷个/L,变幅在1.23×107—1.98×107个/L,平均值为1.6×107个/L。夏季浮游植物的丰度为1.23×107个/L,秋季由于水温降低及营养盐浓度的升高,浮游植物丰度增加为1.98×107个/L。湿地农业区农业肥料及湿地工业区工业污水的排放等人为活动都会不同程度的限制浮游藻类的生长[22],湿地保护区内人为活动对浮游植物生长限制相对较低,因此在不同的样点间浮游植物的丰度也存在差异。湿地农业区夏、秋两季浮游植物总丰度为3.7×106个/L,绿藻门的相对丰度最高,占44.7%,其次为硅藻门占38%。湿地保护区夏、秋两季浮游植物总丰度为2.5×107个/L,硅藻门植物的相对丰度最大,占丰度总数37%,另外绿藻门植物也占较大比重。湿地工业区夏、秋两季浮游植物总丰度为3.3×106个/L,由于湿地工业区污水排放导致其周围水域水温及电导率较高,特殊的生境使蓝藻门植物在工业采集区的丰度达到相对较高,占38.3%。

图3 呼兰河湿地3个采集区藻类植物丰度总数对比Fig.3 Cell density of algae at Hulan River Wetland
2.3 浮游植物功能组的演替
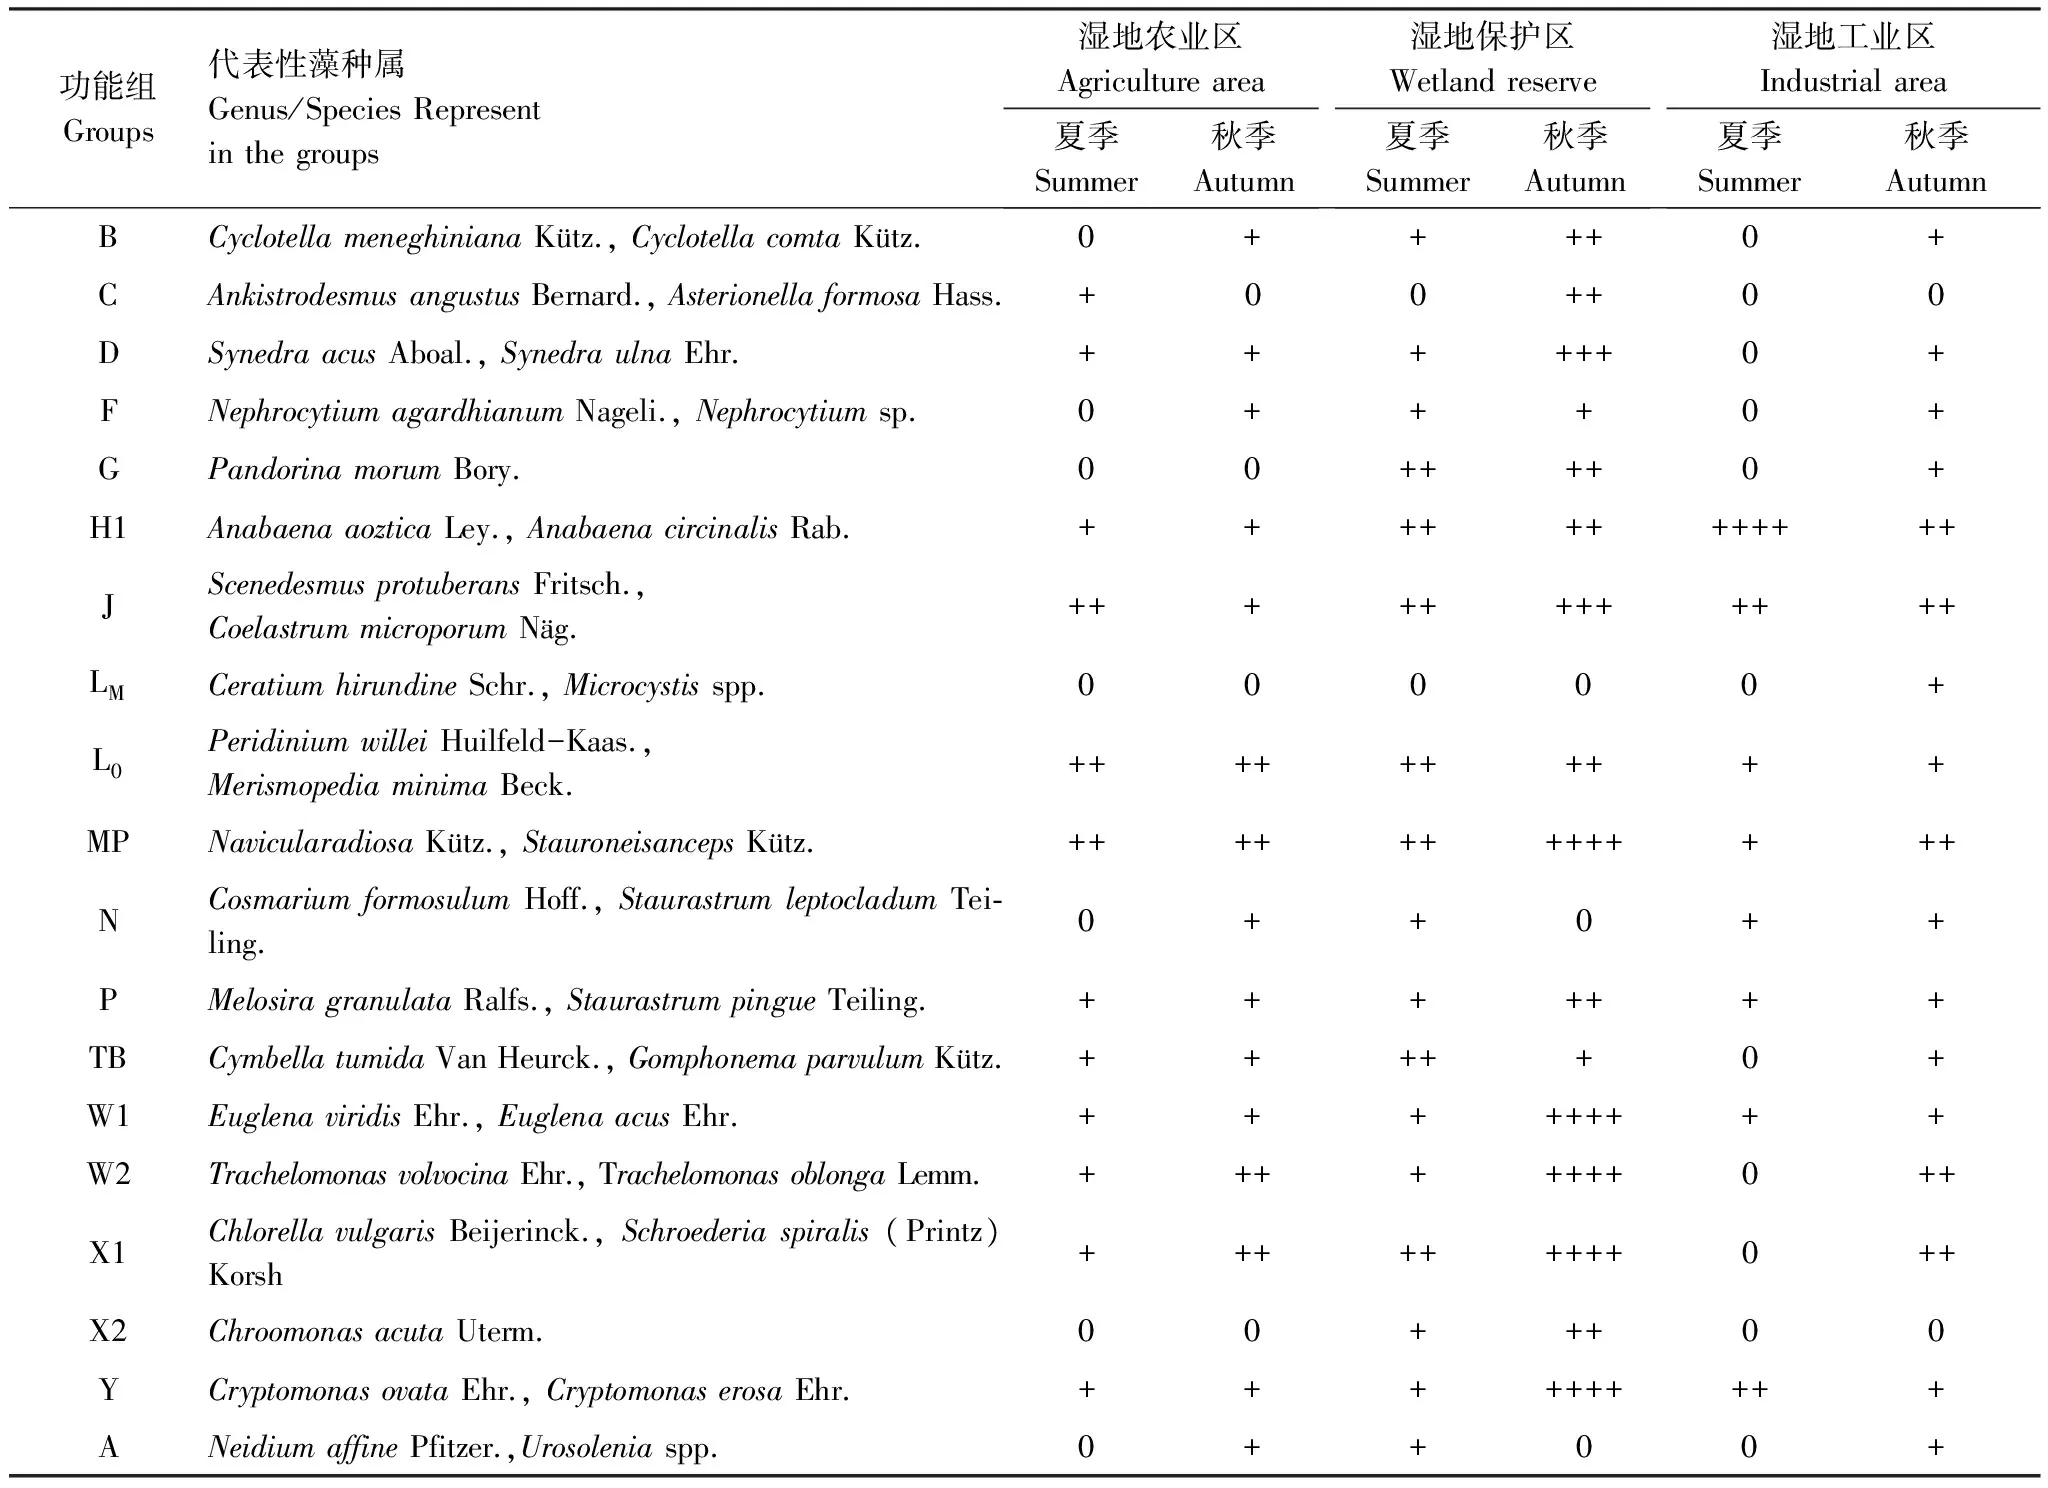
根据Reynold以及Padisák对功能分组的后续补充报道[23- 24],将呼兰河湿地浮游植物划分出19个功能分组,代表藻种以及在3个标本采集区的分布情况见表1。各功能组的相对丰度如图4,把相对丰度为5%以上的功能组定义为代表性功能组[25]。研究结果显示,呼兰河湿地夏、秋两季的代表性功能组为Lo/W1/W2/Y/H1/X1/J/MP。

图4 浮游植物功能组各组相对丰度Fig.4 The Relative abundance distribution of 19 phytoplankton functional groups
浮游植物功能分组将生境变化与浮游植物群落演替过程有效地结合起来,解释了特定生境下某些浮游植物类群对生境变化的适应性[23]。从图5可以看出,X1/W2/MP/Lo/J组藻种在夏、秋两季中均有稳定的出现,并占较大丰度比例;H1/Y/W1组的藻种只在特定的季节或地点出现,D/P/TB组藻种虽出现的频率较高,但相对丰度较低。功能组LM/X2/A/F在所有功能组中丰度所占的比例较小。其中,湿地农业区代表性功能组从夏季的MP/LO/J/D//W2/X1演替为秋季的MP/X1/J/W2,湿地保护区代表性功能组从夏季的MP/TB/LO/G/J演替为秋季的MP/W2/X1/Y/J,而湿地工业区代表性功能组从夏季的H1/Y/J/LO演替为秋季的MP/J/X1/W2/H1。由于受夏、秋两季环境因子变化的影响,呼兰河湿地代表性功能组总的变化从夏季的H1/MP/Lo/TB/J/G演替为秋季的MP/W2/X1/J/W1/Y。
表1 呼兰河湿地各功能组代表属种以及在3个采集区出现的频率及丰度(个/L)
Table 1 The Frequency and Abundance of Seasonal variations of phytoplankton functional group in each of three areas where samples were completed

功能组Groups代表性藻种属Genus/SpeciesRepresentinthegroups湿地农业区Agriculturearea夏季Summer秋季Autumn湿地保护区Wetlandreserve夏季Summer秋季Autumn湿地工业区Industrialarea夏季Summer秋季AutumnBCyclotellameneghinianaKütz.,CyclotellacomtaKütz.0++++0+CAnkistrodesmusangustusBernard.,AsterionellaformosaHass.+00++00DSynedraacusAboal.,SynedraulnaEhr.++++++0+FNephrocytiumagardhianumNageli.,Nephrocytiumsp.0+++0+GPandorinamorumBory.00++++0+H1AnabaenaaozticaLey.,AnabaenacircinalisRab.++++++++++++JScenedesmusprotuberansFritsch.,CoelastrummicroporumNäg.++++++++++++LMCeratiumhirundineSchr.,Microcystisspp.00000+L0PeridiniumwilleiHuilfeld-Kaas.,MerismopediaminimaBeck.++++++++++MPNavicularadiosaKütz.,StauroneisancepsKütz.+++++++++++++NCosmariumformosulumHoff.,StaurastrumleptocladumTei⁃ling.0++0++PMelosiragranulataRalfs.,StaurastrumpingueTeiling.+++++++TBCymbellatumidaVanHeurck.,GomphonemaparvulumKütz.+++++0+W1EuglenaviridisEhr.,EuglenaacusEhr.+++++++++W2TrachelomonasvolvocinaEhr.,TrachelomonasoblongaLemm.++++++++0++X1ChlorellavulgarisBeijerinck.,Schroederiaspiralis(Printz)Korsh+++++++++0++X2ChroomonasacutaUterm.00+++00YCryptomonasovataEhr.,CryptomonaserosaEhr.++++++++++ANeidiumaffinePfitzer.,Urosoleniaspp.0++00+
+:1—1.0×10⁵,++:1.0×10⁵—5.0×10⁵,+++:5.0×10⁵—1.0×10⁶,++++1.0×10⁶以上
2.3 环境因子变化
呼兰河湿地夏、秋两季理化因子如表2所示,夏、秋两季水温有明显的变化,变幅为17.08—26.64 ℃,平均水温为21.59 ℃。pH值变化范围为6.20—7.60,平均pH值为6.63。TP变化范围0.14—0.84 mg/L,NH4-N变化范围0.7—3.80 mg/L。TN变化范围0.14—0.81 mg/L。电导率夏季略高于秋季,变化范围为224.77—657.50 μS/cm。
2.4 浮游植物功能组与环境因子相关性分析
对呼兰河湿地浮游植物常见功能分组进行去趋势分析(DCA),排序结果显示前两轴长度梯度分别为2.477和1.562,因此非线性排序方法CCA更能说明本实验的结果。用蒙特卡洛单因子检验法对8个理化因子进行排除,将P<0.05的环境因子:SpCond(P=0.001)、Turb(P=0.061)、WT(P=0.002)、TP(P=0.001)引入CCA。被排除的环境因子为DO (P=0.088) 、pH值(P=0.09)、TN(P=0.347)、NH4-N(P=0.06)。CCA前两个排序轴的特征值分别为0.134和0.066。种类与环境因子排序的关系系数达到了0.953和0.878,证明排序轴较好的反映了环境因子和浮游植物功能分组之间的关系。CCA排序轴的前两轴共解释浮游植物功能组群落变异的82.4%。其中SpCond、TP、WT与第一轴正相关,Turb与第一轴负相关。蒙特卡洛检验显示,样本来自不同的正态总体,样本与物种、样本和环境因子之间具有统计意义(F= 2.868,P<0.01)(图6)。

图5 代表性功能组在夏、秋两季3个标本采集区相对丰度变化图Fig.5 Representative functional groups in summer and autumn其中“1”: 夏季农业区Agricultural area in summer;“2”: 秋季农业区Agricultural area in autumn;“3”: 夏季湿地保护区Wetland reserve in the summer;“4”:秋季湿地保护区Wetland reserve in the autumn;“5”: 夏季工业区Industrial area in summer;“6”:秋季工业区Industrial area in autumn

湿地农业区Agriculturearea变化范围Interval平均Mean湿地保护区Wetlandreserve变化范围平均湿地工业区Industrialarea变化范围平均水温WT/℃夏季Summer25.55—26.6426.0924.65—25.3024.9725.1325.13秋季Autumn17.16—18.9018.0317.08—19.1918.1317.65—18.6018.12pH夏季6.20—6.516.356.18—6.466.317.547.54秋季6.41—6.566.497.25—7.606.507.25—7.607.42电导率夏季249.93—260.15255.04272.07—312.70284.89657.50657.50SpCond/(μS/cm)秋季248.43—253.05250.74224.77—269.20239.66245.25—599.14422.20溶解氧DO/(mg/L)夏季6.10—6.346.223.88—6.795.128.818.81秋季6.43—6.446.436.22—9.467.296.63—9.147.89浊度TurbNTU夏季167.50—205.35186.43125.40—543.78236.27112.80112.80秋季127.95—131.53129.7480.25—343.25168.89137.13—337.14237.13氨氮NH4-N/mg/L-N夏季1.50—1.931.721.50—2.101.743.803.80秋季0.70—0.700.700.70—1.300.920.70—1.701.21总氮TN/(mg/L)夏季0.14—0.190.170.20—0.810.600.160.16秋季0.28—0.430.350.16—0.230.210.20—0.220.21总磷TP/(mg/L)夏季0.14—0.210.180.13—0.260.200.500.50秋季0.30—0.400.350.20—0.400.310.24—0.840.54
3 讨论
3.1 浮游植物功能组的演替
浮游植物功能组的演替与水体环境的变化相对应,湿地水体的水温、营养盐和水体的扰动程度都会影响浮游植物功能组的演替[7]。当周围环境发生变化,藻类集群能够通过自身的群落演替进而维持生态平衡[23- 24]。通常情况下,浮游植物对周期性大规模的气候变化敏感[26]。呼兰河湿地属于温带季风气候,夏、秋两季温差变幅较大,环境因子对浮游植物功能组演替的限制性差异明显,水温和营养盐等环境因子的改变以及水体的扰动共同驱使浮游植物功能组的演替。
水温的变化可以直接影响浮游植物的群落组成、演替方向以及部分生理特性[25]。由于夏季较高的光照和水温条件,使湿地保护区内耐受高光照条件的功能组存活下来,而对高光照敏感的功能组生长则相对受到抑制,夏季代表性功能组为H1/MP/Lo/TB/J/G,多为在较高水温条件适宜生存的组别,如G、J和H1组藻类在夏季生长较活跃。
湿地保护区在夏季中具有大面积的芦苇沼泽(采样点3、4),营养物质充足,为浮游植物的生长提供了充裕的条件。芦苇造成水体光照较低,为喜好高温、耐受于低光照条件的W2/W1/Y组生长提供良好的条件,一些有鞭毛类的浮游藻类,如Y组的卵形隐藻(Cryptomonasovata),能够利用鞭毛在水体中进行垂直迁移,对低光照的适应性强,对芦苇湿地的水环境具有较强的适应性[4],因此,W2/Lo/G/W1/J/Y组藻种成为此生境的优势类群。在湿地内相对开阔水域(采样点5、6),光照充足,较强的水体流动使营养盐的浓度有所下降,同时也破坏了水体的稳定性,在这种情况下,一些固着类藻种,如MP组的窄异极藻(GomphonemaangustatumKütz.) 可以在水体扰动的生境资源竞争中取得优势而成为优势种群。同时,水体流动常会引起藻类沉降速率较慢,生长速率降低[27],多以群体形式存在的Lo组藻种在物质短缺及营养盐降低的条件下,能够通过生物固氮或分泌磷酸等方式来维持生存[23],因此MP/D/Lo/W1组藻种成为湿地开阔水域的优势类群。采样期间,湿地保护区的部分区域正在进行人造景观的修复(采样点7、8),附近水体非常浑浊,导致该水域营养盐较低,此处浮游植物丰度最低,物种多样性匮乏。因此,仅有耐受于水体扰动的W1组藻种避免了环境的压力成为湿地内人造景观处的优势类群。
营养盐是浮游植物存活的必要条件,浮游植物的物种多样性、代谢速率与营养盐的组成和分布是密不可分的[28]。由于呼兰河湿地的水源来自上游农业区的河流,农业灌溉频繁,大量的化肥流入水体中,导致水体营养盐度升高。随着秋季湿地保护区水温的降低,营养盐度的升高,浮游植物群落结构发生了明显的演替,适宜在较高水温条件栖息且不能通过自身生理特性应对环境变化的功能组在环境适应性及资源竞争中被淘汰,喜好在低温环境和嗜好较高营养盐度生长的功能组生长占优势,例如,嗜好水温较低水体的硅藻门MP组以及广谱适应性的Y组藻种在秋季活动频繁,而适应高温条件的H1组藻种的生长则受到抑制,同时较高的营养盐度驱动使资源竞争能力较强的集群在生长中占优势,如W2/X1组藻种在秋季较为活跃,因此,秋季的湿地保护区代表性功能组演替为以硅藻(MP)为主,W2/Y/X1/W1/J/Lo/G共存的情况。
相对于湿地保护区,湿地农业区受农业活动及放牧的影响,藻类多样性及丰度远低于湿地保护区,由于湿地农业区氮、磷浓度的升高,为部分藻类集群如X1/W2/J组生长提供了充裕的生存条件,其中X1组的藻种在资源竞争中取得优势并最终成为该区域内的优势类群。在湿地工业区,由于污水排放导致其周围水域具有较高的水温、氮磷浓度以及最高的电导率,因此出现了在资源竞争和环境适应性上都处于优势的H1组藻种如,固氮鱼腥藻(Anabaenaaoztica)(丰度为1.07×106个/L)在此环境大量生长的现象。
3.2 浮游植物功能组的演替与环境因子的相关性分析
浮游植物功能组的组成与湿地水环境的特征是相互对应的,光照、营养盐、浮游动物对于资源的竞争、湿地内水动力学特征,都会影响浮游植物功能组组成[24]。在不同的气候及生境条件下,驱动浮游植物群落结构演替的环境因子如电导率和营养盐共同作用使浮游植物功能分组发生演替[27]。本研究中,CCA排序轴1与电导率(0.903)、总磷(0.901)、和水温(0.531)正相关,表明浮游植物功能分组的演替主要是由电导率、总磷和水温3个限制因子共同驱动的结果。
呼兰河湿地上游农业区的水源将农业肥料中的离子带入湿地保护区内,下游三电厂工业污水的排放也引起电导率(SpCond)以及总磷(TP)浓度偏高,致使其周围水体基本处于富营养化的状态。电导率是影响浮游植物群落结构的重要环境因子,电导率的变化会引起浮游植物物种多样性发生改变[29],通过较高的水体电导率可以推测其环境无机质含量丰富[30]。在呼兰河湿地,喜好在富营养条件生存的功能组如H1/X1/Y/J等随着电导率的升高其种类及丰度变得更加丰富;而P组的藻种如纤细角星鼓藻 (StaturastrumgracileRalfs.)、钝脆杆藻(FragilariacapucinaDesmaziéres.)由于对较低的电导率条件敏感,在水体金属离子较低的条件下,不能完成正常的代谢[23],因此,也常常出现在高电导率的水域中,CCA结果也表明电导率与这些功能组均成正相关。磷是影响浮游植物生长必不可少的营养物质,对浮游植物功能组的组成有显著的影响[31],过高或过低的磷浓度都会限制藻类植物的生长,如H1组在磷含量不足时,代谢速率明显低于磷浓度充足的条件[32]。在研究期间的夏、秋两季,几乎所有采集区的总磷含量均超越了富营养化的标准。CCA结果显示,夏、秋两季代表性功能组中,X1/H1/W2/Lo/J均随着磷含量的升高而生长更为活跃,同时磷含量的升高也在一定程度上促进了P/Y/TB组藻种的生长,所以即使在秋季水温降低的情况下,X1/W2/MP/Lo/J组藻类依然成为稳定的优势类群。水温通常是影响浮游植物发育和繁殖的限制因子,一般情况下,蓝藻、裸藻适宜在较高的水温生长,硅藻门藻种适宜在春、秋较低的水温条件下生存,绿藻门则在中等水温的生境下较为活跃[33]。CCA排序图显示,夏、秋两季代表性功能组中除MP外,功能组X1/Lo/W2/J以及H1均和水温成正相关,它们大部分属于裸藻门、蓝藻门及绿藻门的部分种类,在夏季水温较高的条件下生长较为旺盛;而MP/D/B/W1/S等则与水温呈负相关,在中等或较低水温的生境下,这些功能组代谢速率升高且生长较为活跃。秋季水温降低,一些嗜好较高水温生境的功能组,进入秋季后生长受到一定的限制,如G/H1功能组藻种在秋季生长代谢缓慢且丰度较夏季有明显的降低,其中G组藻类的丰度从夏季的3.87×105个/L下降到秋季的1.89×105个/L。硅藻门的MP/D/B组在进入秋季后,其藻类种类数及个体的相对丰度较夏季明显升高,嗜好在冷水生境生存的D组藻种EncyonemasilesiacumBleisch.和MP组藻种Gomphonemaconstrictumvar.robustumMayer.在秋季湿地水体中适应性较为突出,与此同时,D组中部分喜好中等水温的藻种如EpithemiaadnataBrébisson. 不能适应秋季水温降低的变化,生长受到抑制[14],因此,MP组成为秋季的优势类群。
在呼兰河湿地出现的优势种群大部分为污染指示种,代表性藻种如J组藻种四尾栅藻(Scenedesmusquadricauda)为β-ms(超富营养型)代表性种类,Y组的啮噬隐藻(Cryptomonaserosa)、X1组的小球藻(Chlorellavulgaris)均为α-ms(富营养型)指示种;而湿地代表性功能组,Lo(甲藻)/W1(裸藻)/W2(囊裸藻)/Y(隐藻)/H1(鱼腥藻)/X1(小球藻)/J(栅藻、纤维藻)/MP(舟形藻、辐节藻)中的藻类,也大都属于污染指示种[34- 36]。同时,湿地的TN、TP平均浓度均已超出湖泊富营养化临界值[37],综合来看,可以推测呼兰河湿地在研究期间基本处于富营养化状态。
湿地农田化过程中,农业肥料的流入及工业污水的排放引起水体营养水平发生变化的现象越来越受到重视[23]。湿地农业区两季代表性功能组为MP/J/X1/W2/LO,其中X1组的镰形纤维藻(Ankistrodesmusfalcatus)为α-ms(富营养型)指示种,W2组的旋转囊裸藻(Trachelomonasvolvecina)为β-ms(超富营养型)代表性种类。而湿地工业区由于工业污水的排放,周围水体氮磷含量升高,较高的营养水平使H1鱼腥藻疯长,其中占优势的螺旋鱼腥藻(Anabaenaspiroides)为β-ms(超富营养型)指示种。由此可见,农业区、工业区代表性功能组中的优势种较湿地保护区的优势种对环境的污染指示作用更为突出,其周围环境水体的富营养化程度可能更高。
呼兰河湿地中氮、磷营养盐物质的增加主要来源于上游农业区化肥流失和下游工农业生活废水,在农业区长期放牧行为也在一定程度上影响了湿地内有机物的含量。与前期在呼兰河湿地的研究工作相比[12],呼兰河湿地环境目前有进一步恶化的趋势,亟待改善。呼兰河湿地富营养化防治关键问题在于如何控制湿地有机物的流入以及如何降低湿地保护区内氮、磷的含量,这对呼兰河湿地的可持续发展及环境保护是非常重要的。
[1] The Editorial Board of Encyclopedia of Chinese Wetland. China Wetlands Encyclopedia. Beijing: Beijing Science And Technology Press, 2009.
[2] Cardinale B J, Palmer M A, Collins S L. Species diversity enhances ecosystem functioning through interspecific facilitation. Nature, 2002, 415(6870): 426- 429.
[3] Reynolds C S. VegetationProcess in the Pelagic: A Model for ecosystem Theory. UK: Excellence in Ecology, 1997.
[4] Reynolds C S. TheEcology of Phytoplankton. Cambridge: Cambridge University Press, 2006.
[5] Soylu E N, Gonuloa A. Functional classification and composition of phytoplankton in Liman Lake. Turkish Journal of Fisheries and Aquatic Sciences, 2010, 10(1): 53- 60.
[6] Tilman D.Resource competition between planktonic algae: an experimental and theoretical approach. Ecology, 1977, 58(5): 338- 348.
[7] Tilman D, Kilham S S. Phosphate and silicate growth and uptake kinetics of the diatomsAsterionellaformosaandCyclotellameneghinianain batch and semi-continuous culture. J-ournal of Phycology, 1976, 12: 375- 383.
[8] Haney J F. An in situ examination of the grazing activities of natural zooplankton communities.Archiv für Hydrobiologie, 1973, 72: 87- 132.
[9] Nauwerck A. Die Beziehungen zwischenzooplankton und phytoplankton in See Erken Symb. Bot Upsalien, 1963, 17(5): 1- 163.
[10] Jeppesen E, Sondergaard M, Jensen J P, Havens K E, Anneville O, Carvalho L, Coveney M F, Deneke R, Dokulil M T, Foy B, Gerdeaux D, Hampton S E, Hilt S, Kangur K, Kohler J, Lammens E HHR, Lauridsen T L, Manca M, Miracle M R, Moss B, Nõges P, Persson G, Phillips G, Portielje R, Romo S, Schelske C L, Straile D, Tatrai I, Willén E, Winder M Lake responses to reduced nutrient loading an analysis of contemporary long-term data from 35 case studies. Freshwater Biology, 2005, 50: 1747- 1771.
[11] Padisák J, Borics G, Grigorszky I, Soróczki-Pintér É. Use of phytoplankton assemblages for monitoring ecological status of lakes within the Water Framework Directive: the assemblage index. Hydrobiologia, 2006, 553(1): 1- 14.
[12] Hui H K, Ma Y, Fan Y W.Algae community structure and distribution in Hulanhe Wetland,Heilongjiang Province. Journal of Lake Sciences, 2011, 23(6): 949- 954.
[13] State Environmental Protection Administration ofChina (SEPA), Water and Wastewater Monitoring Analysis Method Editorial Board. Water and Wastewater Monitoring Analysis Method.4th ed. Beijing: China Environmental Science Press, 2002.
[14] Kramer K,Lange-Bertalot H. Süßwasserflora von Mitteleuropa. Bacillariophyceae 4. Tei: Achnanthaceae, Kritische Eritische Erganzungen zu Achnanthes s.1., Naviculas. Gomphonema Gesamtliterturverzeichnis Tei1- 4. Süßwasserflora von Mitteleuropa. Band2/4. Berlin: Spektrum Akademischer Verlag, 1991:468.
[15] Bao W M, Wang Q X, Reimer Charles W. Diatoms from the Changbaishan Mountain area. Bulletin of Botanical Research, 1992, 12(2): 125- 143.
[16] Fan Y W. Studied on Aulonoraphidinale(Surirellales) fromHeilongjiang Province. Northeast Forestry University Press, 2004.
[17] Rumrich U, Lange-Bertalot H, Rumrich M. Diatom of theAndes. Iconographia Diatomologica, 2000, 9: 1- 672.
[18] Metzeltin D, Lange-Bertalot H, Garcia-Rodriguze F. Diatoms of Uruguay. Iconographia Diatomologica,2005, 15: 1- 736.
[19] Hu H J, Wei Y X. The freshwater Algae of China. Beijing: Beijing Science Press, 2006.
[20] Wei Y X. Flora AlgarumSinicarum Aquae Dulcis Tomis Ⅶ Chlorophyta. Beijing: Beijing Science Press, 1998.
[21] APHA. Standard Methods for the Examination of Water and Wastewater. 20th ed. Washington, DC: AOHA-AWWA-WPCF, 1998.
[22] Galloway J N, Townsend A R, Erisman J W, Bekunda M, Cai Z, Freney J F, Martinelli L A, Seitzinger S P, Sutton M A, Transformation of the nitrogen cycle: recent trends, questions, and potential solutions. Science,2008, 320(5878):889- 892.
[23] Reynolds C S. Towards a functional classification of the freshwater phytoplankton. Journal of Plankton Research, 2002, 24(5): 417- 428.
[24] Padisák J, Crossetti L O, Naselli-Flores L. Use and misuse in the application of the phytoplankton functional classification: a critical review with updates. Hydrobiologia, 2009, 621(1): 1- 19.
[25] Reynolds C S, J. Padisák, U. Sommer. Intermediate disturbance in the ecology of phytoplankton and the maintenance of species diversity: a synthesis. Hydrobiologia, 1993, 249(1/3): 183- 188.
[26] Kikham S, Kilham P. The importance of resource supply rates in determining phytoplankton community′s structure//Meyers D G, Strickler J R. Trophic Interaction with Aquatic Ecosystems. Aquatic Science, 1984: 7- 28.
[27] Lassen M K, Nielsen K D, Richardson K, Garde K, Schlüter L. The effects of temperature increase on a temperate phytoplankton community: A mesocosm climate change scenario. Journal of Experimental Marine Biology and Ecology 2010, 383(1): 79- 88.
[28] Leland H V. Distribution of phytobenthos in the Yakima River basin, Washington, inrelation to geology, land use, and other environmental factors. Canadian Journal of Fisheries and Aquatic Sciences, 1995, 52(5): 1108- 1129.
[29] Leland H V, Porter S D. Distribution of benthic algae in the upperIllinois River basin in relation to geology and land use.Freshwater Biology, 2000, 44 (2): 279- 301.
[30] Flores L N, B-arone R. Phytoplankton dynamics in two reservoirs with different trophic state ( Lake Rosam arina and Lake A rancio Sicily, Italy). Hydrobiologia, 1998, 369/370: 163- 178.
[31] Biggs B J F. The contribution of flood disturbance catchment geology and land use to the habitat template of periphyton in stream ecosystem. Freshwater Biology, 1995, 33(3): 419- 438.
[32] Harding L W, Meason B W, Fisher T R. Phytoplankton production in two east coast estuaries: photosynthesis-light functions and patterns of carbon assimilation in Chesapeake and Delaware bays. Est uarine Coastal and Shelf Science, 1986, 23(6): 773- 806.
[33] Shen Y F, Zhang Z S,Gong X G, Gu M R, Shi Z X, Wei Y X. Modern Biomonitoring Techniques Using Freshwater Microbiota. China Architecture & Bulding Press, 1990.
[34] Lin Q Q,Han R, Duan S S, Han B P. Reservoir trophic states and the response of phytoplankton in Guangdong Province. Acta Ecologiaca Sinica, 2003, 23(6): 1101- 1108.
[35] Wang Y, Wang H J, Zhao W H, Ru H J. Phytoplankton assemblage characteristics and their indication of water quality in the mainstream of the Yellow River. Journal of Lake Sciences, 2010, 22(5): 700- 707.
[36] Zhao X F, Hu Z Y, Yu J, Ge J H, Liu G Z. Study on the phytoplankton and water quality of Jihongtan reservoir in Qingdao. Acta Hydrobiologica Sinica, 2005, 29(6): 639- 644.
[37] Birch S, McCaskie J. Shallow urban lakes: Achallnge for lake management. Hydrobiologia, 1999, 395/396(0): 365- 378.
参考文献:
[1] 《中国湿地百科全书编辑委员会》. 中国湿地百科全书. 北京:北京科学与技术出版社, 2009.
[13] 国家环保总局《水和废水监测分析方法》编委会. 水和废水监测分析方法(第四版). 北京:中国环境科学出版社,2002:784- 784.
[15] 包文美, 王全喜, 瑞墨尔查. 长白山地区硅藻的研究. 植物研究, 1992, 12(2): 125- 143.
[16] 范亚文. 黑龙江省管壳缝目植物研究. 哈尔滨: 东北林业大学出版, 2004.
[20] 魏印心. 中国淡水藻志第七卷绿藻门, 双星藻目中带鼓藻科, 鼓藻目鼓藻科第一册. 北京: 科学出版社, 1998.
[33] 沈韫芬, 章宗涉,龚循矩,顾曼如,施之新,魏印心. 微型生物监测新技术. 北京:中国建筑工业出版社,1990.
[34] 林秋奇, 韩博平. 广东省大中型供水水库营养现状及浮游生物的响应. 生态学报,2003,23(6): 1101- 1108.
[35] 王勇, 王海军, 赵伟华, 茹辉军. 黄河干流浮游植物群落特征及其对水质的指示作用. 湖泊科学,2010, 22 (5):700- 107.
[36] 赵先富,胡征宇,于军, 葛建华, 刘国祥. 青岛棘洪滩水库浮游藻类状况及水质评价. 水生生物学报, 2005, 29 (6): 639- 644.
Relationships between environmental variables and seasonal succession inphytoplankton functional groups in the Hulan River Wetland
LU Xinxin, LIU Yan, FAN Yawen*
HeilongjiangProvincialKeyLaboratoryofBotany,HarbinNormalUniversity,Harbin150025,China
The Hulan River Wetland (N 45°54′—45°51′, E126°139′—127°14′) is located in the northeastern part of China, where climate conditions are similar to those in subtropical monsoon regions. The wetland, currently being restored, is China′s largest urban wetland. It has three distinct zones: an agricultural area, an industrial area and a reserve area. We recently carried out a survey of phytoplankton in the wetland, during which we collected samples from 10 sites in these three areas. In the survey, we identified 191 phytoplankton species that belonged to 69 genera, 17 families, 14 orders, 9 classes and 7 phyla. Bacillariophyta was the dominant class, followed by Chlorophyta and then Euglenophyta. Quantitative analysis showed that phytoplankton abundance increased from 1.23 × 10⁷ind/L in summer to 1.98 × 10⁷ind/L in autumn. The total average phytoplankton abundance in summer and autumn was 1.60 × 10⁷ind/L. There were obvious seasonal changes in the phytoplankton community structure, for exampleAnabaenaazoticaandScenedesmusprotuberanswere the dominant species in summer, while the most abundant species in autumn wereNavicularadiosaandTrachelomonasvolvocina.
The development of phytoplankton functional groups is an important achievement and has been a popular research topic in recent years. Phytoplankton functional groups simplify phytoplankton classification. They help us to arrange phytoplankton into groups based on ecological function so that we can understand phytoplankton adaptability to the environment. Phytoplankton functional groups may be based on classical taxonomy, morphological structure, physiological characteristics and ecological attributes. Phytoplankton functional groups can help us successfully process and combine changes in habitat and phytoplankton communities, and can explain how some habitat-specific phytoplankton taxa adapt to habitat change. This paper therefore aims to demonstrate how recently developed phytoplankton functional group classifications can effectively explain changes in phytoplankton in an urban wetland in response to environmental conditions.
We arranged the phytoplankton species data from the summer and autumn into 19 functional groups. The dominant assemblages in summer and autumn were from the X1/W2/MP/Lo/J functional groups. Groups such as X1/W2/MP/Lo/J were abundant in summer and autumn, while H1/Y/W1 groups were only detected in certain seasons and habitats. While groups D/P/TB appeared frequently, when compared with other groups, their relative abundance was lower. H1/MP/Lo/TB/J/G were the dominant functional groups in summer, while MP/J/W1/W2/X1/Y were dominant in autumn.

Canonical correspondence analysis was used to analyze the relationships between environmental variables and the seasonal succession of phytoplankton functional groups. Results showed that succession in the phytoplankton functional groups was largely determined by interactions between SpCond, TP and water temperature. Data suggest that the Hulan River Wetland may have been eutrophic during the study period. Nitrogen and phosphorus concentrations were above water quality standard thresholds, so the dominant indicator species in the wetland were those that were tolerant of polluted water.
phytoplankton functional groups; seasonal succession; environmental variables;Hulan River Wetland
国家自然科学基金(31070183,31270250);黑龙江省教育厅重点项目(12521z011);黑龙江省高校科技创新团队研究计划;哈尔滨师范大学科技创新团队研究计划(KJTD- 2011- 2)
2013- 06- 06;
2013- 11- 14
10.5846/stxb201306061369
*通讯作者Corresponding author.E-mail: fanyaw@163.com
陆欣鑫,刘妍, 范亚文.呼兰河湿地夏、秋两季浮游植物功能分组演替及其驱动因子.生态学报,2014,34(5):1264- 1273.
Lu X X, Liu Y, Fan Y W.Relationships between environmental variables and seasonal succession inphytoplankton functional groups in the Hulan River Wetland.Acta Ecologica Sinica,2014,34(5):1264- 1273.
