Model and Design of Cogeneration System for Different Demands of Desalination Water, Heat and Power Production*
2014-07-24WUXianli吴现力HUYangdong胡仰栋WULianying伍联营andLIHong
WU Xianli (吴现力), HU Yangdong (胡仰栋), WU Lianying (伍联营) and LI Hong (李 红)
College of Chemistry and Chemical Engineering, Ocean University of China, Qingdao 266100, China
Model and Design of Cogeneration System for Different Demands of Desalination Water, Heat and Power Production*
WU Xianli (吴现力), HU Yangdong (胡仰栋)**, WU Lianying (伍联营) and LI Hong (李 红)
College of Chemistry and Chemical Engineering, Ocean University of China, Qingdao 266100, China
In order to improve the energy efficiency, reduce the CO2emission and decrease the cost, a cogeneration system for desalination water, heat and power production was studied in this paper. The superstructure of the cogeneration system consisted of a coal-based thermal power plant (TPP), a multi-stage flash desalination (MSF) module and reverse osmosis desalination (RO) module. For different demands of water, heat and power production, the corresponding optimal production structure was different. After reasonable simplification, the process model of each unit was built. The economical model, including the unit investment, and operation and maintenance cost, was presented. By solving this non-linear programming (NLP) model, whose objective is to minimize the annual cost, an optimal cogeneration system can be obtained. Compared to separate production systems, the optimal system can reduce 16.1%-21.7% of the total annual cost, showing this design method was effective.
cogeneration system, thermal power plant, multi-stage flash desalination, reverse osmosis desalination, non-linear programming, optimal design
1 INTRODUCTION
A large amount of energy (electricity, heat) and water is consumed in daily lives and utility systems of process industry. With the reduction of resources and increase of consumption, it is necessary to establish a suitable and economical production system to provide sufficient water, thermal and electricity with lower energy consumption.
For a certain amount of water, heat and electricity demand, many different production structures can be applied to meet this demand. The styles of power generation can be back pressure, condensing and extraction condensing. Heat can be supplied by boiler or steam drawn from steam turbine. And multi-stage flash desalination (MSF), reverse osmosis desalination (RO) and other technologies for desalination can also be chosen.
It has been done extensive research on the separate system of power generation, heat addition and desalination. Several models have been established to describe these production units [1-3]. And the optimal operation parameters have been obtained [4-6]. Now the study on water, heat and power cogeneration system is mainly focused on three aspects: combined heat and power generation (CHP), MSF and power cogeneration system, RO/MSF hybrid system. As it can greatly improve energy efficiency and reduce the CO2emission, the combined heat and power (CHP) has been greatly developed [7]. Similar to the CHP, the low-grade steam of power plant as the heat source of MSF has been used in the MSF and power cogeneration system. The water production cost is effectively reduced. It was reported that the MSF energy cost can be reduced by 1/3 to 1/2 compared to the separate MSF system [8, 9]. RO/MSF hybrid systems have potential advantages of a higher overall availability, low power demand, and improved water quality [10]. Especially for the high salinity water, the hybrid system has a great advantage [11].
In this paper, combined with the above co-production systems, a new cogeneration system, including the coal-fired thermal power plant, the MSF system and RO desalination system, is established. A simplified superstructure model of the system is presented, which includes all the possible alternative configurations of the cogeneration system. And the mathematical model and economic model of cogeneration system are given, based on literature [12-19]. These maturity models can make an accurate evaluation of the process parameters and economic costs.
2 MATHEMATICAL AND ECONOMIC MODEL OF THE COGENERATION SYSTEM
In the process of power generation, heat addition and desalination, a lot of resource and energy is consumed. In the thermal power plant, where the extraction condensing turbines are widely used, the exhaust steam is condensed by cool water, which will take away a lot of heat, and reduce the efficiency of the energy usage. The steam used by residents heating and process heating in the plants, is relatively low grade, which can be provided by the thermal power plant. In terms of desalination, the multi-stage flash desalination will consume about 1 tone steam per 10 m3water produced. If the steam is supplied by the thermal power plant, the water production cost of MSF can greatly be reduced. At the same time, the thermal power plant will decrease the amount of condensate and waste heat. The RO needs to consume plenty of electricity. Ifthe power can be directly purchased from the power plant at cost price, the cost of the RO will significantly increase. Therefore, in a cogeneration system of water, heat and power, the energy can be used from high-grade to low-grade, which can effectively reduce the energy consumption of the entire system.
2.1 Superstructure of the cogeneration system
For given water, heat and power needs, the goal of system design is to determine the optimal structure of the cogeneration system. The super-structure of the simplified model is shown in Fig. 1. The system is mainly divided into three parts: the thermal power plant, the MSF system and the RO system.
Firstly, the boiler backwater is heated to high-pressure steam in Boiler 1. Then the steam is driven to the turbines. After the steam is used to generate electricity, it is partly pumped out for some other heat users, and partly used for heating the brine in MSF brine heater. If the power plant cannot provide sufficient steam to MSF system, the shortage is supplied by the auxiliary boiler: Boiler 2. The mass flow of supplement steam is Ms2. The electricity is partly used by MSF and RO, while the other is delivered to the grid. The product water from MSF and RO is mixed and then sold. The water production ratio of MSF module and RO module is decided by the demands of water, heat and power. The mathematical model to describe the modules of this super-structure is as blow.
2.2 Model of thermal power plant
In this paper, supercritical and adjustable pumping turbine-generator units are adopted. The simplified thermal power plant model is shown in Fig. 2. After treatments, the water is heated into steam in the boiler, and overheated to 24.2 MPa, and 566 °C. Superheated high pressure steam drives the high pressure turbine, medium-pressure turbine and low-pressure turbine successively to generate power. Appropriate pressure steam is pumped out from each turbine for MSF module and other heat users. Then the steam is condensed to water and returned to the boiler. The mathematic model of thermal power plant is shown as blow [12, 13]:
The boiler backwater is heated to superheated high pressure steam:


Figure 1 Superstructure of the cogeneration system

Figure 2 Schematic diagram of a thermal power plant
The generating capacity of turbine i is:

wheretr,1im−is the steam mass flow pumped out for MSF and other heat users in turbine 1i− .
The total generating capacity of the thermal power plant is:

Before driven to the medium-pressure turbine, the steam is overheated again in the boiler:

The total heat duty of the boiler is:

The mass flow rate of the coal is:

2.3 Model of MSF
MSF is divided into three different structures: OTMSF, MMSF and CMSF. In this paper, MSF with a brine mixer (MMSF) (see Fig. 3), including a brine distributor, a brine mixer, a heat recovery section and a brine heater four parts is adopted. The heat recovery section is composed of multiple flash units in series. The model of MMSF is adopting improved MSF-Once Through model [14].
The simplified model of MMSF is based on the following basic assumptions:
(1) The specific heat of all liquid streams is constant and equal.
(2) The temperature drop for the flashing brine per stage is equal.
(3) The latent heat of vaporization in each stage is assumed equal to the average value for the process.
(4) Non-condensable gases have negligible effect on the heat transfer process.
(5) Effects of the boiling point rise and nonequilibrium losses on the stage energy balance are negligible, however, their effects are included in the design of the condenser heat transfer area.
2.3.1 Overall material balance

The flow rate of distillate is calculated by Eq. (10) [14],

2.3.2 Brine heater and condensers heat transfer area
In this paper, the condensers heat transfer area of each stage is assumed equal. Condenser heat transfer area on stage 1 is:

Brine heater heat transfer area is:

The total heat transfer areas:

The steam required by MSF is:

wheres1M is the steam pumped from steam turbine ands2M is the steam provided by auxiliary boiler.

When χ=0, the steam of MSF module needed will be supplied by auxiliary boiler, or the MSF module will not product water. When χ=1, all the steam will be extracted from the turbine. The style of power generation will be changed from extraction condensing turbine to backpressure steam turbine.

Figure 3 Schematic diagram of multi-stage flash desalination

The coal consumed for the auxiliary boiler is:

2.4 Model of RO
2.4.1 RO membrane mass transfer model
The extensive researches on the reverse osmosis membrane mass transfer mechanism have been done. The schematic diagram of one stage reverse osmosis desalination is shown in Fig. 4. Now the often used model is the solution-diffusion model [14-17]:
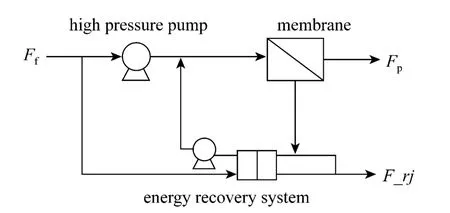
Figure 4 Schematic diagram of one stage reverse osmosis desalination
The pure water flux is:

The salt flux is given as:

Applied pressure is:

The osmotic pressure of seawater is:

Permeate concentration is:

Salt concentration at membrane wall is as shown in Eq. (28):

The density of seawater is:

Mass transfer coefficient is:

2.4.2 Material balance of RO
The RO module water production is:

The reject brine flow rate is:

The reject brine concentration is given as:

Recovery fraction is:

The total membrane area is:

2.5 Economic model
2.5.1 The economic model of thermal power plant [18] When the payback period is 25 years, the annual interest rate is 7% and the capital recovery factor is:

Direct capital investment is given by

Operation and maintenance cost is:

The fuel cost is:

The total annual cost of the thermal power plant is:

2.5.2 Economic model of MSF [14]
Direct capital investment is given as:

Chemical treatment is:

Spares cost is:

Labor cost is:

Fuel cost is:

The operation pressure of circulating brine Mris. The pump efficiency is taken as 0.8. The power requirement of MSF is:

The operation and maintenance cost is:

The annual cost of MSF is:

2.5.3 Economic model of RO
Membrane cost is given by:

Civil work cost is given by:

Pumping and energy recovery system cost is:

The direct capital investment cost is:

The Ratis the capacity ratio rate, which is expressed as:

The pretreatment cost (ultrafiltration) is [19]:

The annual membrane replacement cost is:

The annual labor cost is:

The power consumed of RO is given by the follow equations [20].
The electricity consumed by high pressure pump is:

The energy recovery from the energy recovery system is:

The RO module consumed electricity is:

The annual cost of RO is:

2.6 Objective function of mathematical programming model
The superstructure of the cogeneration system is shown in Fig. 1. Under a certain demand, the amount of electricity (WE), water (Wtotal) and heat (mtr) supply are constant values.
The power supply to the grid is given as:

where PMSFand PROare the consumed electricity of MSF module and RO module.
The water produced by the entire cogeneration system is:
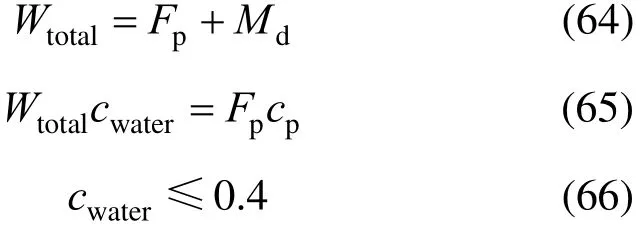
And the mass flow rate of the heat supply is given by:

The optimization design of the cogeneration system is presented as a non-linear programming (NLP)and solved by GAMS program. The generalized reduced gradient algorithm CONOPT is used as NLP solver. Since the problem presents a lot of non-convexities, several local optimal solutions is obtained from different initial points. Then the best local optimal solution is selected as the global optimal solution. The objective is to minimize the annual cost of the cogeneration system.

The model satisfies the constraints of thermodynamics, unit operations and the design requirements.
3 CASE STUDY
In this paper, a chemical park is taking as an example. According to different demands of water, heat and power production, optimal cogeneration systems were given. For comparison, two separate production systems were shown. One was thermal power plant for providing power and heat, and MSF plant for production water using steam form steam generator (TPP + MSF). The other was thermal power plant for providing power and heat, and RO plant (TPP + RO) for production water using electricity produced by TPP.
3.1 Case 1
The main project of this chemical industry park is an annual output 1 million tons of soda ash production plant. The process consumes a lot of water, heat and power. A suitable cogeneration system is needed to meet this demand. The specific needs of this industry park are shown in Table 1.

Table 1 Demands of water, heat and power production
The parameters of cogeneration system are shown in Tables 2-4. Bringing these parameters and the valueof power, steam and water into the model, then the optimal results is obtained by solving this NLP model.

Table 2 Process parameters of thermal power plant

Table 4 Process parameters of RO

Table 5 Optimal results of the cogeneration system
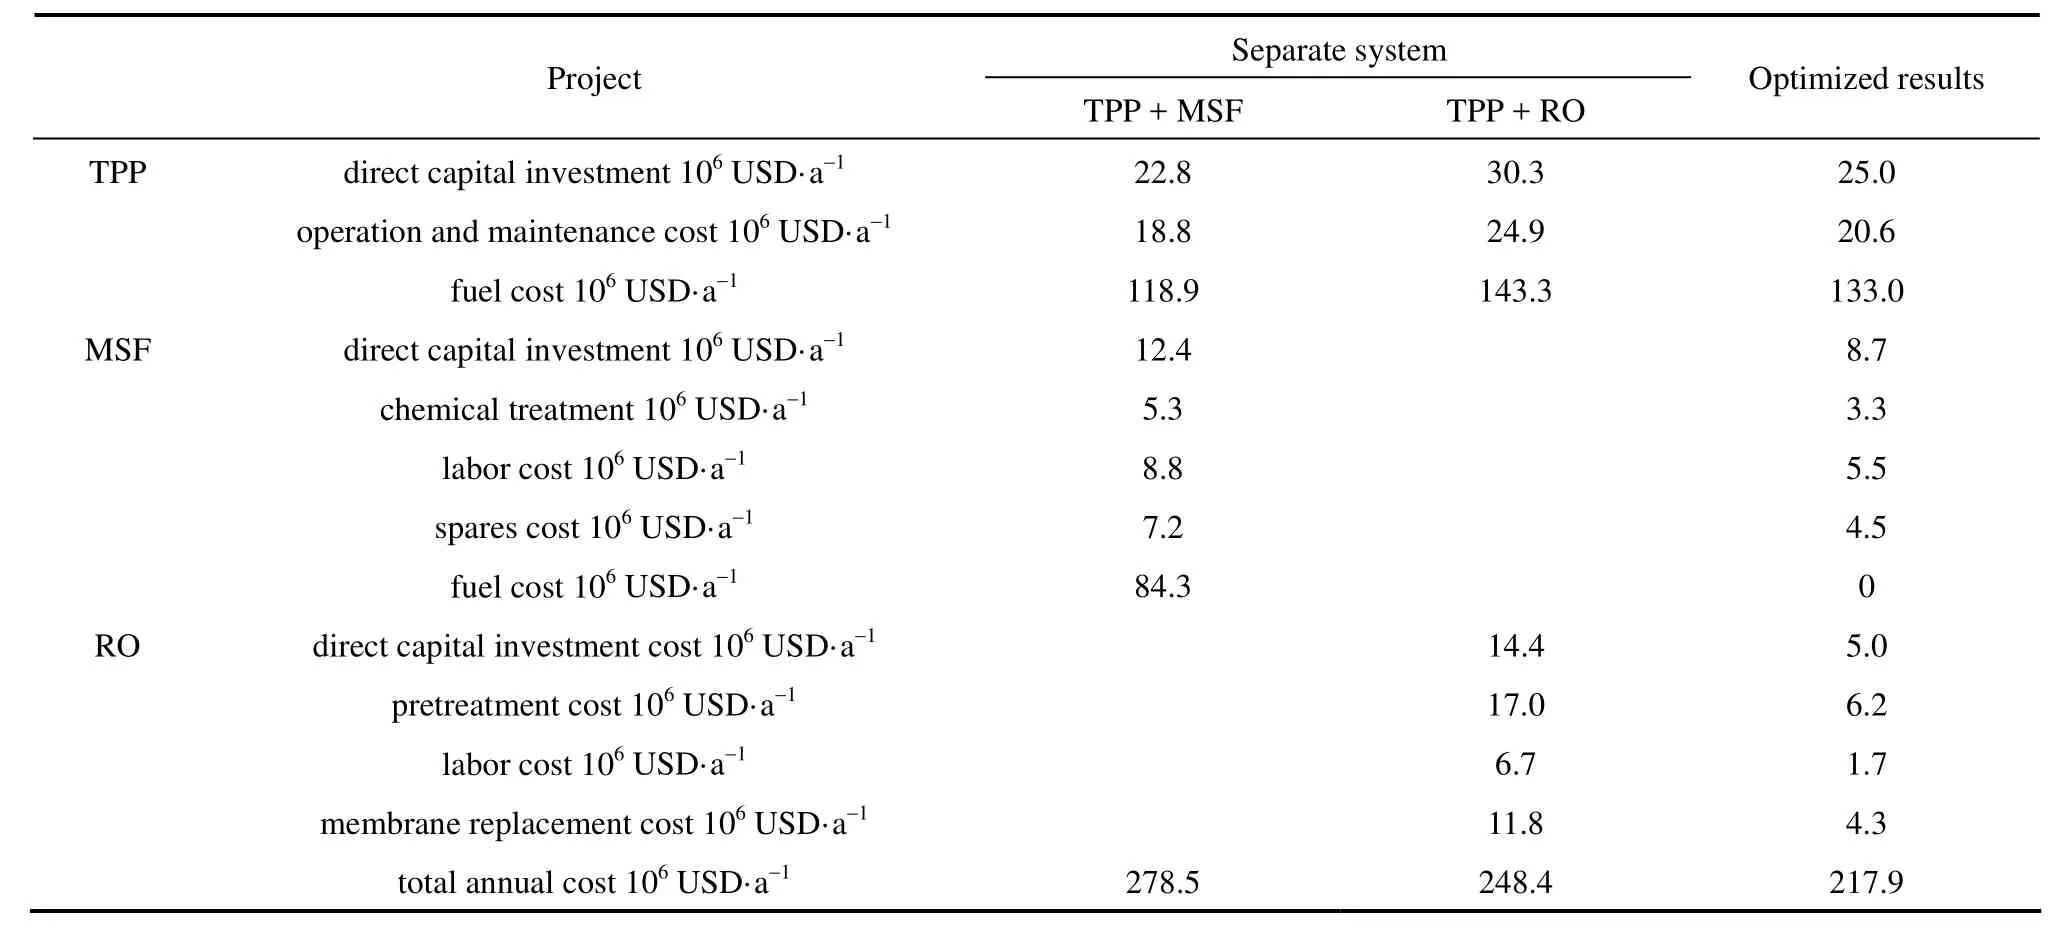
Separate system Project TPP + MSF TPP + RO Optimized results TPP direct capital investment 106USD·a−1 22.8 30.3 25.0 operation and maintenance cost 106USD·a−1 18.8 24.9 20.6 fuel cost 106USD·a−1 118.9 143.3 133.0 MSF direct capital investment 106USD·a−1 12.4 8.7 chemical treatment 106USD·a−1 5.3 3.3 labor cost 106USD·a−1 8.8 5.5 spares cost 106USD·a−1 7.2 4.5 fuel cost 106USD·a−1 84.3 0 RO direct capital investment cost 106USD·a−1 14.4 5.0 pretreatment cost 106USD·a−1 17.0 6.2 labor cost 106USD·a−1 6.7 1.7 membrane replacement cost 106USD·a−1 11.8 4.3 total annual cost 106USD·a−1 278.5 248.4 217.9
The optimal results are shown in Table 5.
The comparison of annual cost among the optimized cogeneration systems and other two separate production systems is shown in Table 6.
3.2 Case 2
The water, heat and power demand of the chemical industry park is appropriate changed. Then the optimal production structure of the cogeneration system after the demand changed is studied. The changedwater, heat and power demands are shown in Table 7.

Table 7 Demands of water, heat and power production
The process parameters of TPP, MSF and RO are the same as these parameters in Case 1.
The optimal results are shown in Table 8. The comparison of annual cost among the optimized cogeneration systems and other two separate production systems is shown in Table 9.
The above two cases reveal that with different demands of water, heat and power, the corresponding optimal cogeneration structures are also different. In Case 1, the optimal cogeneration system is TPP generating electricity and heat, and MSF and RO hybrid system producing water. This is because water production requirement in Case 1 is relatively high. If the system only uses MSF to produce water, the auxiliary boiler needs to provide a certain amount of steam, leading to higher total annual cost. If the system only uses RO to produce water, in order to meet the water quality requirements, two stages RO system should be adopt, and the annual cost is also relatively high. When MSF and RO are used at the same time, additional steam is not needed, and the total annual cost is the lowest. Compared to the other two separate production structures, the optimal cogeneration system can reduce 21.7% of the annual cost.
In Case 2, the TPP can supply the MSF with more steam and water production requirement is reduced. Thus the steam can meet the need of MSF. Therefore, the optimal cogeneration system is TPP generating electricity and heat, and MSF producing water. Compared to the other two structures, 16.1% of the annual cost can be reduced.
4 CONCLUSIONS
In this paper, a cogeneration system for water, heat and power production was studied. An optimal design method was given. The unit models and cogeneration system model were established. The system design was presented as a non-linear programming (NLP) and solved by GAMS program.
According to different demands of water, heat and power production, an optimal cogeneration system can be obtained by solving this model. The result showed that using exhaust steam from power plant as heat source, the MSF can be used as a priority water production style. The production capacity of MSF wassubjected to the amount of steam extracted from the thermal power plant. When the demand of water supply was higher than the MSF production capacity, the MSF and RO cogeneration system will be a better choice. Compared to separate systems, the optimal system can reduce 16.1%-21.7% of the total annual cost. Subsystems involved in this study such as combined heat and power generation (CHP), MSF and power cogeneration system, RO/MSF hybrid system have been widely used, and the technologies were relatively mature. After a suitable production scheduling, the new cogeneration system can also be achieved. It indicated that this design method was effective.

Table 8 Optimal results of the cogeneration system
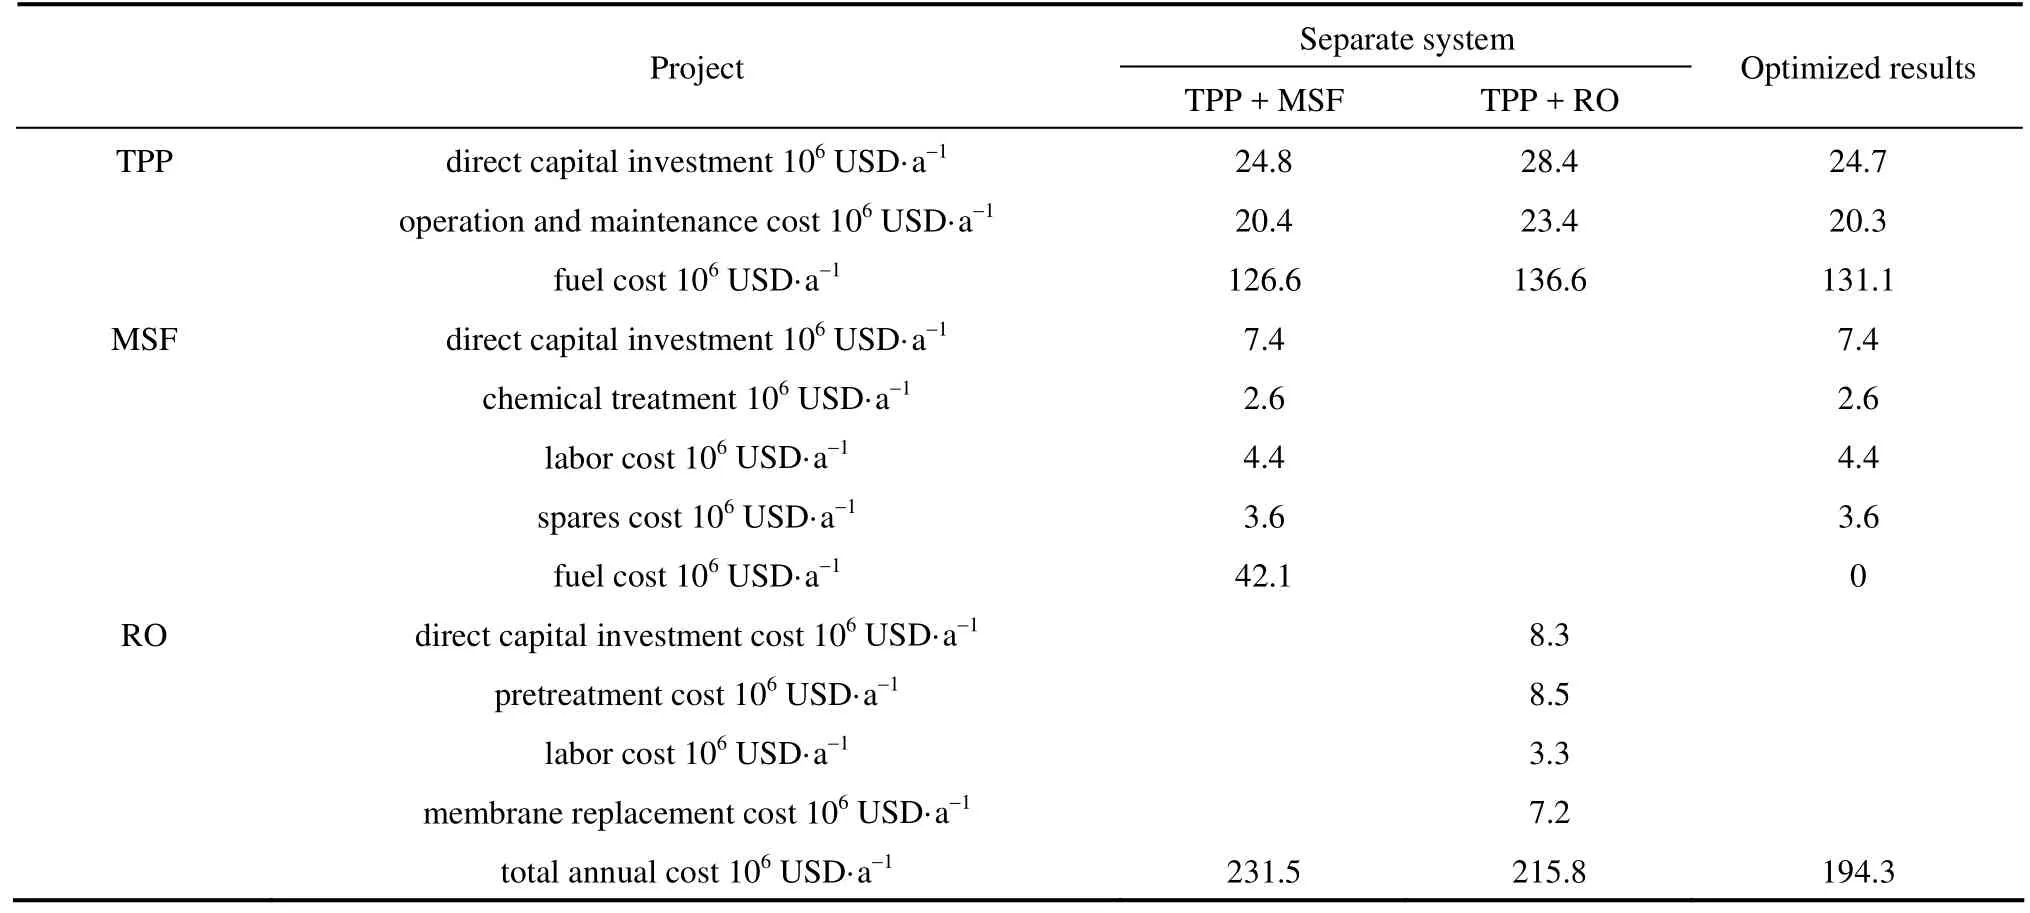
Table 9 Comparison of annual cost of optimized cogeneration systems and other two separate production systems
NOMENCLATURE
A total heat transfer area, m2
Accondenser heat transfer area, m2
Abbrine heater heat transfer area, m2
Amemone membrane area, m2
Assalt mass transfer parameter, m·s−1
Atotaltotal membrane area, m2
Awwater permeability coefficient, m·s−1·Pa−1
a capital recovery factor
BPE boiling point elevation, °C
CAMMSF total annual cost, USD·a−1
CcaptialTPP direct capital investment, USD·a−1
CcheMSF chemical treatment cost, USD·a−1
CcivilRO civil work cost, USD·a−1
CDMMSF direct capital investment, USD·a−1
CfuelTPP fuel cost, USD·a−1
Cfuel,1MSF fuel cost, USD·a−1
ClabMSF labor cost, USD·a−1
Cmemtotal membrane cost, USD·a−1
COMMSF operation and maintenance cost, USD·a−1
CopTPP operation and maintenance cost, USD·a−1
CpowerTPP total annual cost, USD·a−1
Cpumppumping and recovery system cost, USD
CRO,totalRO total annual cost, USD·a−1
CsparMSF spares cost, USD·a−1
Ctotalannual cost of the cogeneration system, USD·a−1
c salt concentration, kg·m−3
cfseawater concentration, kg·m−3
cpheat capacity, kJ·t−1·°C−1
cppermeate concentration, kg·m−3
cwsalt concentration at membrane wall, kg·m−3
cwaterfinished water concentration, kg·m−3
cost1RO direct capital investment, USD·a−1
cost2RO pretreatment cost, USD·a−1
cost3RO annual membrane replacement cost, USD·a−1
cost4RO annual labor cost, USD·a−1
costmemone membrane cost, USD
c_rj reject brine concentration, kg·m−3
Eppenergy required for pre-post-treatment plant
Erecenergy recovery from energy recovery system, kW·m−3
Ereqelectricity consumed by high pressure pump, kW·m−3
Eff efficiency of high pressure pump
Effrecefficiency of energy recovery system
Fffeed seawater flow rate, t·h−1
Fpproduct water flow rate, t·h−1
F_rj reject brine flow rate, t·h−1
h enthalpy of steam or liquid, kJ·t−1
i annual interest rate
k1mass transfer coefficient, m·s−1
Lamdas latent heat of steam, kJ·t−1
LHV lower heat value of coal, kJ·t−1
LMTD logarithmic mean temperature difference, °C
LMTDclogarithmic mean temperature difference of condenser, °C
LMTDblogarithmic mean temperature difference of brine heater, °C
Mbbrine flow rate, t·h−1
Mddistillate flow rate, t·h−1
Mffeed seawater of MSF, t·h−1
Mrflow rate of recycle brine, t·h−1
Msthe steam of MSF needed, t·h−1
m parameter defined in Eq. (30), °C
mcombthe boiler steam mass flow rate, t·h−1
mfuelcoal consumed by TPP, t·h−1
mfuel,1coal consumed by MSF, t·h−1
mtrmass flow rate of steam extracted from turbine, t·h−1
Nmemnumber of membrane per train
Ntrainnumber of trains
Nssalt flux, kg·m−2·s−1
Nwpure water flux, m·s−1
NEA non-equilibrium allowance, °C
n number of flash stage
PMroperation pressure of circulating brine, Pa
PMSFMSF module consumed electricity, kW
PRORO module consumed electricity, kW
p1operated pressure, Pa
p2atmospheric pressure, Pa
Q heat duty of boiler, kJ·h−1
Qrefreference RO plant capacity, m3·d−1
Rfrecovery fraction
T temperature of flash stage, °C
Trtemperature of recycle brine, °C
Tvtemperature of distillate, °C
t payback period, year
Ubthe brine heater overall heat transfer coefficient, kW·m−2·°C−1
Ucthe condenser overall heat transfer coefficient, kW·m−2·°C−1
ubvelocity of brine, m·s−1
WEthe electricity supply to the grid, kW
Wtotalthe total water production, t·h−1
We the electricity generating capacity, kW
χbthe concentration of brine, kg·L−1
χfthe concentration of seawater, kg·L−1
y parameter defined in Eq. (11)
η efficient
λavaverage latent heat of brine, kJ·t−1
Π osmotic pressure, Pa
ρ density, kg·m−3
ρpdensity of permeate water
Ψ parameter
REFERENCES
1 Helal, A.M., “The one-throught MSF design for future large capacity desalination plants”, Desalination, 166, 25-39 (2004).
2 Mussati, S.F., Aguirre, P.A., Scenna, N.J., “Novel configuration for multi stage flash-mixer desalination system”, Ind. Eng. Chem. Res., 42 (20), 4828-4839 (2003).
3 Malek, A., Hawlader, M.N.A., “Design and economics of RO seawaterdesalination”, Desalination, 105, 245-261 (1996).
4 Mussati, S.F., Aguirre, P.A., Scenna, N.J., “Optimal MSF plant design”, Desalination, 138, 341-347 (2001).
5 Du, X.Z., Wu, S.R., “Performance of seawater desalination system coupled with nuclear heating reactor under unsteady state operation conditions”, CIESC Journal, 54 (3), 362-367 (2003).
6 Li, Q.F., Liu, Z.L., Han, B., Pang H.Z., Zhang, J., Zhu, W., “Process simulation and analysis of thermal vapor compression based oilfield waster desalination systems”, CIESC Journal, 63 (6), 1859-1864 (2012).
7 Martens, A., “The energetic feasibility of CHP compared to the separate production of heat and power”, Applied Thermal Engineering, 18 (11): 935-946 (1998).
8 Hammond, R.P., “Modernising the desalination industry”, Desalination, 107, 101-109 (1996).
9 Buros, O.K., The ABCs of Desalting, International Desalination Association, Massachusetts, USA (1999).
10 Marian, G., Marcovecchio, M.G., Sergio, F., “Optimization of hybrid desalination processes including multi stage flash and reverse osmosis systems”, Desalination, 182, 111-122 (2005).
11 Turek, M., Dydo, P., “Hybrid membrane-thermal versus simple membrane systems”, Desalination, 157, 51-56 (2003).
12 Kamal, I., “Integration of seawater desalination with power generation”, Desalination, 180, 217-229 (2005).
13 Bruno, J.C., Fernandez, F., Castells, F., Grossmann, L.E., “A rigorous MINLP model for the optimal synthesis and operation of utility plants”, Tran IChemE, 76, 246-258 (1998).
14 Al-Khudhiri, A.I., “Optimal design of hybrid MSF/RO desalination plants”, Ph. D. Thesis, Saudi Arabia (2006).
15 Taniguchi, M., Kimura, S., “Estimation of transport parameters of RO menbranes for seawater desalination”, AIChE Journal, 46 (10), 1967-1973 (2000).
16 Hu, Y.D., Lu, Y.Y., Xu, D.M., Wu, L.Y., “Cleaning strategy of membrane modules in reverse osmosis seawater desalination system”, CIESC Journal, 56 (3), 499-505 (2005).
17 Wang, Y., Wang, S.C., Xu, S.C., “Hydraulic energy recovery for SWRO desalination plants”, CIESC Journal, 54 (6), 878-879 (2003).
18 El-Nashar, A.M., “Cogeneration for power and desalination-state of the art review”, Desalination, 134, 7-28 (2001).
19 Helal, A.M., El-Nashar, A.M., “Optimal design of hybrid RO/MSF desalination plants Part I: Modeling and algorithms”, Desalination, 154, 43-66 (2003).
20 Cardona, E., Piacentino, A., Marchese, F., “Energy saving in two-stage reverse osmosis systems coupled with ultrafiltration processes”, Desalination, 184, 125-137 (2005).
PROCESS SYSTEMS ENGINEERING AND PROCESS SAFETY
Chinese Journal of Chemical Engineering, 22(3) 330—338 (2014)
10.1016/S1004-9541(14)60036-7
2012-10-29, accepted 2013-04-28.
*Supported by the National Natural Science Foundation of China (21076202).
**To whom correspondence should be addressed. E-mail: ydhuhd@ouc.edu.cn
杂志排行
Chinese Journal of Chemical Engineering的其它文章
- A Bi-component Cu Catalyst for the Direct Synthesis of Methylchlorosilane from Silicon and Methyl Chloride
- Hydrodynamics and Mass Transfer of Oily Micro-emulsions in An External Loop Airlift Reactor
- Effects of Shape and Quantity of Helical Baffle on the Shell-side Heat Transfer and Flow Performance of Heat Exchangers*
- A Contraction-expansion Helical Mixer in the Laminar Regime*
- Preparation and Characterization of Sodium Sulfate/Silica Composite as a Shape-stabilized Phase Change Material by Sol-gel Method*
- Determination of Transport Properties of Dilute Binary Mixtures Containing Carbon Dioxide through Isotropic Pair Potential Energies
