Body Surface Area Prediction in Odorrana grahami
2014-07-01GuiyingCHENJiongyuLIUQiangDAIandJianpingJIANG
Guiying CHEN, Jiongyu LIU, Qiang DAIand Jianping JIANG
1Chengdu Institute of Biology, Chinese Academy of Sciences, Chengdu 610041, China
2Department of Biology, Sichuan Normal University, Chengdu 610101, China
Body Surface Area Prediction in Odorrana grahami
Guiying CHEN1,2, Jiongyu LIU1*, Qiang DAI1and Jianping JIANG1
1Chengdu Institute of Biology, Chinese Academy of Sciences, Chengdu 610041, China
2Department of Biology, Sichuan Normal University, Chengdu 610101, China
Body surface area (BSA) was regarded as a more readily quantif i able parameter relative to body mass in the normalization of comparative biochemistry and physiology. The BSA prediction has attracted unceasing research back more than a century on animals, especially on humans and rats. Few studies in this area for anurans were reported,and the equation for body surface area (S) and body mass (W): S = 9.9 W0.56, which was concluded from toads of four species in 1969, was generally adopted to estimate the body surface areas for anurans until recent years. However, this equation was not applicable to Odorrana grahami. The relationship between body surface area and body mass for this species was established as: S = 15.4 W0.579. Our current results suggest estimation equations should be used cautiously across different species and body surface area predictions on more species need to be conducted.
body mass, body surface area, estimation equation, Odorrana grahami
The requirement for more precise BSA prediction increased with further study in comparative biochemistry and physiology in skin secretions of amphibians. Abundant active molecules, especially antimicrobial peptides, have been found in the skin secretions of Odorrana grahami (Boulenger, 1917) (Anura: Ranidae)from two locations: Mianning, Sichuan province and Kunming, Yunnan province, China, implying this species was a good research object to compare the skin secretion of amphibians with geographical interval. The isolation,characterization and quantif i cation of skin secretions of O. grahami from different sites and seasons were currently ongoing in our laboratory. The estimation of the BSA for O. grahami was a necessary and related work; however,we found the generally adopted equation (1) was not applicable to this species (see below). Here, we report the relationship, expressed by the equation, between body mass and BSA for O. grahami for the f i rst time.
Animals used for BSA measurement were captured in a stream approximately two meters in width located in Mianning, Sichuan province on 25 July and 18 September 2010 (E 102° 9.175′, N 28° 32.833′, altitude 1804 m). The animals were anesthetized with chlorobutanol. Body masses were recorded and the male and female adults were distinguished by the secondary sex characters of males: forelimb distinctly thickened, the inner dorsal side of the base of the first finger with a strong nuptial pad,dorsal sides of body with lineae musculinae. Individuals,the size smaller than the minimum male, difficult to sex were designated as subadults. A wrap method was used to measure the BSA (Jaworski and Holm, 1992). The protective paper adhered on the Paraf i lm®(Cat No. 701605) was cut to thin strips or pieces, and then were stuck with the reserved side on the skin. The approximate BSA was calculated by the equation:
BSA (cm2) = area of total paper (cm2) − area of left paper (cm2).
The average of two measurements was used for analysis. The animal protocols were approved by the Animal Care and Use Committee of the Chengdu Institute of Biology, Chinese Academy of Sciences.
All statistical analyses were run in SPSS®Statistics(v 21.0, IBM-SPSS Inc., Chicago, Il, USA) unless specif i ed. Where appropriate, normality was tested using Kolmogorov-Smirnov's and homogeneity using Levene's tests. In consideration of sexual dimorphism, one-way analysis of covariance (ANCOVA) was used to compare slopes and intercepts of regression lines for the males,females and subadults performed by GraphPad Prism®(version 5.0, GraphPad Software, San Diego, CA, USA). If neither the slopes nor the intercepts differed, a common regression equation could be given. The BSAs measured in July were used for linear regression of log10S on log10W by the method of two-stage least-squares. The BSAs measured in September were used to further verify the validity for the derived equation and the empirically predictive equation (1) by using a one-way analysis of variance (ANOVA) and Tukey's post hoc test. The accuracy and robustness of the predictive function by regressing measured BSA on predicted BSA were tested.
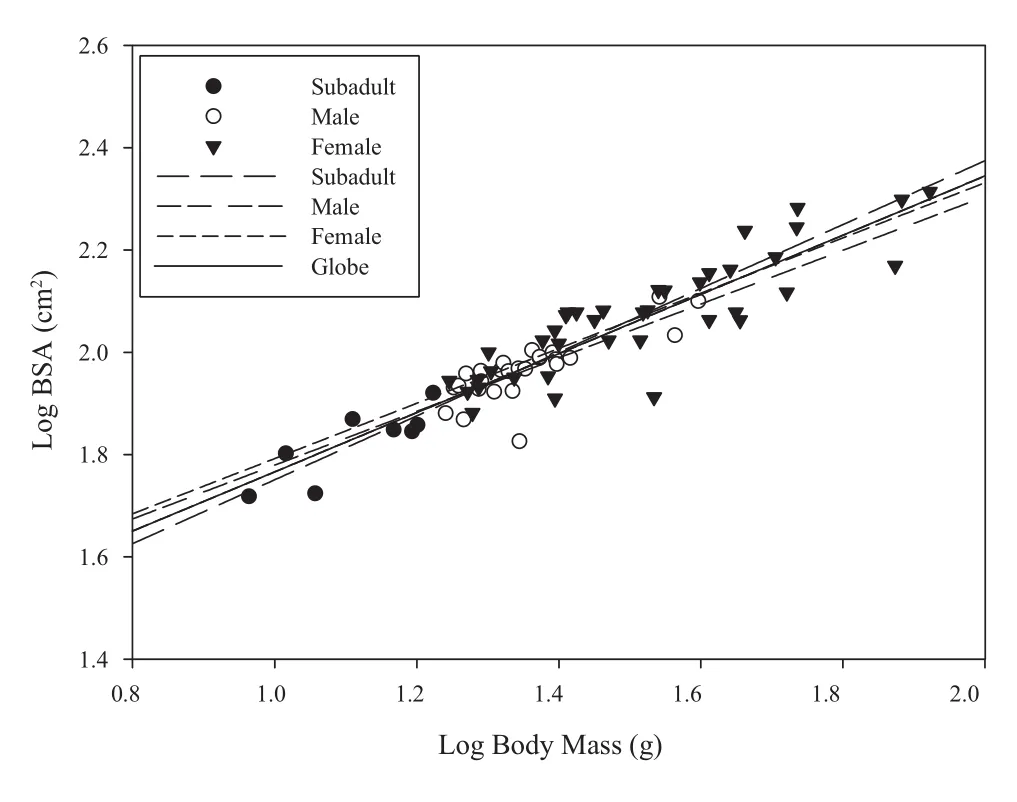
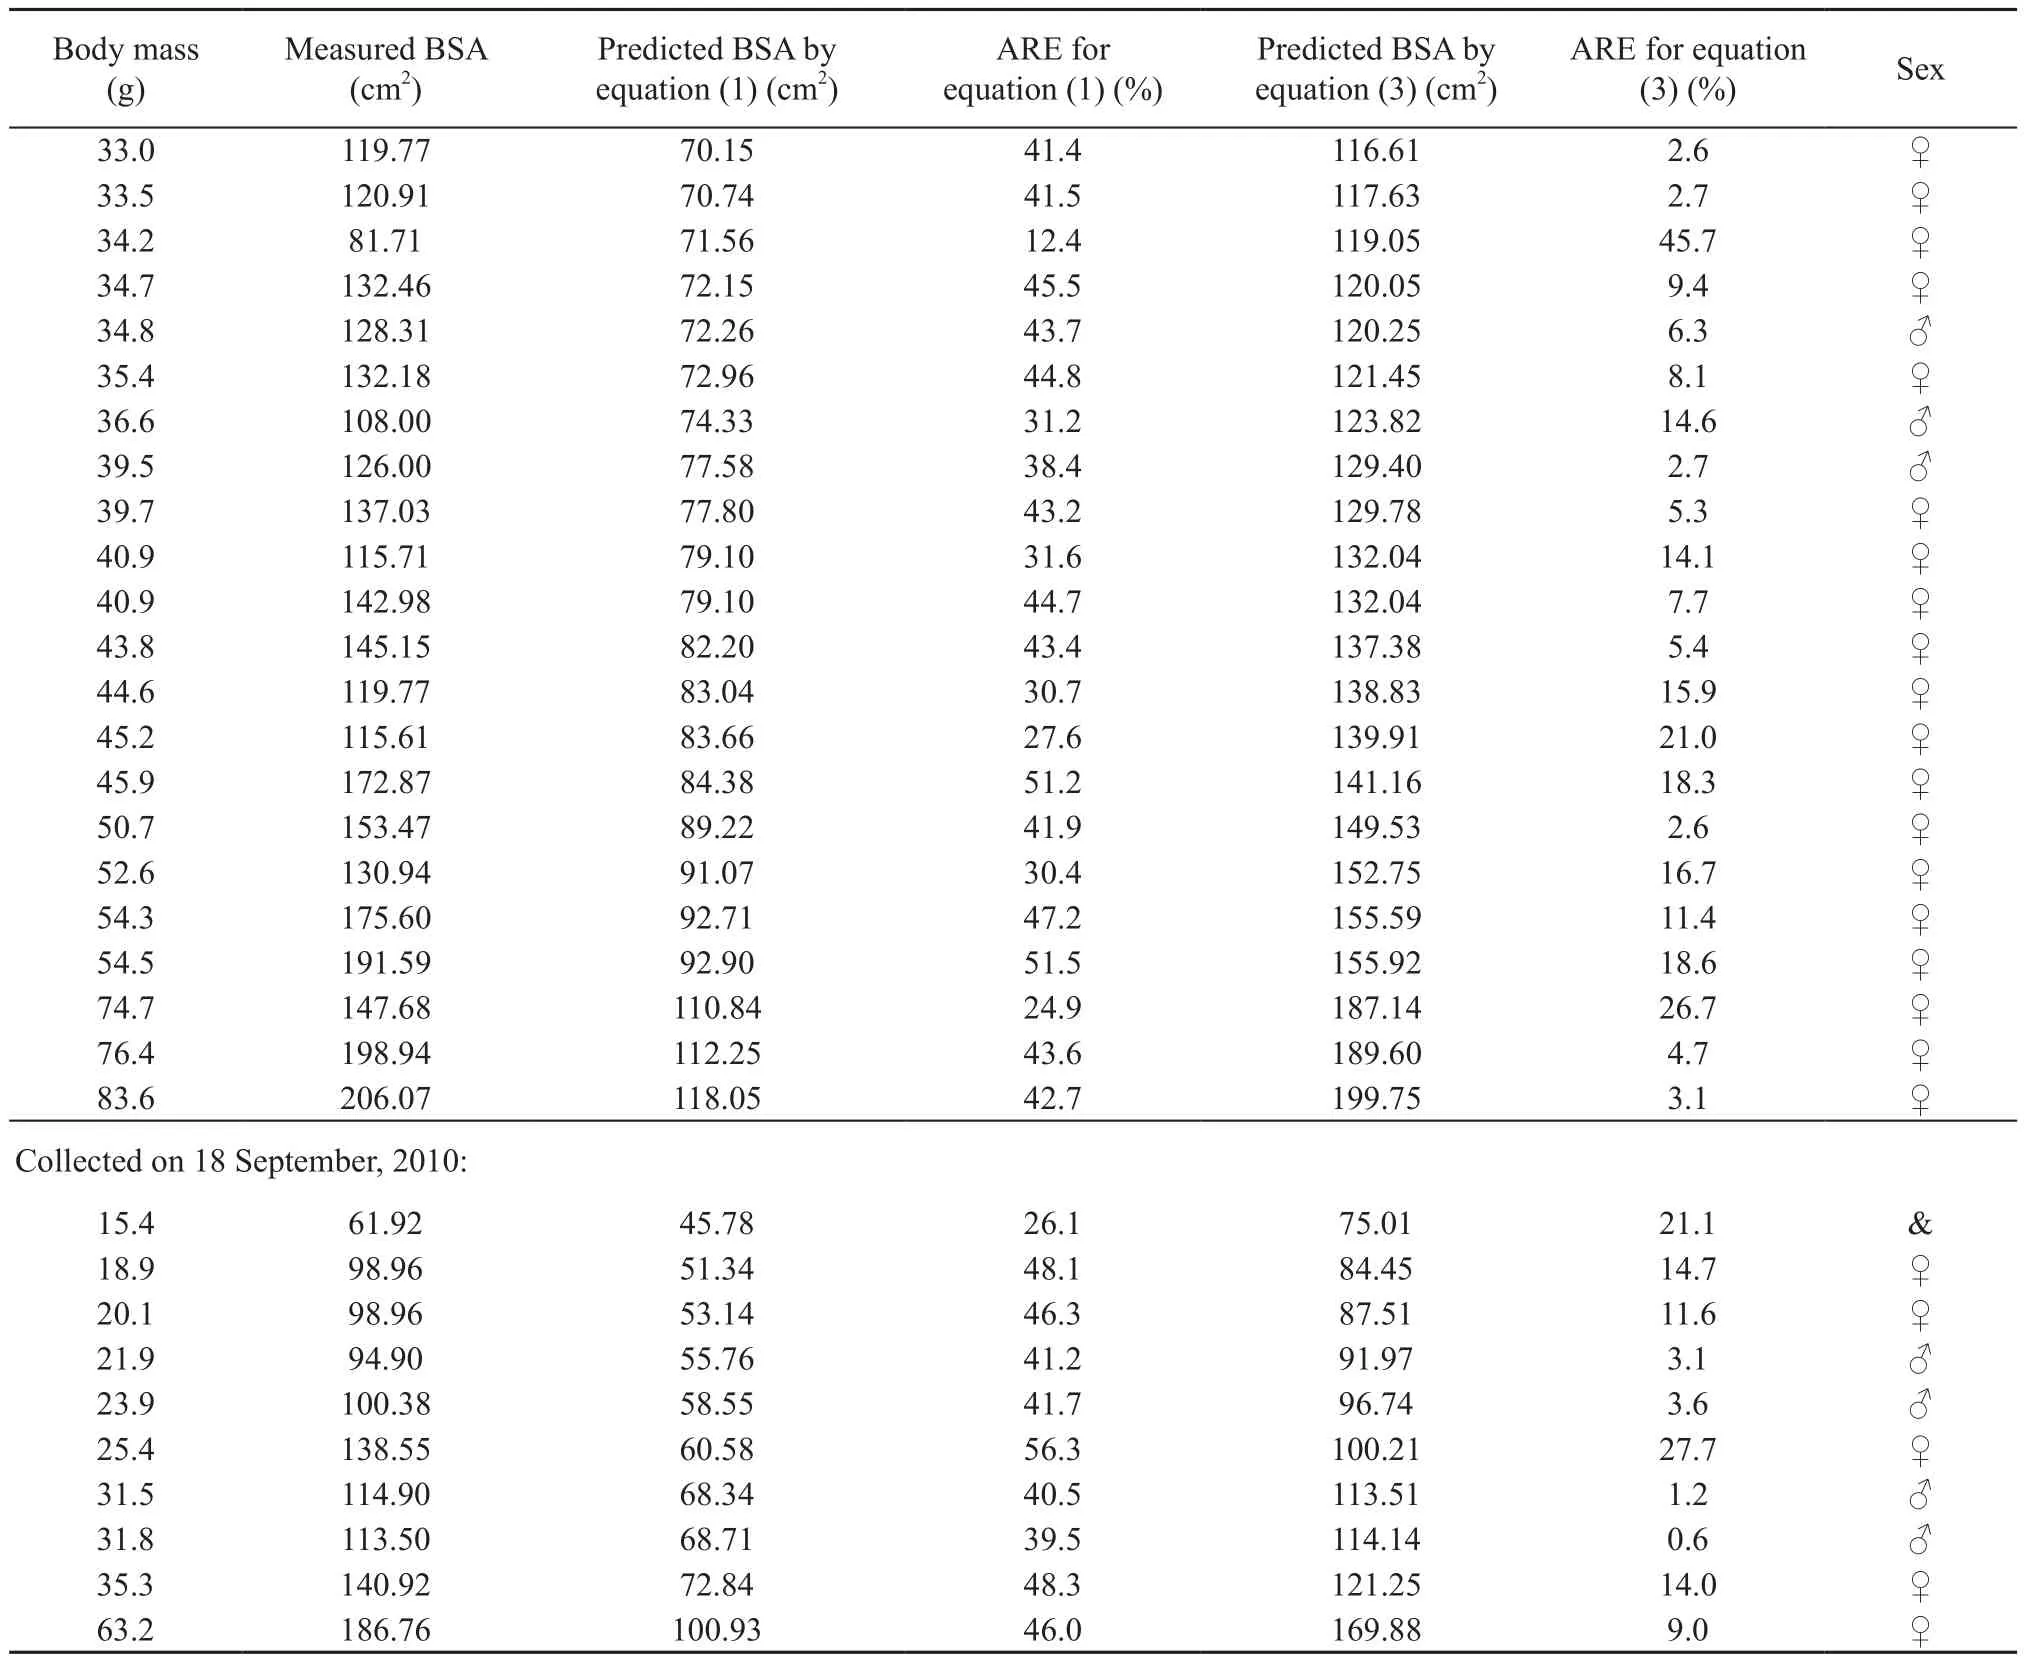
The measured body mass and BSA in July (n = 73, 8 subadults, 39 females, 26 males) are shown in Table 1. The results of ANCOVA indicated that the three regression lines were identical among males, females and subadults, since the differences among these slops(F2,67= 0.132, P = 0.877) and intercepts (F2,69= 0.894, P = 0.414) were not signif i cant (Figure 1). Thus, the BSA of O. grahami relative to body mass was concluded to be the common equation: log10S = 1.187 + 0.579 log10W(2) (F1,71= 386.197, r2= 0.843, P < 0.001) with the 95% conf i dence interval for the slope 0.520 - 0.638. The mean absolute relative error (%) with one standard error (1SE)between the measured BSA and predicted BSA was 7.8(1.7) for subadults, 10.6 (1.4) for females, 5.9 (1.4) for males and 8.6 (0.9) for total (Table 1).

Table 1 BSA estimated by equation (1) and (3).
Equation (2) was transformed to equation: S = 15.4(3). The predicted BSA was calculated by using the equation (1) and (3) respectively, based on the corresponding measured body mass in September (n = 10) shown in Table 1. Differences among the measured BSA and the predicted BSA was signif i cant by ANOVA (F2,27= 10.593, P < 0.001), Tukey's post hoc comparisons indicated that the measured BSA was significantly different from predicted BSA by equation (1) (P < 0.001),whereas was not significantly different from predicted BSA by the equation (3) (P = 0.706), hence, the equation(1) with mean absolute relative error (%) 43.4 (1SE: 2.5) was not applicable to the BSA prediction for O. grahami (Table 1). The regression line describing the relationship between measured BSA and predicted BSA calculated by equation (3) was significant (measured BSA = 1.156 × predicted BSA - 6.980;= 43.138,r2= 0.824, P < 0.001) with the 95 % conf i dence interval for the slope 0.750-1.562. The regression parameters (e.g. slope approach to 1, intercept approach to 0 and high r2)indicate that the predicted BSA was approximate to the measured BSA with mean absolute relative error (%) 10.7(1SE: 2.8) (Figure 2, Table 1), hence, the equation (3) was applicable to the BSA prediction for O. grahami.
The exponent 0.579 of the present reported equation(3) was the same as that given by Hutchison et al. (1968). We speculated they reported the log10k as k. Thus,the present estimation equation for O. graham would approximate to the adjusted equation given by them. The equation (1) was concluded merely from anurans of four species: Scaphiopus couchi, Bufo punctatus, B. boreas and B. cognatus, although it has been confirmed to be a good estimation of BSA for Litoria caerulea and L. chloris (Buttemer, 1990). These toads were much stouter than the O. grahami, therefore, it is reasonable that the estimation BSA by the equation (1) concluded from the toads was different with the equation (3) concluded from O. grahami (Table 1). Our current results suggested the estimation equations for BSA should be used cautiously in different species and the BSA predictions on more species needed to be conducted.
Acknowledgements We thank Feng XIE and Gang WEI kindly read and commented on an early version of this manuscript. This work was supported by National Natural Science Foundation of China (30800100) and Science and Technology Off i ce of Guiyang, China (2012204-28).

Figure 1 The relationship between body mass and BSA based on the measured data collected in July 2010 (n = 73, 8 subadults, 39 females, 26 males).
Buttemer, W.A. 1990. Effect of temperature on evaporative water loss of the australian tree frogs Litoria caerulea and Litoria chloris. Physiol Zool, 63: 1043-1057
Hutchison, V.H., Whitford, W.G., Kohl, M. 1968. Relation of body size and surface area to gas exchange in anurans. Physiol Zool, 41: 65-85
Jaworski, A., Holm, J.C. 1992. Distribution and structure of the population of sea lice, Lepeophtheirus salmonis Krøyer,on Atlantic salmon, Salmo salar L., under typical rearing conditions. Aquac Res, 23: 577-589
McClanahan, J., Lon, Baldwin, R. 1969. Rate of water uptake through the integument of the desert toad, Bufo punctatus. Comp Biochem Physiol, 28: 381-389
Supplemental Materials

Continued Supplemental S1
Supplemental S2 References in which the equation
(1) was adopted to estimate BSAs for some species of anurans without verifying the validation [1-3],
[1] Christian K., Parry D. 1997. Reduced rates of water loss and chemical properties of skin secretions of the frogs Litoria caerulea and Cyclorana australis. Aust J Zool, 45:13-20
[2] Gammill W. M., Scott F. J, Rollins-Smith L. A. 2012. Norepinephrine depletion of antimicrobial peptides from the skin glands of Xenopus laevis. Dev Comp Immunol, 37: 19-27
[3] Withers P. C., Hillman S. S. 1982. Water loss and nitrogen excretion in sharp-nosed reed frogs (Hyperolius nasutus: Anura,Hyperoliidae). J Exp Biol, 97: 335-43
Supplemental S3 Introduction and parameters for comparison of several regression lines by ANCOVA.
Zar [4] gives a method for comparing the slopes and intercepts of regression lines using analysis of covariance(ANCOVA). This analysis is available as a module for linear regression in GraphPad Prism®, and was widely used [5-7]. The starting point is to compare the slopes using an F-test. If the slopes are not signif i cantly different (i.e., P > 0.05) then it is possible to use a further F-test to compare the intercepts to decide whether the lines are identical. If P for this comparison is > 0.05, then one can conclude that the lines are identical.
In the present research, the parameter for ANCOVA was set as following:
1. Comparing the slopes
Dependent variable: log10S
Fixed factor: group (subadult, male and female)
Covariate: log10W
Model (input in the order): x, group, x*group
Sum of squares: TypeI
Result: P of x*group > 0.05
2. Comparing the intercepts
Same as 1 except the x*group was removed from the Model, i.e., the interaction between the covariate and fi xed factor was not considered in this step.
Result: P of group > 0.05
[4] Zar J. H. 2009. Comparing Simple Linear Regression Equations Biostatistical analysis. (5thed.) Prentice-Hall, Chapter 18, 372-375
[5] Kotronen A., Juurinen L., Tiikkainen M., Vehkavaara S., Yki-Järvinen H. 2008. Increased liver fat, impaired insulin clearance, and hepatic and adipose tissue insulin resistance in type 2 diabetes. Gastroenterology, 135: 122-130
[6] Tommasini S. M., Nasser P., Jepsen K. J. 2007. Sexual dimorphism affects tibia size and shape but not tissue-level mechanical properties. Bone, 40: 498-505
[7] Battino D., Croci D., Rossini A., Messina S., Mamoli D., Perucca E. 2003. Serum carbamazepine concentrations in elderly patients: A case matched pharmacokinetic evaluation based on therapeutic drug monitoring data. Epilepsia, 44: 923-929
10.3724/SP.J.1245.2014.00054 Body surface area (BSA) was regarded as a more readily quantifiable parameter relative to body mass in the normalization of comparative biochemistry and physiology. The BSA prediction has attracted unceasing research back more than a century on animals, especially on humans and rats. The well know equation for estimating BSA was the Meeh equation, which related BSA (S) to the two-thirds power of body mass (W): S = k W0.667, in which k, known as the Meeh constant,was a constant supposedly different for each species of animal. The Meeh constant for anurans has been reported as various values from 4.62 to as high as 10.6 with the exponent 0.667 since then. However, the exponent 0.667,known as the two-thirds rule, which was originally derived from homoiothermic vertebrates, may not be precise for ectothermic vertebrates such as amphibians, therefore,this exponent value was substituted later by several authors with various Meeh constants. Hutchison et al.(1968) gave an equation for anurans: S = 1.131 W0.579,which was concluded from 13 species belonging to four families of anurans. The Meeh constant of 1.131 was an abnormally small Meeh constant. Carefully checking Figure 18 on page 80 of this reference paper indicated there were obvious typing errors, the calculated values were much smaller (about ten times) than the values shown in this figure, although the accurately adjusted values could not be given here due to the original measured data being absent. Furthermore, among the equations for individual species given by them, several equations could not be merged to a single equation, for example, the predicted BSA between equations derived from Hyla arborea (S = 0.905 W0.823) and from H. cinerea(S = 1.462 W0.273) was significantly different from the results of ANOVA (data not shown). McClanahan and Baldwin (1969) gave an equation: S = 9.9 W0.56(1), which was concluded from toads of four species. The study on BSA prediction in anurans was hardly reported from then,and the equation (1) was generally adopted to estimate BSA for more species of anurans until recent years.
*Corresponding author: Dr. Jiongyu LIU, from Chengdu Institute of Biology, Chinese Academy of Sciences, with his research focusing on biochemistry and physiology of amphibians.
E-mail: liujy@cib.ac.cn
12 October 2013 Accepted: 26 February 2014
Asian Herpetological Research 2014, 5(1): 54-59
杂志排行
Asian Herpetological Research的其它文章
- Molecular Assessment and Taxonomic Status of the Rapid Racerunner (Eremias velox complex) with Particular Attention to the Populations in Northwestern China
- Molecular Characterization and Expression Analysis of Matrix Metalloproteinase 3 in the Asian Yellow Pond Turtle Mauremys mutica
- Structure Organization of Urinary System in the Yellow Spotted Mountain Newts (Salamandridae: Neurergus microspilotus)
- A New Species of the Genus Tylototriton (Urodela: Salamandridae) from Northeastern Hunan Province, China
- Preliminary Insights into the Habitat Preferences of the Centralian Bandy Bandy (Vermicella vermiformis) (Squamata: Elapidae) in Central Australia
- Multilocus Phylogeny of Lycodon and the Taxonomic Revision of Oligodon multizonatum
