Scale analysis of turbulent channel flow with varying pressure gradient*
2014-06-01QIUXiang邱翔
QIU Xiang (邱翔)
School of Science, Shanghai Institute of Technology, Shanghai 200235, China, E-mail: emqiux@gmail.com
LUO Jian-ping (罗剑平)
School of Mechanical Engineering, Shanghai Institute of Technology, Shanghai 200235, China
HUANG Yong-xiang (黄永祥), LU Zhi-ming (卢志明), LIU Yu-lu (刘宇陆)
Shanghai Institute of Applied Mathematics and Mechanics, Shanghai University, Shanghai 200072, China
Scale analysis of turbulent channel flow with varying pressure gradient*
QIU Xiang (邱翔)
School of Science, Shanghai Institute of Technology, Shanghai 200235, China, E-mail: emqiux@gmail.com
LUO Jian-ping (罗剑平)
School of Mechanical Engineering, Shanghai Institute of Technology, Shanghai 200235, China
HUANG Yong-xiang (黄永祥), LU Zhi-ming (卢志明), LIU Yu-lu (刘宇陆)
Shanghai Institute of Applied Mathematics and Mechanics, Shanghai University, Shanghai 200072, China
(Received May 6, 2013, Revised December 16, 2013)
In this paper orthogonal wavelet transformations are applied to decompose experimental velocity signals in fully developed channel flows with varying pressure gradient into scales. We analyze the time series from turbulent data, to obtain the statistical characteristics, correlations between the adjacent scales and the principal scale of coherent structures in different scales by wavelet transformations. The results show that, in the counter gradient transport (CGT) region, skewness factors and flatness factors deviate strongly from the corresponding values of Gaussian distribution on certain scales. PDFs on each scale confirm this observation. Scale-scale correlations show further that the fluctuations on some certain special scales are more intermittent than nearby. Principal scale of coherent structure is coincident with the scales on which the statistical properties depart from Gaussian distribution. These features are the same for different families of wavelets, and it also shows some different features in the region between favorable pressure gradient and adverse pressure gradient.
turbulence, counter gradient transport (CGT), wavelet analysis, pressure gradient, channel flow
Introduction
Nowadays, the problem of turbulence, which cover a wide range of scales, is one of the most important issues in classical physics and has been studied in the past years by many authors[1]. About turbulent transport, we consent that stronger transport capacity is one of fundamental characteristics of turbulence compared with laminar flows[1]. In most of turbulent models, the Fourier law is underlying, therefore gradient transport assumption is applied, which assumes that momentum, scalar and energy flux are transferred with mean quantities decreasing[1,2]. However it is well known in laboratory and engineering that we may also see the examples of counter gradient transport (CGT) phenomena[3]. For instance, there is a region near the central part of the channel where the Reynolds stress and mean strain possess the same sign, which means that momentum is transported under counter gradient. Traditional cascade theory cannot present reasonable explanation on these phenomena.
The classical theory of Kolmogorov’s postulates that turbulence is space-filling at all scales, from the largest scales with which the kinetic energy is input, to the smallest scales with which the kinetic energy is converted into the thermal energy. Since more valuable information for the individual scales should be obtained to study turbulence problem, more rigorous space-scale decompositions of the velocity data are required to proceed further.
The mechanism of CGT remains open, but it is believed that turbulent counter gradient transport is an essential cause why turbulence (the strong dissipative complex system) last for so long time period. Results obtained so far only show that coherent structures may be one of the important causes of the CGT[3]. Therefore more details about interactions between differentscales of eddies at different temporal and spatial positions should be investigated.
In the last 20 years, the wavelet transform has been used to analyze the multi-scale properties in finance[4], biological issues[5]and fluid mechanics[6]. Also because of the similarity between wavelets and eddies, wavelet analysis has been widely applied in turbulence experimental data processing, computation and turbulent models[7-9]. Jiang et al.[2]found that at some scales momentum is inversely transported, although total momentum is gradient-transported. However a lot of questions remain to answer. For example, what is the difference of turbulent scale properties in favorable pressure gradient region and adverse pressure gradient when counter gradient transport phenomena occur?
In the present work, we concentrate ourselves in the experimental data analysis using orthogonal wavelet transformations in turbulent channel flow with a wing on the bottom, following our previous work[2]. Compared to continuous wavelets, orthogonal wavelets are mutually orthogonal to each other and can maintain the original information. Therefore orthogonal wavelets are more reliable to consider the statistical characteristics of turbulent flows[9,10]. We started by performing a non-extensive statistical analysis at several scales from which time series, and we also got structural properties on different scales. Finally, the comparison of turbulent characteristics in favorable pressure gradient region and adverse pressure gradient region is carried out. The contents are arranged as below.

Fig.1 Schematic of asymmetric plane channel flow with a wing. The test section is 0.53 m× 0.22 m×0.055 m for length, width and height respectively
1. Experiments
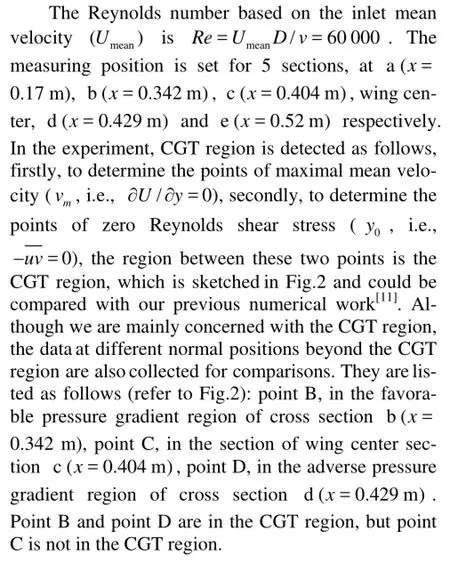
The experiments were carried out in the water tunnel of the experimental center of Shanghai Jiao Tong University[2]. The test section is 0.53 m× 0.22 m×0.055 m for length, width and height respectively. Two glasses, which are 0.02 m apart, are added between the top wall and bottom wall to construct the new channel flow, as shown in Fig.1. A symmetric wing, which is 0.4m distance from the inlet, is set on the bottom to generate a flow with varying pressure gradient. The wing is 0.07 m in length and 0.009 m in thickness on the center. The mean velocity at the inlet is 2.0 m/s. The measuring instrument is a TSI9100-9 laser Doppler velocimetry (LDV) of TSI. Data collection and analysis are completed by the accompany software flow information display (FIND).
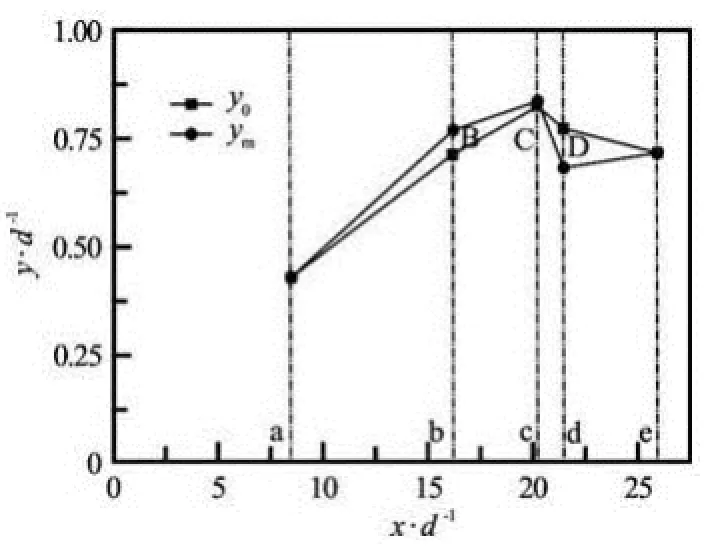
Fig.2 CGT region and the measurement points
2. Methodlogy
The waveletφi,j(x) is created by translation and dilation of generating wavelet functionφ(x), and they are localized both in space and scale. The mother wavelet has a zero mean and thus extracts variations of a signal. The scaling function, the integral of which from -∞ to ∞ is unity, is an averaging function, shown as follows

where ,i jrepresent the scale and position of wavelets, respectively. It is very similar to the scaling function
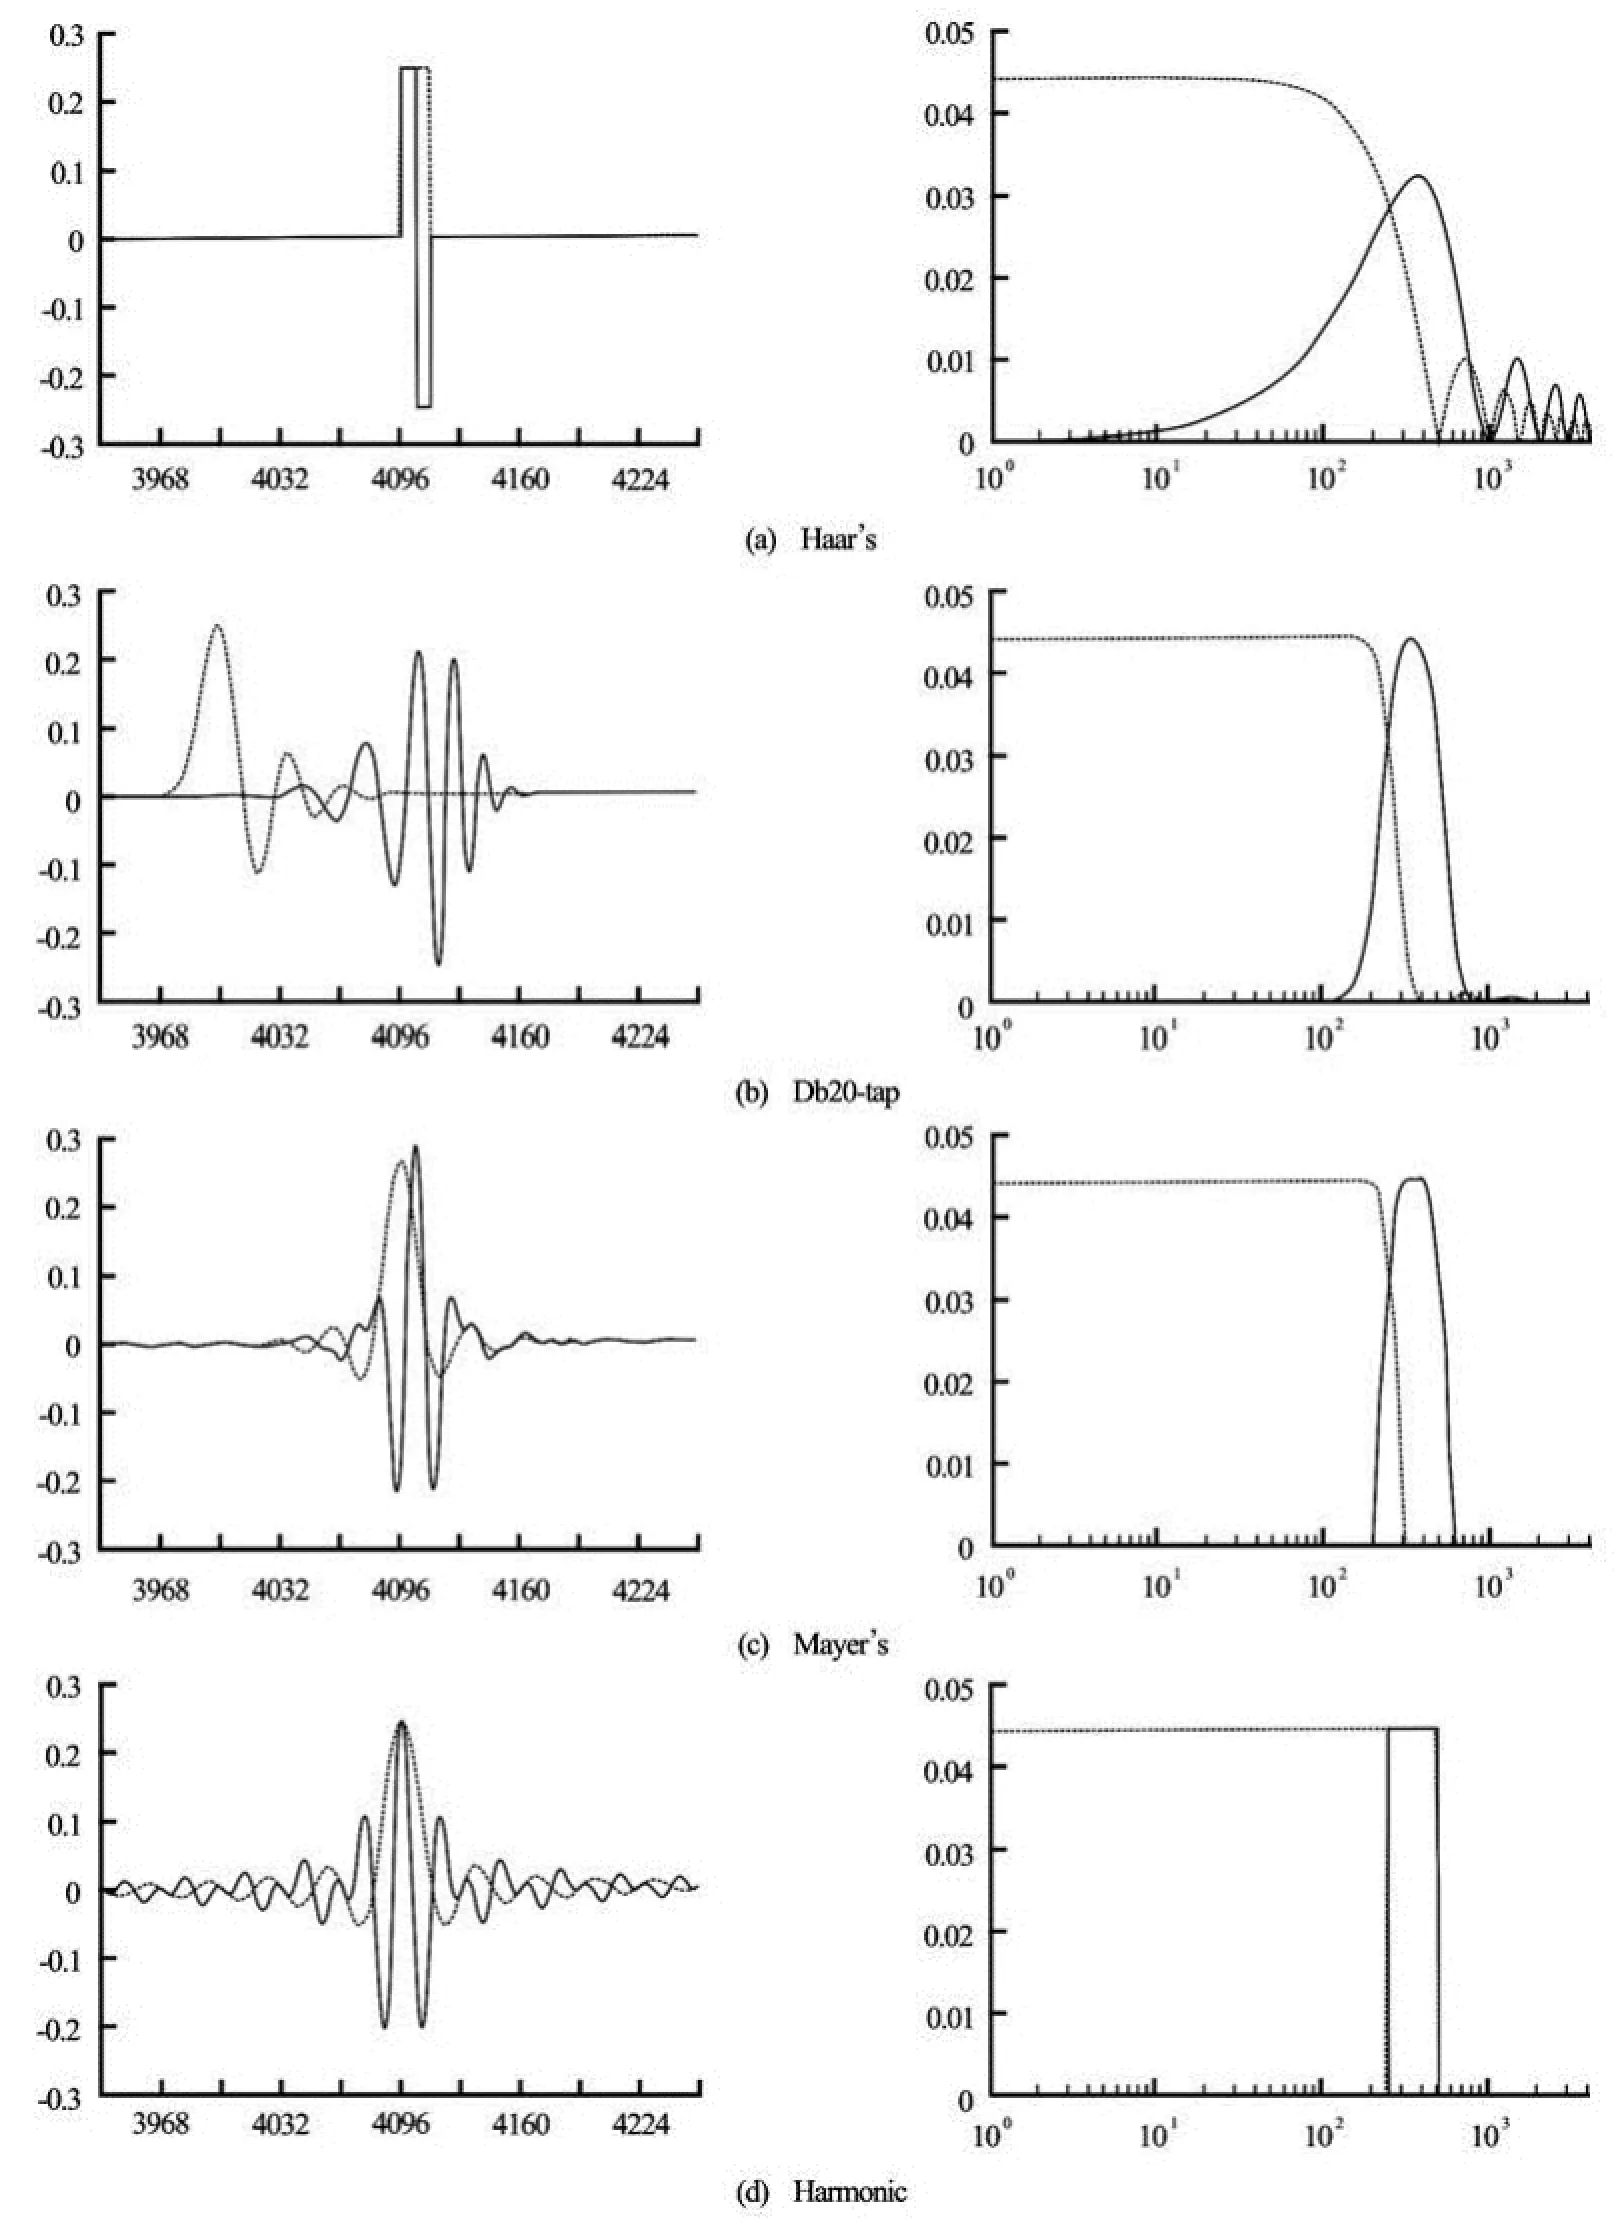
Fig.3 Wavelets (solid lines) and scaling functions (dotted lines) with =N13, ==jJ9, and =k256. Their power spectra in the wavenumber domain are shown in the right column

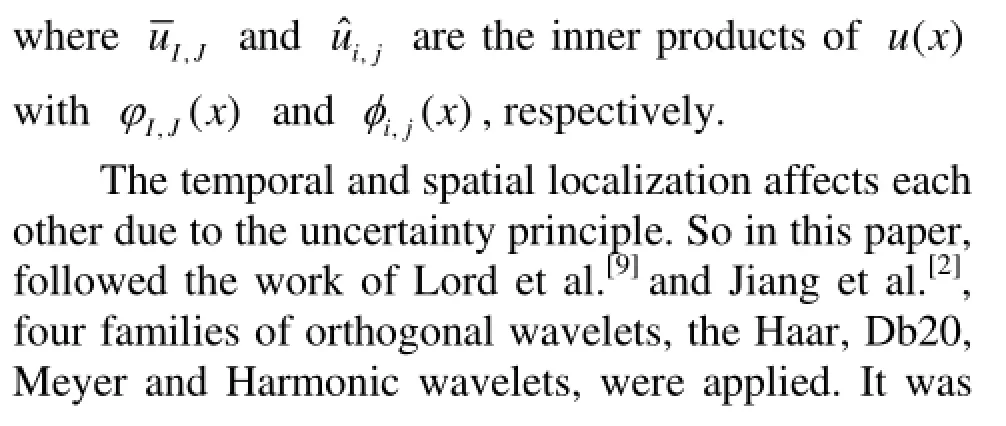
So, any square integrable function ()u xcan be reconstructed as

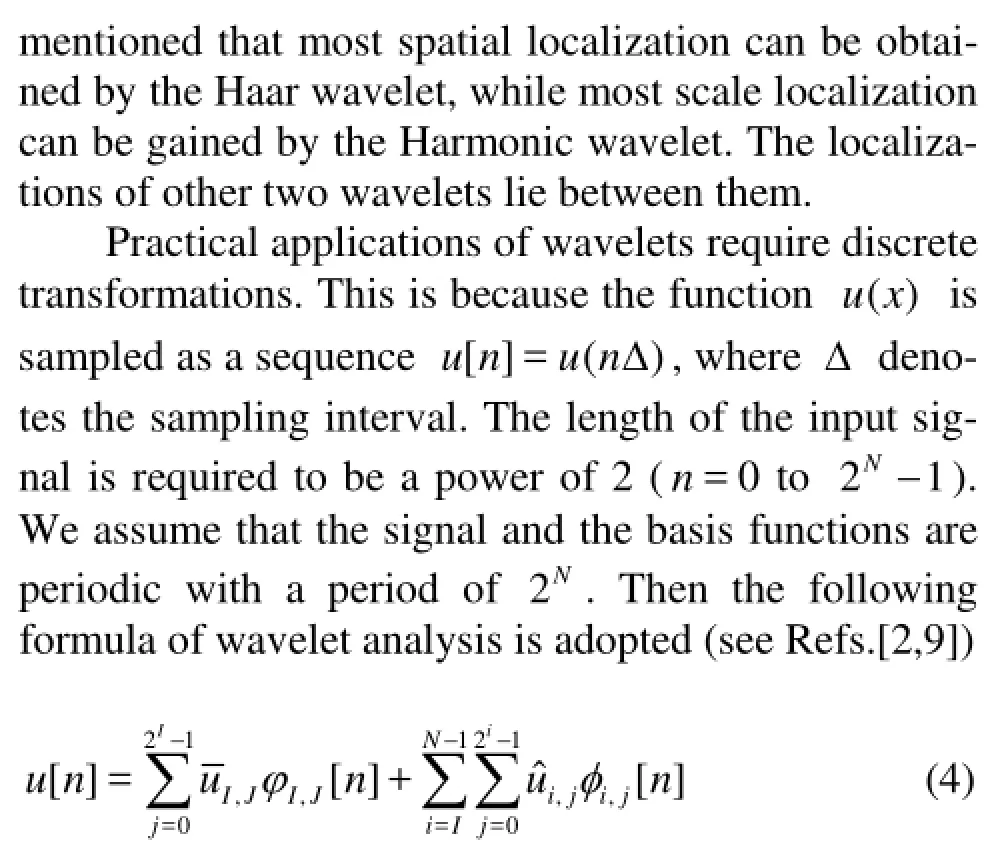


3. Results and discussions
3.1Flatness factor, skewness factor and probability density function (PDF)
The experimental data are analyzed with four families of wavelets: Haar, Db20, Meyer and Harmonic wavelets. The mean velocity is subtracted from the original signals, and the signals are divided into 1 200 segments of 4 096 points (=M1 200, =N12). The wavelet transformations are applied to each segment.
By using the orthogonal wavelet analysis, we could investigate the turbulent statistical quantities in each scale. Flatness factors, skewness factors and PDFs are important statistical quantities in turbulent fluctuations. These quantities defined in each scales are as follows

The flatness factor represents the peakedness or flatness of the probability distribution. For Gaussian distribution, the flatness factor in each scale is equal to 3 while the skewness factor is zero. But for turbulence, its PDF deviates from Gaussian distribution. A higher value means that the tail of the distribution is more pronounced than that of a Gaussian one. Thus the flatness factor grows as the distribution becomes more intermittent. The results of Jiang et al.[2]showed that the intermittency in the CGT region is stronger than that nearby. The magnitude of spatial fluctuations of the wavelet transforms is studied in each scale using the flatness factors, skewness factors and PDFs.
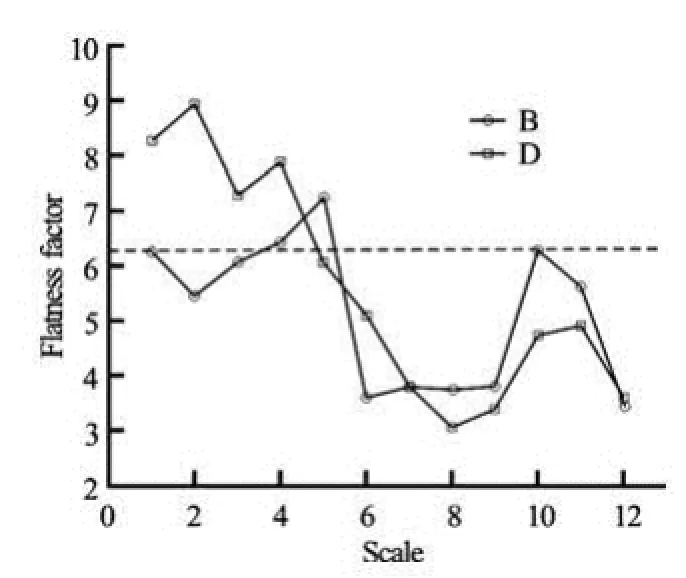
Fig.4 Flatness factors for each scale
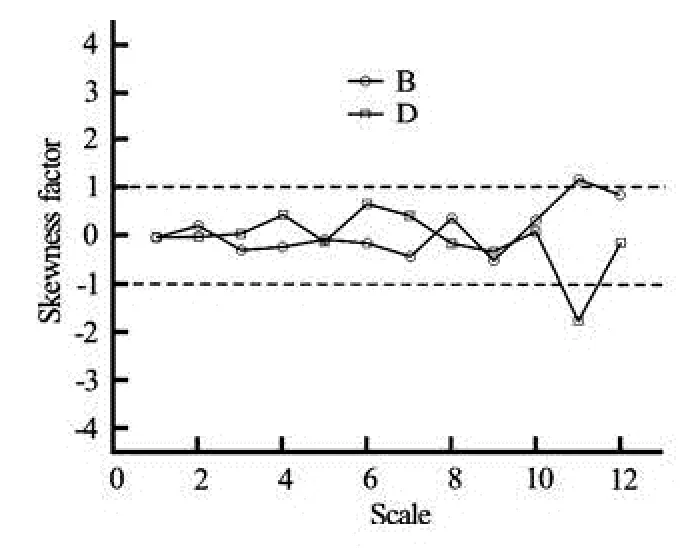
Fig.5 Skewness factors for each scale
Figure 4 illustrates the scale dependence of the flatness factors in the CGT region (location B in favorable pressure gradient region and locationDin reverse pressure gradient region) of streamwise velocity by using the Db20 wavelet. It should be noted that the other three wavelets usually give similar results, and will not be shown here. In large scales, the flatness factor is close to the Gaussian value of 3. As the scaledecreases, the flatness factor begins to increase. It should be mentioned that the present results are quite different from those of Lord et al.[9]and Li et al.[12]. The flatness factor begins to increase locally and reach the maximum at scale 10. From scale 11, it decreases again. This observations show that the intermittency between scales 8 and 10 is increased.
Figure 5 shows the skewness factor of velocity fluctuations in the CGT region (location B in favorable pressure gradient region and locationDin reverse pressure gradient region) in each scale. It is clearly seen that the values of skewness factors in each scale are vibrating around zero. It should be emphasized that the skewness factors in scale 11 deviates from zero more than any other scales. This result can be compared to the results of Jiang et al.[2]who found the special scale of 10 in fully developed asymmetric channel flow over ribs. And also we have detected that the values of skewness factors at locations B and D have different signs in almost all scales, and this result has not been reported in previous related articles and should be tested numerically and experimentally in future.
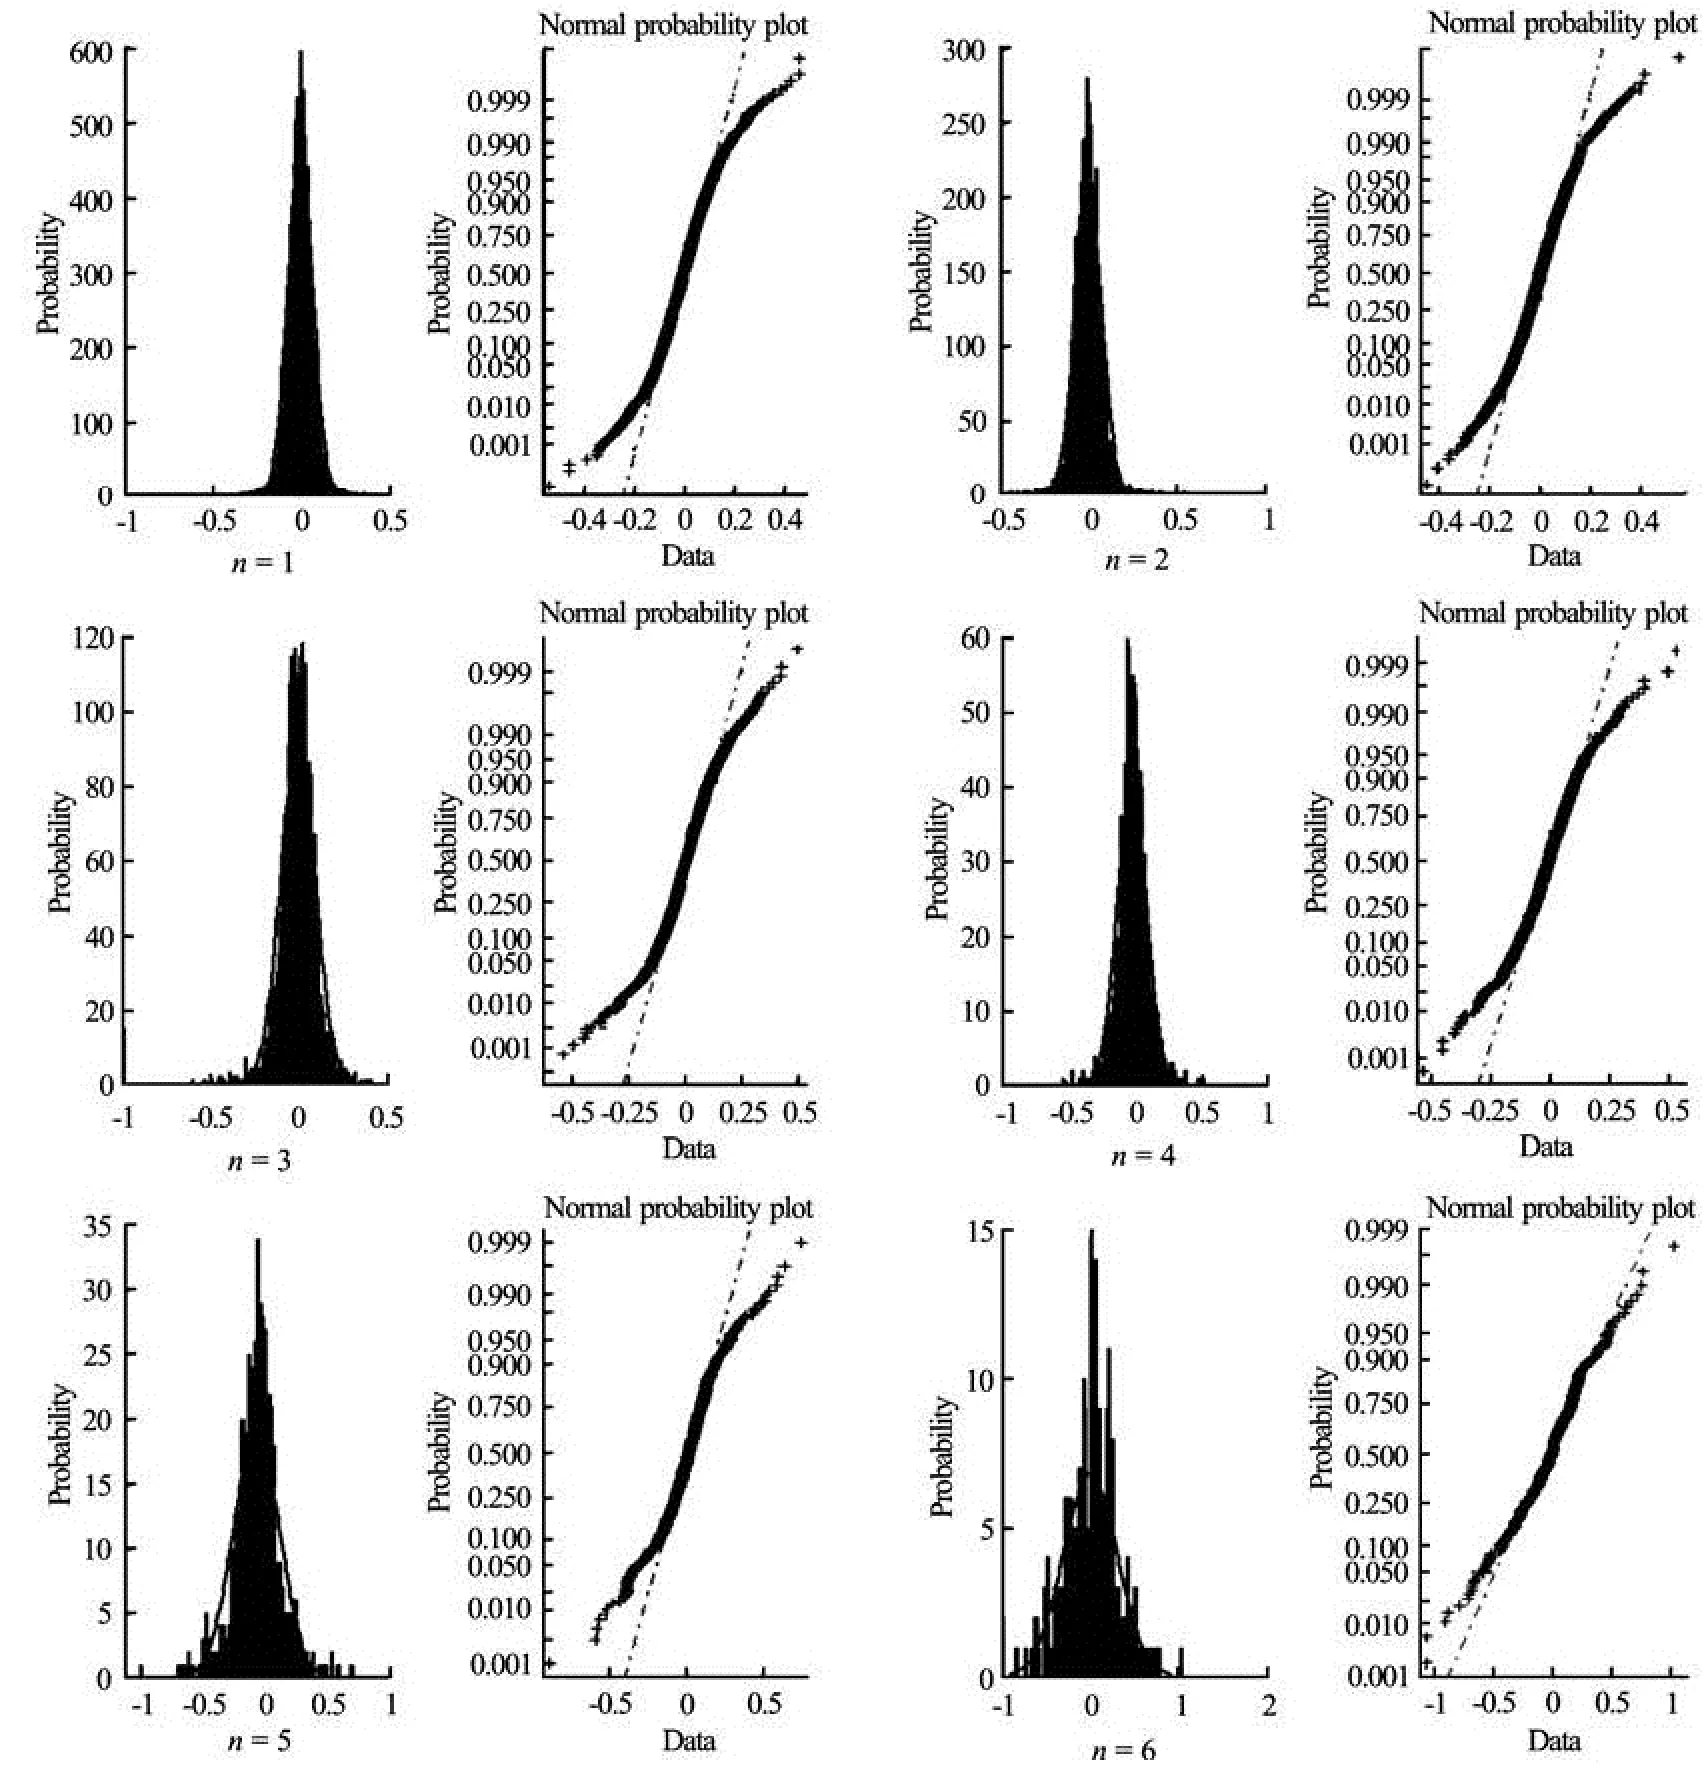
Fig.6 PDFs for each scale (1-6)
The results of PDFs (see Figs.6 and 7) at location B (results of location D, which is not shown here, are approximate with B) for each scale also indicate that the intermittency increases with the scale. Furthermore, the PDFs approach Gaussian distribution with the increase of scale. But scales 9, 10, 11 and 12 need to be paid more attention, and scales 9 and 12 are closer to Gaussian distribution than scales 10 and 11. From the results for the skewness and flatness factors, it could be found that the intermittency of small scalesare generally stronger than large scales, but intermediate scales more intermittent than nearby. In fact, the results indicate that smaller scales are more intermittent than larger scales, which is consistent that of boundary flow[13], and channel flow[12].
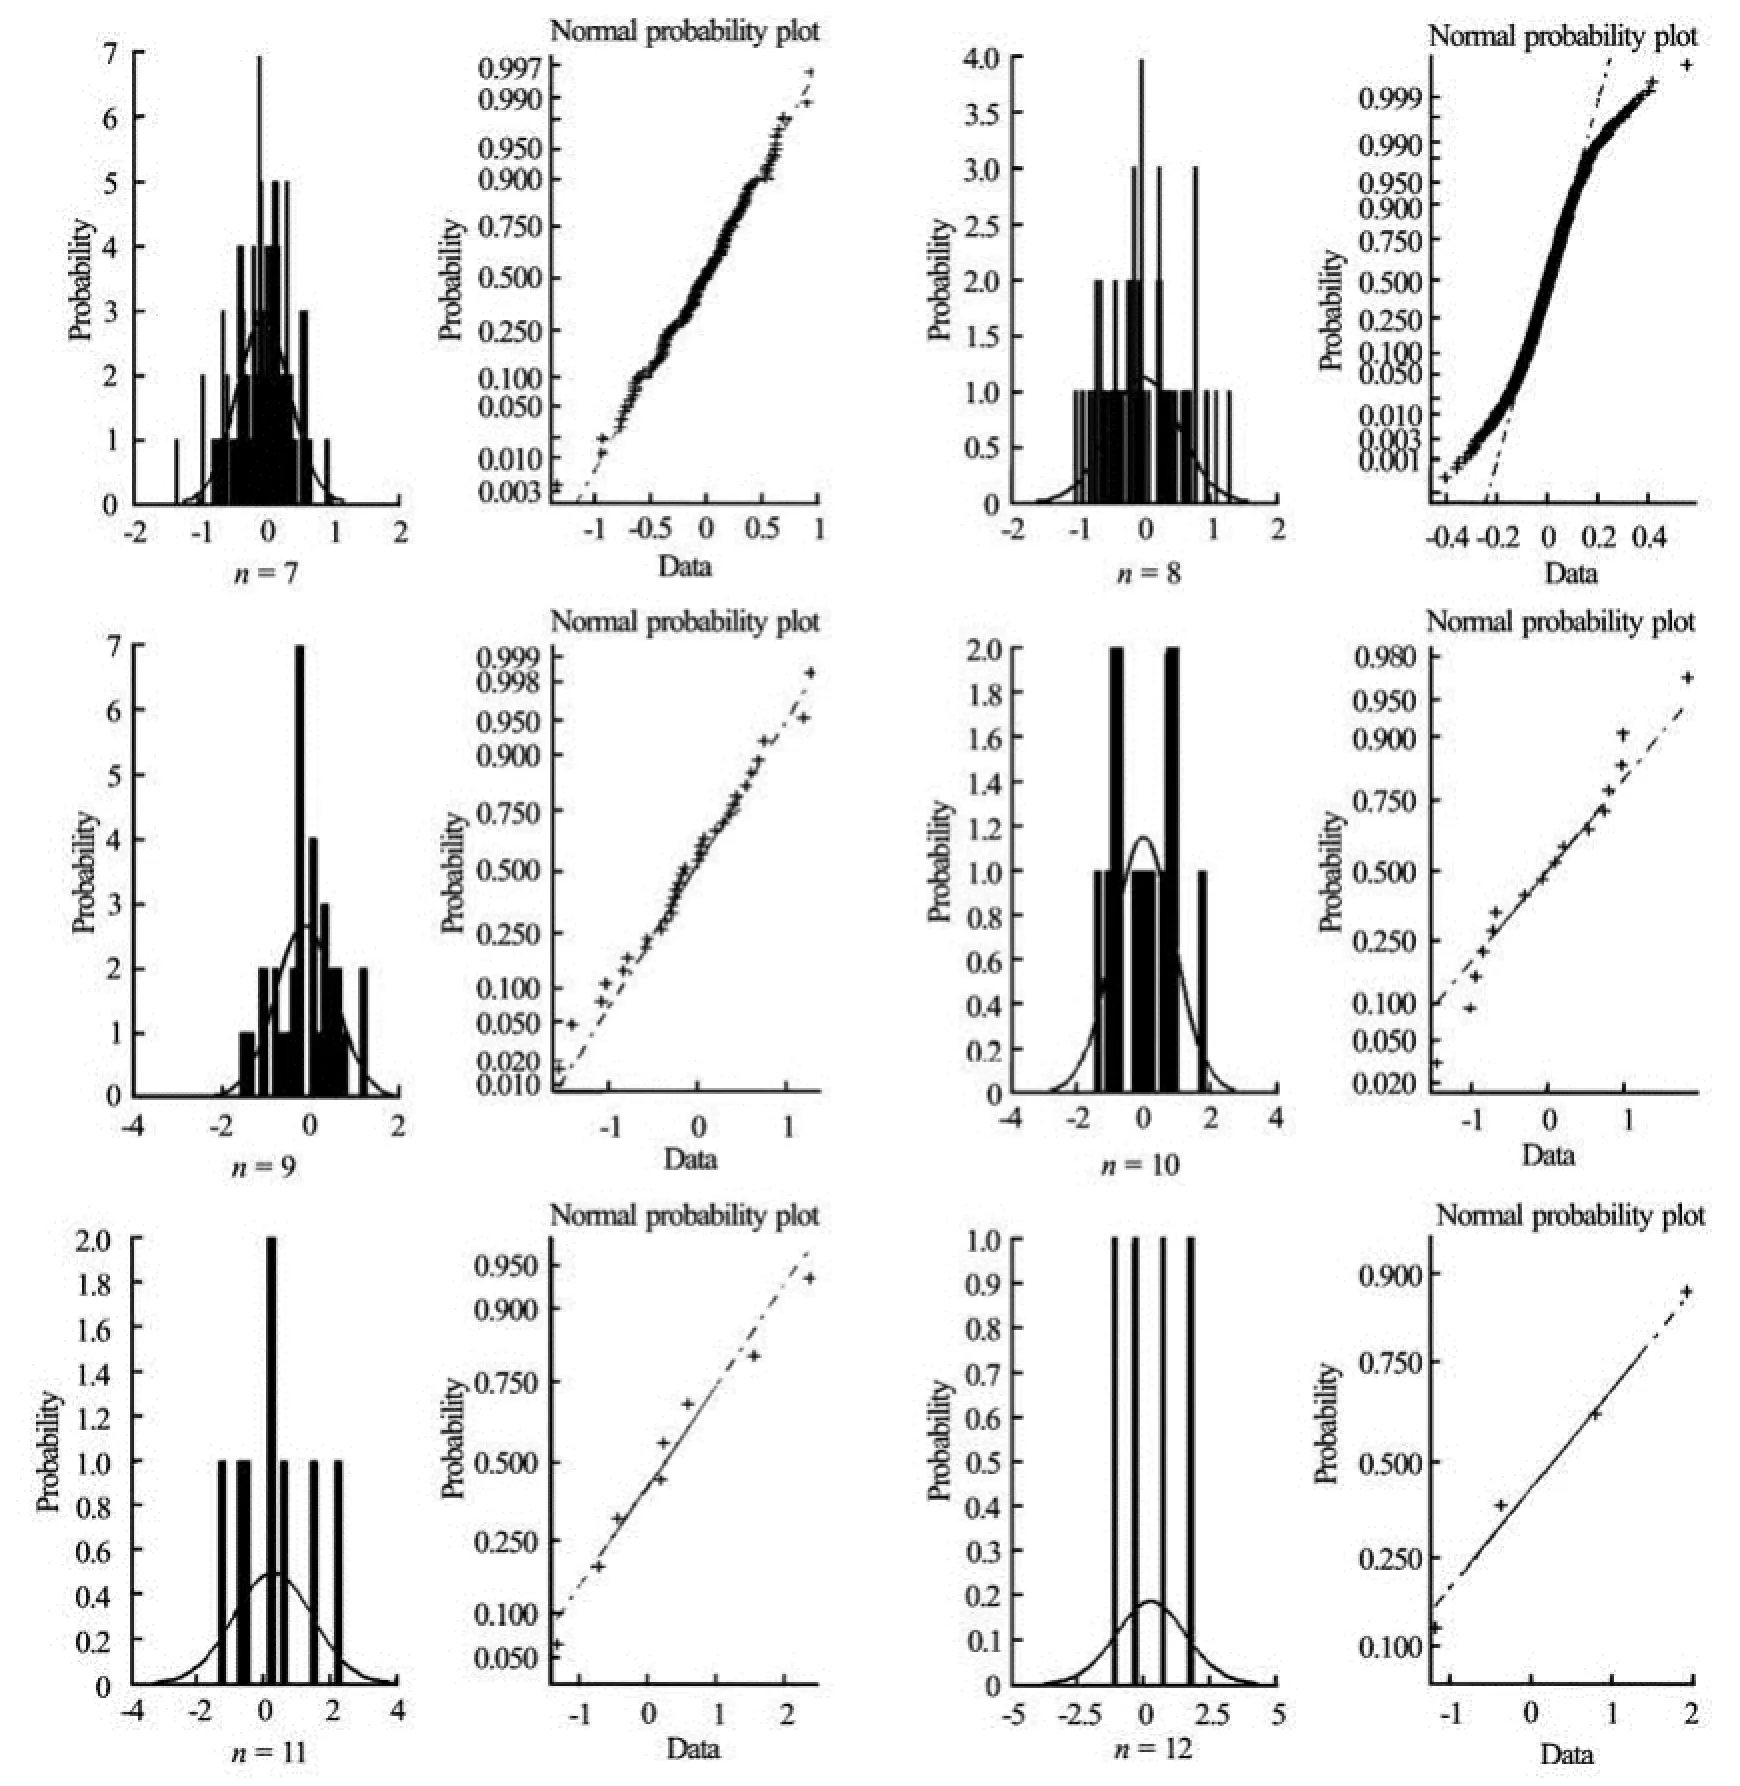
Fig.7 PDFs for each scale (7-12)
3.2Adjacent scales correlations
The orthogonal wavelets offer a unique opportunity to investigate a correlation in space between variations of different scales. Here we only consider the correlation between adjacent scales, such as correlation between scale 1j- andj. The correlation coefficients between the adjacent scales are defined as[2]

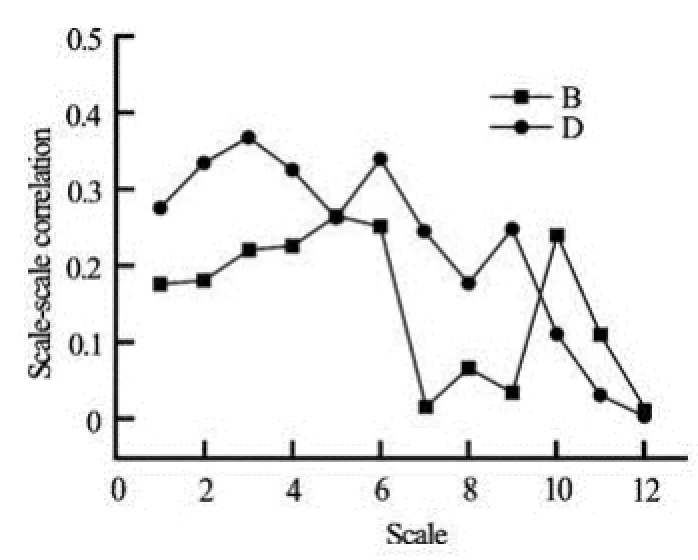
Fig.8 Ccorrelations between adjacent scales
As was pointed out by Jiang et al.[2], the correlation between 2j- andjis similar. Figure 8 showsthe results of scale-scale relations at two different points, B and D, employing Meyer’s and Harmonic bases because the other wavelets, Haar and Db20, will give the spurious correlations.
It is evident that the correlation is the function of scales. It is observed that with the increase of scales, the correlation decreases and correlations between larger scales are very weak for all the points considered here. Similar results are observed in isotropic flow. But at point B in the CGT region, it should be noted that there exists a pulse in scale 10 in the correlations between the adjacent scales. This phenomenon is absent at another point D and points mentioned above.
3.3Principal scale of coherent structures
There are many different methods to study principal scale of coherent structures, including the maximal energy method[14], energy method[15], and de-noising method presented by Guo et al.[6]. The energy methods stated above adopt continuous wavelet while de-noising method adopts discrete wavelets. In fact, the de-noising method is the extension of maximal energy method from continuous wavelet transform (CWT) to discrete wavelet transform (DWT). In this section, we extend the maximal energy method from CWT to DWT. In fact, the differences between CWT to DWT are scales and interpretation, i.e., CWT is theoretically defined in each scale and positions while DWT is in dyadic scales and positions.
It is well known that the larger wavelet coefficients in wavelet analysis indicate more intense coherent structures[12]. The following equation is adopted to estimate contributions of coherent structures in each scale to turbulent kinetic energy

whereωm[j] is the wavelet coefficients on scalem, andjis time factor, andpmis the ratio of contribution by coherent structures with scaled=2m+1to turbulent kinetic energy.
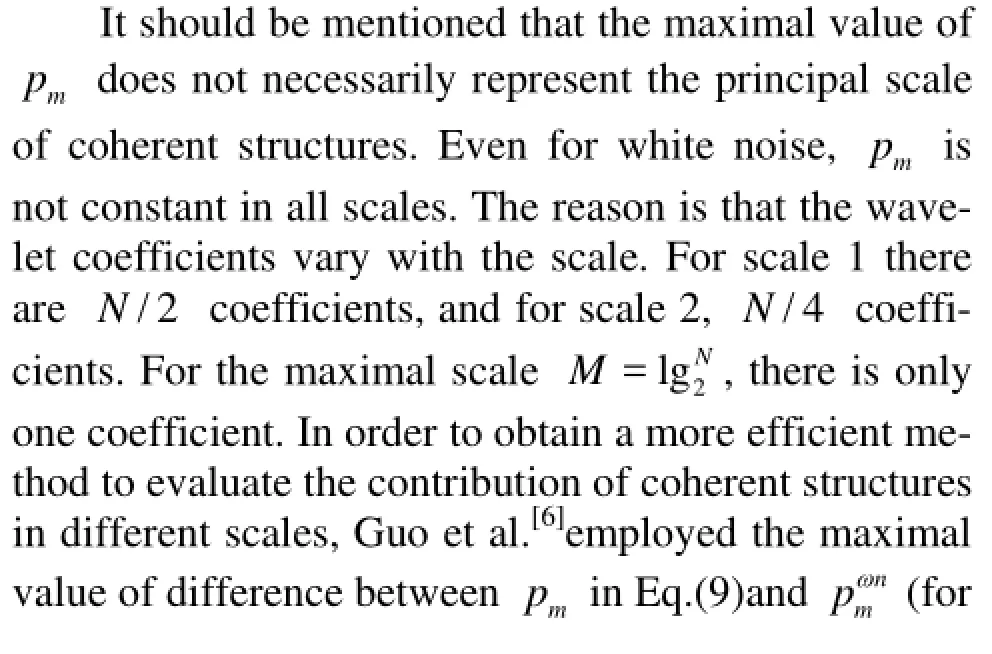

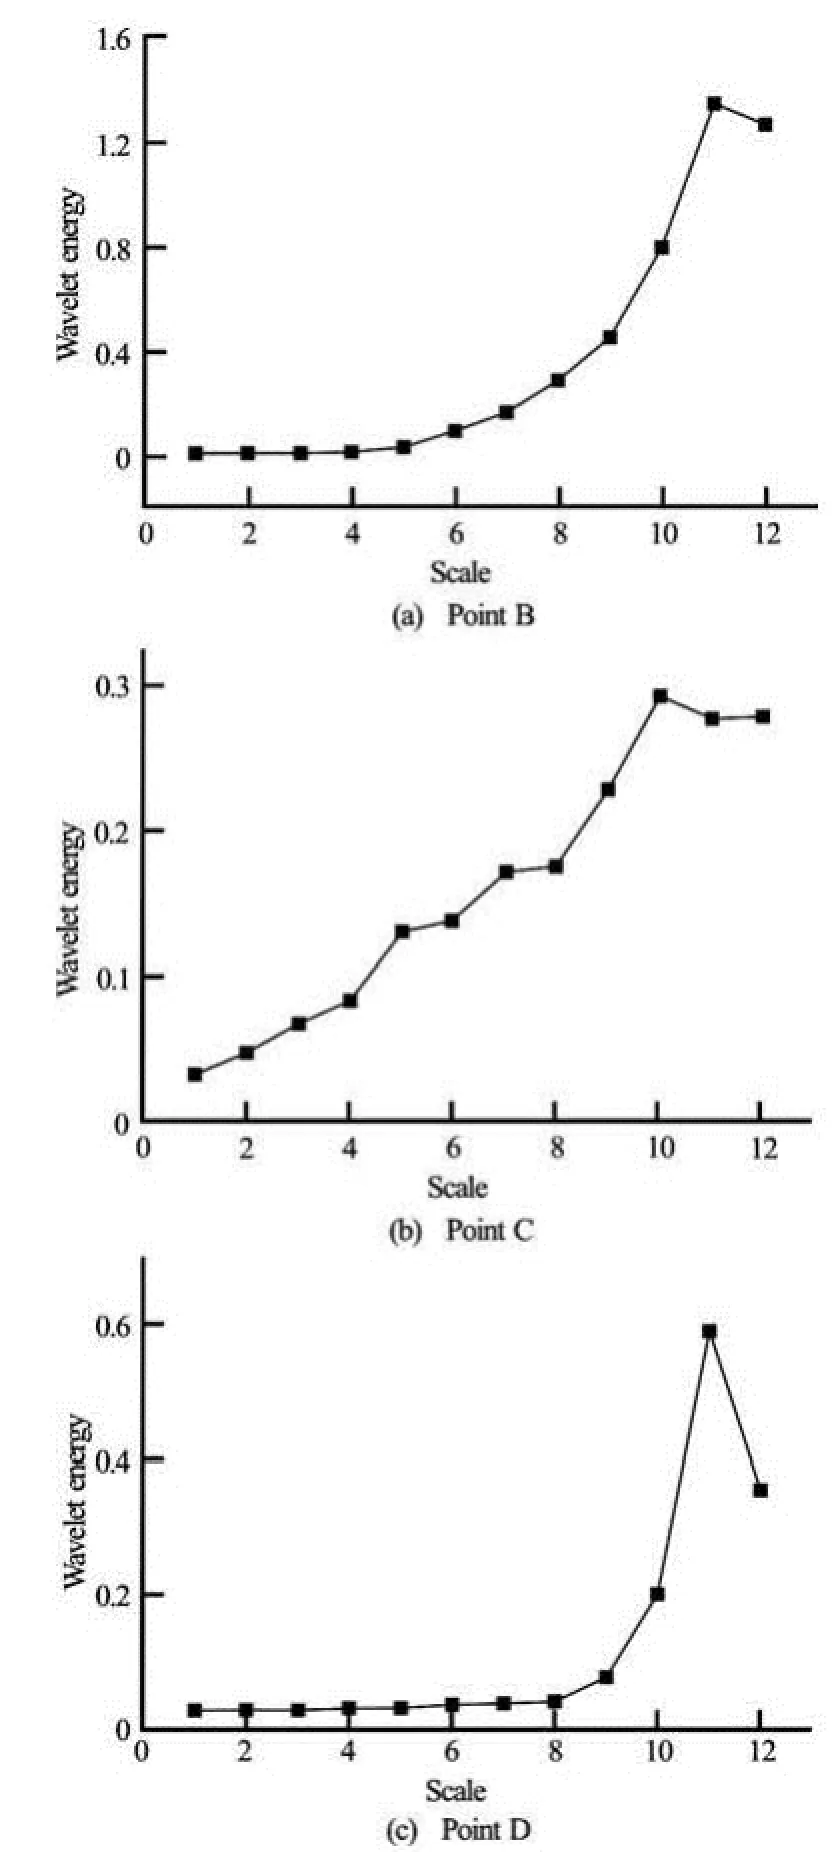
Fig.9 The principle scale of coherent structures
In fact, the number of wavelet coefficients in different scales means that the number of eddies depends on the scales. So we could determine the principal scale of coherent structures by considering the average energy in each scale. More specifically, it is determined by the following relationship
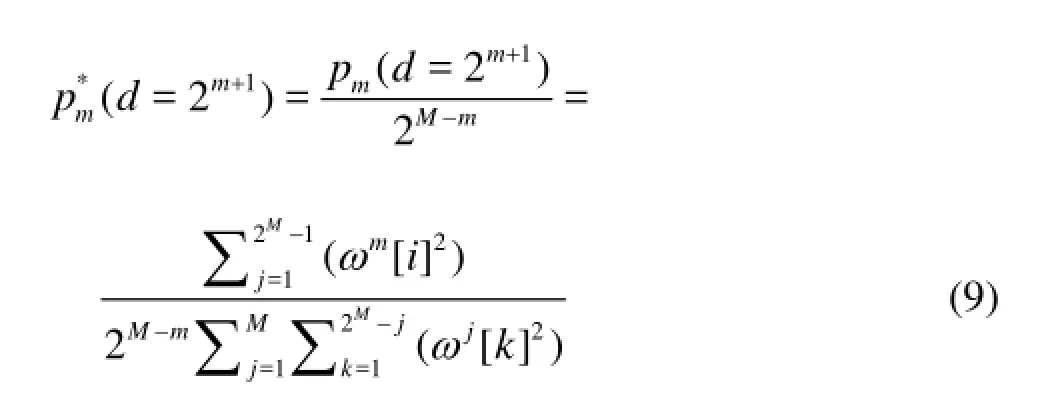
Here the maximal value ofmp*corresponds to the principal scale of coherent structures. It could be easily observed that this method is in essence the maximal energy method. The number of wavelet coefficients in each scale could be considered as constant.
By using the method presented above, we find that the ratio is constant in all scales for white noise. Figure 9 shows the principal scale of coherent structures at different points. Here only the results for Db20 are given. It is observed that the principal scales are scale 11 at point B, 10 at point C and 11 at point D, respectively. It should be noted that principal scale is 11 at B and D in the CGT region, partly coincident to the results of the flatness factors and skewness factors.
4. Conclusions
It is well known that randomness, multiple scales and coherent structures are the most essential features of turbulence. The wavelet analysis is a suitable tool to investigate turbulence. In this paper the orthogonal wavelets are applied to study the scale properties in turbulent counter gradient transport region in fully developed asymmetric channel flows with a wing on the bottom. We study for each scale the flatness factors, skewness factors, probability density functions, and scale-scale correlations. Then we calculate the principal scale of coherent structures.
The results show that in the CGT region, the skewness factors and flatness factors deviate strongly from the corresponding values of Gaussian distribution in some certain scales. The PDFs in each scale confirm this observation. The scale-scale correlations show further that fluctuation in some special scales is more intermittent than nearby. The principal scale of coherent structure is coincident with the scales on which the statistical properties depart from Gaussian distribution. Most of these features are the same for different families of wavelets, and it also shows some different features in the region between favorable pressure gradient and adverse pressure gradient.
[1] STEPHEN B. P. Turbulent flows[M]. Cambirdge, UK: Cambridge University Press, 2000.
[2] JIANG Jian-bo, QIU Xiang and LU Zhi-ming et al. Othogonal wavelet analysis of counter gradient transport phenomena in turbulent asymmetric channel flow[J]. Acta Mechanica Sinica, 2005, 21(2): 133-141.
[3] JIANG Jian-bo, LIU Yu-lu and LU Zhi-ming. Experimental and theoretical studies on negative transport phenomena in turbulent flows[J]. Advances in Mechanics, 2000, 30(2): 1-8(in Chinese).
[4] GALLEGATI M. Wavelet analysis of stock returns and aggregate economic activity[J]. Computational Statistics and Data Analysis, 2008, 52(6): 3061-3074.
[5] JAN Y. K., BRIENZA D. M. and GEYER M. J. Analysis of week-to-week variability in skin blood flow measurements using wavelet transforms[J]. Clinical Physiology and Functional Imaging, 2005, 25(5): 253-262.
[6] GUO Xin-lei, YANG Kai-lin and GUO Yong-xin. Hydraulic pressure signal denoising using threshold selflearning wavelet algorithm[J]. Journal of Hydrodynamics, 2008, 20(4): 433-439.
[7] JACOBITZ F., LIECHTENSTEIN L. and SCHNEIDER K. et al. On the structure and dynamics of sheared and rotating turbulence: Direct numerical simulation and wavelet-based coherent vortex extraction[J]. Physics of Fluids, 2008, 20(4): 045103.
[8] SCHNEIDER K., VASILYEV O. V. Wavelet methods in computational fluid dynamics[J]. Annual Review of Fluid Mechanics, 2010, 42: 473-503.
[9] LORD J. W., RAST M. P. and MCKINLAY C. et al. Wavelet decomposition of forced turbulence: Applicability of the iterative Donoho-Johnstone threshold[J]. Physics of Fluids, 2012, 24(2): 025102.
[10] SCHNEIDER K., FARGE M. and PELLEGRINO G. et al. Coherent vortex simulation of three-dimensional turbulent mixing layers using orthogonal wavelets[J]. Journal of Fluid Mechanics, 2005, 534: 39-64.
[11] QIU Xiang, JIANG Jian-bo and LIU Yu-lu. Effects of pressure-gradient on turbulent counter-gradient transport[J]. Acta Mechanica Sinica, 2004, 36(2): 163-170(in Chinese).
[12] LI Li, XU Chun-xiao and ZHANG Zhao-shun. Study of burst phenomena in wall turbulence by wavelet analysis[J]. Acta Mechanica Sinica, 2001, 33(2): 153-162(in Chinese).
[13] CHEN Jiong, HU Fei. Coherent structures detected in atmospheric boundary-layer turbulence using wavelet transforms at Huaihe River Basin, China[J]. Boundary-Layer Meteorology, 2003, 107(2): 429-444.
[14] OKAMOTO N., YOSHIMATSU K. and SCHNEIDER K. et al. Coherent vortices in high resolution direct numerical simulation of homogeneous isotropic turbulence: A wavelet viewpoint[J]. Physics of Fluids, 2007, 19(11): 115109.
[15] FARGE M., PELLEGRINO G. and SCHNEIDER K. Coherent vortex extraction in 3D turbulent flows using orthogonal wavelets[J]. Physical Review Letters, 2001, 87(5): 054501.
10.1016/S1001-6058(14)60015-9
* Project supported by the National Natural Science Foundation of China (Grant Nos. 11102114, 11172179) and the Innovation Program of Shanghai Municipal Education Commission (Grant No. 13YZ124).
Biography: QIU Xiang (1978-), Male, Ph. D.,
Associate Professor
LUO Jian-ping,
E-mail: jp_luo@163.com
杂志排行
水动力学研究与进展 B辑的其它文章
- Equivalent pipe algorithm for metal spiral casing and its application in hydraulic transient computation based on equiangular spiral model*
- Simulation of buoyancy-induced turbulent flow from a hot horizontal jet*
- Deepwater gas kick simulation with consideration of the gas hydrate phase transition*
- An ocean circulation model based on Eulerian forward-backward difference scheme and three-dimensional, primitive equations and its application in regional simulations*
- A hybrid DEM/CFD approach for solid-liquid flows*
- Influences of soil hydraulic and mechanical parameters on land subsidence and ground fissures caused by groundwater exploitation*
