A Microsatellite Genetic Linkage Map of Black Rockfish (Sebastes schlegeli)
2014-04-26CHUGuannanJIANGLimingHEYanYUHaiyangWANGZhigangJIANGHaibinandZHANGQuanqi
CHU Guannan, JIANG Liming, HE Yan, YU Haiyang,, WANG Zhigang, JIANG Haibin, and ZHANG Quanqi
1) College of Marine Life Science, Key Laboratory of Marine Genetics and Breeding of Ministry of Education, Ocean University of China, Qingdao 266003, P. R. China
2) Shandong Marine Fisheries Research Institute, Yantai 264006, P. R. China
A Microsatellite Genetic Linkage Map of Black Rockfish (Sebastes schlegeli)
CHU Guannan1), JIANG Liming1), HE Yan1), YU Haiyang1),*, WANG Zhigang1), JIANG Haibin2), and ZHANG Quanqi1)
1) College of Marine Life Science, Key Laboratory of Marine Genetics and Breeding of Ministry of Education, Ocean University of China, Qingdao 266003, P. R. China
2) Shandong Marine Fisheries Research Institute, Yantai 264006, P. R. China
Ovoviviparous black rockfish (Sebastes schlegeli) is an important marine fish species for aquaculture and fisheries in China. Genetic information of this species is scarce because of the lack of microsatellite markers. In this study, a large number of microsatellite markers of black rockfish were isolated by constructing microsatellite-enriched libraries. Female- and male-specific genetic linkage maps were constructed using 435 microsatellite markers genotyped in a full-sib family of the fish species. The female linkage map contained 140 microsatellite markers, in which 23 linkage groups had a total genetic length of 1334.1 cM and average inter-marker space of 13.3 cM. The male linkage map contained 156 microsatellite markers, in which 25 linkage groups had a total genetic length of 1359.6 cM and average inter-marker distance of 12.4 cM. The genome coverage of the female and male linkage maps was 68.6% and 69.3%, respectively. The female-to-male ratio of the recombination rate was approximately 1.07:1 in adjacent microsatellite markers. This paper presents the first genetic linkage map of microsatellites in black rockfish. The collection of polymorphic markers and sex-specific linkage maps of black rockfish could be useful for further investigations on parental assignment, population genetics, quantitative trait loci mapping, and marker-assisted selection in related breeding programs.
black rockfish; Sebastes schlegeli; microsatellite; genetic linkage map
1 Introduction
Black rockfish (Sebastes schlegeli, family Sebastinae) is an economically important fish species for fisheries and aquaculture in eastern Asia. In the past decade, research on black rockfish has primarily focused on the extent of stocking and impact of water pollution on indigenous populations. Black rockfish has become an important aquaculture species in China, especially in Shandong Peninsula, because of its high commercial value (Xie et al., 2004). The embryonic development of black rockfish, an ovoviviparous fish species, had been studied (Yamada et al., 1991). Mature female individuals of black rockfish mate with male individuals in autumn; the fertilized eggs are stored in female ovaries and developed for hatching throughout winter and spring; the ‘pregnant’ females spawn once a year to give birth to fry in May and June (Zhu et al., 1999). Artificial fingerling production and aquaculture of black rockfish have been successful in China and Korea.
Assaying the genetic structure of wild fish populations is essential for long-term resource management, and monitoring the genetic variability of cultured stocks has implications for sustainable aquaculture (Hamrick et al., 1991). In addition, good breeds with high growth rates and/or disease resistance can be selected to enhance aquaculture efficiency. Therefore, numerous genetic breeding programs have been initiated to promote commercial cultivation (Bentsen et al., 1994). To develop the breeding and management plans, genetic knowledge regarding the karyotype, population structure, and genetic diversities is useful in marine animals. A karyotype study has demonstrated that the diploid number of black rockfish is 2n=48 (Zhu et al., 2006). Recent studies attempted to develop microsatellite markers for assessing the genetic diversity and population structure of black rockfish (Yoshida et al., 2005; An et al., 2009, 2012). As of this writing, research on black rockfish using molecular markers is lacking, and genetic information of this fish species is limited.
Selective breeding programs aim to improve the economic traits of a species, such as growth and disease resistance (Danzmann et al., 2001; Haidle et al., 2008). Such economic traits are generally controlled by more than one locus (O’Connel and Wright, 1997), which are inherited quantitatively. Traditional genetic breeding requires multiple generations of selection, which takes asubstantially long time because of the long generation periods of most marine fish species. Comparatively, marker-assisted selection (MAS) is a promising approach (Fuji et al., 2007) that is expected to increase the genetic response by affecting the selection intensity and accuracy (Bentsen and Gjerde, 1994). Thus, construction of genetic linkage maps and mapping of related quantitative trait loci (QTL) are important for MAS of aquatic species (Danzmann and Gharbi, 2001; Haidle et al., 2008).
Genetic linkage maps have been constructed for commercially important fish species, such as tilapia (Oreochromis niloticus) (Lee et al., 2005), rainbow trout (Oncorhynchus mykiss) (Rexroad et al., 2008), Atlantic salmon (Salmo salar) (Moen et al., 2008), Japanese flounder (Paralichthys olivaceus) (Coimbra et al., 2003; Cecilia et al., 2010), European sea bass (Dicentrarchus labrax) (Chistiakov et al., 2008), Atlantic cod (Gadus morhua) (Moen et al., 2009; Hubert et al., 2010), turbot (Scophthalmus maximus) (Bouza et al., 2007), and half-smooth tongue sole (Cynoglossus semilaevis) (Jiang et al., 2013). Some QTLs have been successfully mapped for the above fish species as well. The QTLs for body size were identified in tilapia (Cnaani et al., 2003). Two QTLs that influence the upper water temperature tolerance were identified in three rainbow trout half-sib families (Jackson et al., 1998). A lymphocystis disease-resistant trait was linked to a microsatellite locus in linkage group 15 in Japanese flounder (Fuji et al., 2006), and this locus was further used in genetic breeding of lymphocystis disease-resistant strains (Fuji et al., 2007). However, the polymorphic markers and genetic linkage maps of black rockfish are still lacking, further limiting the progress of selective breeding of this species.
In this study, 435 polymorphic microsatellite markers were developed and used to construct the microsatellite-based genetic linkage maps of female and male black rockfish. The constructed maps will lay the foundation for further studies regarding high-density linkage map construction, QTL, and MAS of black rockfish.
2 Materials and Methods
2.1 Experimental Population and DNA Extraction
Individuals of S. schlegeli were obtained from Taihua Mariculture Ltd., Co., Yantai City, Shandong Province, China. Six wild individuals were collected, and a small piece of muscle tissue was dissected from each individual. Genomic DNA was extracted from muscle tissue specimens using the standard phenol-chloroform method (Sambrook et al., 2001). All genomic DNA samples were dissolved in 0.1×TE buffer, and adjusted to 50 ng μL–1for microsatellite-enriched library construction and polymorphism detection of microsatellite markers.
A total of 300 wild individuals (100 females and 200 males) were reared in an outdoor pond (100 m × 200 m) for natural mating in October 2010. After mating, the female individuals were moved to smaller indoor tanks (5 m × 6 m, 20 individuals each) for overwintering and intensive cultivation until the following April. During the spawning season, each female individual was kept in a separate hatching tank with sufficient aeration and allowed to spawn fry separately. Offspring obtained from one female was called a family.
Four parent females and their families were randomly selected. A small piece of fin tissue of each female and 30 one-month-old fries from each family were collected and stored in 100% ethanol for DNA extraction. The samples were applied to family assignment using 17 highly polymorphic microsatellite markers. One of the four families was a full-sib family derived from the female mating with a male, whereas the other three were half-sib families produced by the female parent mating with at least two males (Chu et al., 2013). The full-sib family, including 48 individuals, was used as the mapping family for genetic linkage map construction.
2.2 Microsatellite Markers
The microsatellite library enriched with AG or AC repeats was constructed as described by Edwards et al. (1996) with slight modifications. The entire method of microsatellite marker isolation was based on the procedure by Jiang et al. (2013). The pre-amplification condition was 25 cycles.
Sequences containing microsatellites were processed using Lasergene 6.0 (http://www.dnastar.com/), and searched for repeat fragments using Tandem Repeats Finder (version 4.0) (Benson, 1999). Microsatellites with at least six repeats and appropriate flanking sequences were selected for polymerase chain reaction (PCR) primer design using Primer Premier 5.0 (Premier Biosoft International) based on the GC content of 45%–65%, melting temperature of 45–65℃, and lack of a secondary structure. All primer pairs were designed to be 18–24 bp in length with an expected product size of 80–350 bp. All designed primers pairs were synthesized by GenScript (Nanjing, China), and tested by temperature-gradient PCR to optimize the annealing temperature.
Gradient PCR amplification was conducted at an annealing temperature of 45–65℃. The 25 μL PCR reactions contained 1×PCR buffer, 1.5 mmol L-1MgCl2, 0.2 mmol L-1dNTP, 0.4 μmol L-1primer, 0.75 U rTaq DNA polymerase, and 2 ng μL-1template DNA. The PCR conditions were as follows: pre-denaturation at 94℃ for 5 min, followed by 30 cycles of denaturation at 94℃ for 30 s, annealing at gradient temperature from 45℃ to 65℃for 30 s, extension at 72℃ for 30 s, and a final extension step at 72℃ for 7 min. The PCR amplicons were detected by 1.5% agarose gel electrophoresis, stained with ethidium bromide (EB), and visualized under UV light to confirm the optimal annealing temperature for each primer pair.
All microsatellite loci were genotyped in six wild individuals for polymorphism assessment. PCR amplification was performed as described above. The PCR products were separated on 10% non-denaturing polyacrylamide gels and visualized by EB staining. Among the success-fully amplified primer pairs, the polymorphic markers were designated as ‘SS’ (S. schlegeli). All the polymorphic markers were used to construct the genetic linkage map.
2.3 Map Construction
Forty-eight progenies from the selected full-sib family were used for map construction. Genotype data of the female parent and 48 offspring individuals were transferred to an electronic spreadsheet of cross-pollinating (CP) format that can be recognized by JoinMap® 4.0 (Van Ooijen, 2006). When the genotypes of the female parent and offspring were known, the genotype of the male parent could be inferred. A goodness-of-fit G-test was used to examine segregation ratios of all markers that significantly deviated from the Mendelian expectations (P < 0.01). Markers exhibiting significant deviations were double-checked and either rescored or removed for further analysis. The Morgan’s mapping function, which simply equates genetic distance with recombination rate, was used for distance calculation. The mapping population was considered as a CP population. The markers, excluding those departing from Mendelian expectations, were assigned into linkage maps with a minimum logarithm of odds (LOD) score of 4.0. Once the framework maps were established, the distorted and unlinked markers were added using a less stringent LOD threshold of 3.0. Estimation of the differences in sex-specific recombination rates along the linkage groups was performed on the shared adjacent markers by the chi-square test. For each linkage group (LG), the recombination rates of male and female individuals were compared. Marker distance in centiMorgan was calculated with the Kosambi parameter. Linkage maps were drawn using MapChart 2.1 (Voorrips, 2002).
2.4 Genome Length and Map Coverage
Genome length was calculated using two different methods. The genome size 1 (Ge1) was estimated by adding 2s (where ‘s’ is the average spacing of the linkage map) to the length of each group, which accounts for the chromosome ends of framework markers (Postlethwait et al., 1998). The genome size 2 (Ge2) was calculated by multiplying the total length of the linkage groups by the factor (m+1)/(m-1) (where ‘m’ is the number of framework markers in each linkage group) (Chakravarti et al., 1991). The average of the two estimates was used as the estimated genome length of each sex-specific linkage map (Zhang et al., 2007). The observed map length was calculated as the total length of the map excluding unlinked markers. The observed genome coverage was calculated as the ratio of the observed map length to the estimated genome length.
3 Results
3.1 Polymorphic Microsatellite Markers
A total of 1073 positive clones were detected in the microsatellite-enriched library, from which 982 microsatellite sequences were obtained. Targeting the microsatellite sequences, 788 primer pairs were designed. After optimization of the annealing temperature, the polymorphism of these markers was evaluated in six wild individuals, and positive results were obtained with 435 (55.2%) markers.
Before genetic linkage map construction, the polymorphism of the microsatellite markers was detected in the full-sib family of the female parent and five offspring individuals. The genotype of male individuals was obtained after the genotypes of the female parent and offspring individuals were identified. According to the results of PCR assay, in the full-sib family, 159 microsatellite markers were heterozygous in the female parent and 176 were polymorphic in the male parent. The 335 polymorphic microsatellite markers were used to construct the sex-specific genetic linkage maps. Markers that were homozygous in both parents were removed from further analysis.
3.2 Linkage Maps
Genotype analysis of the microsatellite markers (excluding segregation distortion markers) in the mapping family showed that 25 and 27 linkage groups were identified in the female and male linkage maps, respectively, which were constructed at the threshold of LOD=4.0. In consideration of the segregation distortion markers by reducing the LOD score to 3.0, two pairs of linkage groups in the female map merged together and one pair of linkage groups in the male map merged together. The final linkage maps of female and male black rockfish were constructed, which contained 23 and 25 linkage groups, respectively (Figs.1 and 2). The female and male linkage groups were matched according to the common markers, and 20 homologous pairs of linkage groups were found.
The final length of the female map containing 140 markers was 1334.1 cM, and that of the male map containing 156 markers was 1359.6 cM. The lengths of linkage groups varied from 1.1 cM to 148.0 cM in the female map and 7.8 cM to 125.1 cM in the male map. The resolution of the female map ranged from 1.1 cM to 32.6 cM (average 13.3 cM), whereas that of the male map ranged from 3.9 cM to 45.5 cM (average 12.4 cM). The number of loci per linkage group in the female map was 2–17 (average 6.0), whereas that in the male map was 2–12 (average 6.1) (Table 1). The general characteristics of the sexspecific genetic linkage maps are summarized in Table 2.
The female and male linkage groups were matched according to the markers detected in both parents. Although the total map length of the female was close to that of the male, it was not consistent along all homologous linkage groups. A total of 20 pairs of homologous linkage groups were found (Figs.1 and 2). LG1 (148.0 cM) in female was matched with LG1 (125.1 cM) and LG21 (47.1 cM) in male, whereas LG15 (65.1 cM) in male was matched with LG15 (18.6 cM) and LG23 (1.1 cM) in female. Obvious differences were observed in certain areas of the chromosomes. A few groups (LGs 2, 5, 9, 12, 16, 17, and 20) were longer in the female map, and some other groups (LGs7, 8, 11, and 19) were longer in the male map.
3.3 Genome Size and Map Coverage
Using two different methods, the genome length of the female linkage group was estimated to be 1946.6 and 1942.1 cM with an average of 1944.3 cM, and that of the male was estimated to be 1980.5 and 1942.1 cM with an average of 1961.3 cM. Based on the observed and estimated genome lengths, the genome coverage of the female and male maps was estimated to be 68.6% and 69.3%, respectively (Table 2).
3.4 Differences in the Recombination Rate Between Sexes
Twenty homologous linkage groups were found, in which the female and male linkage maps shared more than one microsatellite marker, allowing interlocus comparison of the recombination rate between the sexes. Among the sex-specific linkage groups, the distribution of the markers was not uniform between the sexes (Table 3). Fifty pairs of adjacent markers heterozygous in both parents were selected to compare the sex-specific recombination rates (Table 3). In 10 of the 20 linkage groups (LGs 2, 3, 4, 5, 9, 10, 11, 12, 14, and 16), the recombination rate in the female was higher than that in the male for the majority of the adjacent markers. However, in the other four linkage groups (LGs 1, 8, 15, and 17), the recombination rate in the female was lower than that in the male for the majority of the adjacent markers. Compared with a tight linkage of markers in the homologous LG1 of the female, the recombination rate generated a gap between the markers in the male, leading to the formation of two sub-groups (LG1 and LG21). Similarly, two subgroups in the female (LG15 and LG23) were in contrast with a linkage (LG15) in the male. These two sub-groups possibly resulted from the artificial absence of linkage caused by the small sample size (48 individuals) or the lack of microsatellite markers. Comparison of the recombination rates in the linkage maps between the sexes showed that the recombination rate in the female was slightly higher than that in the male. The female-to-male ratio of the recombination rate was approximately 1.07:1 in all adjacent microsatellite markers.
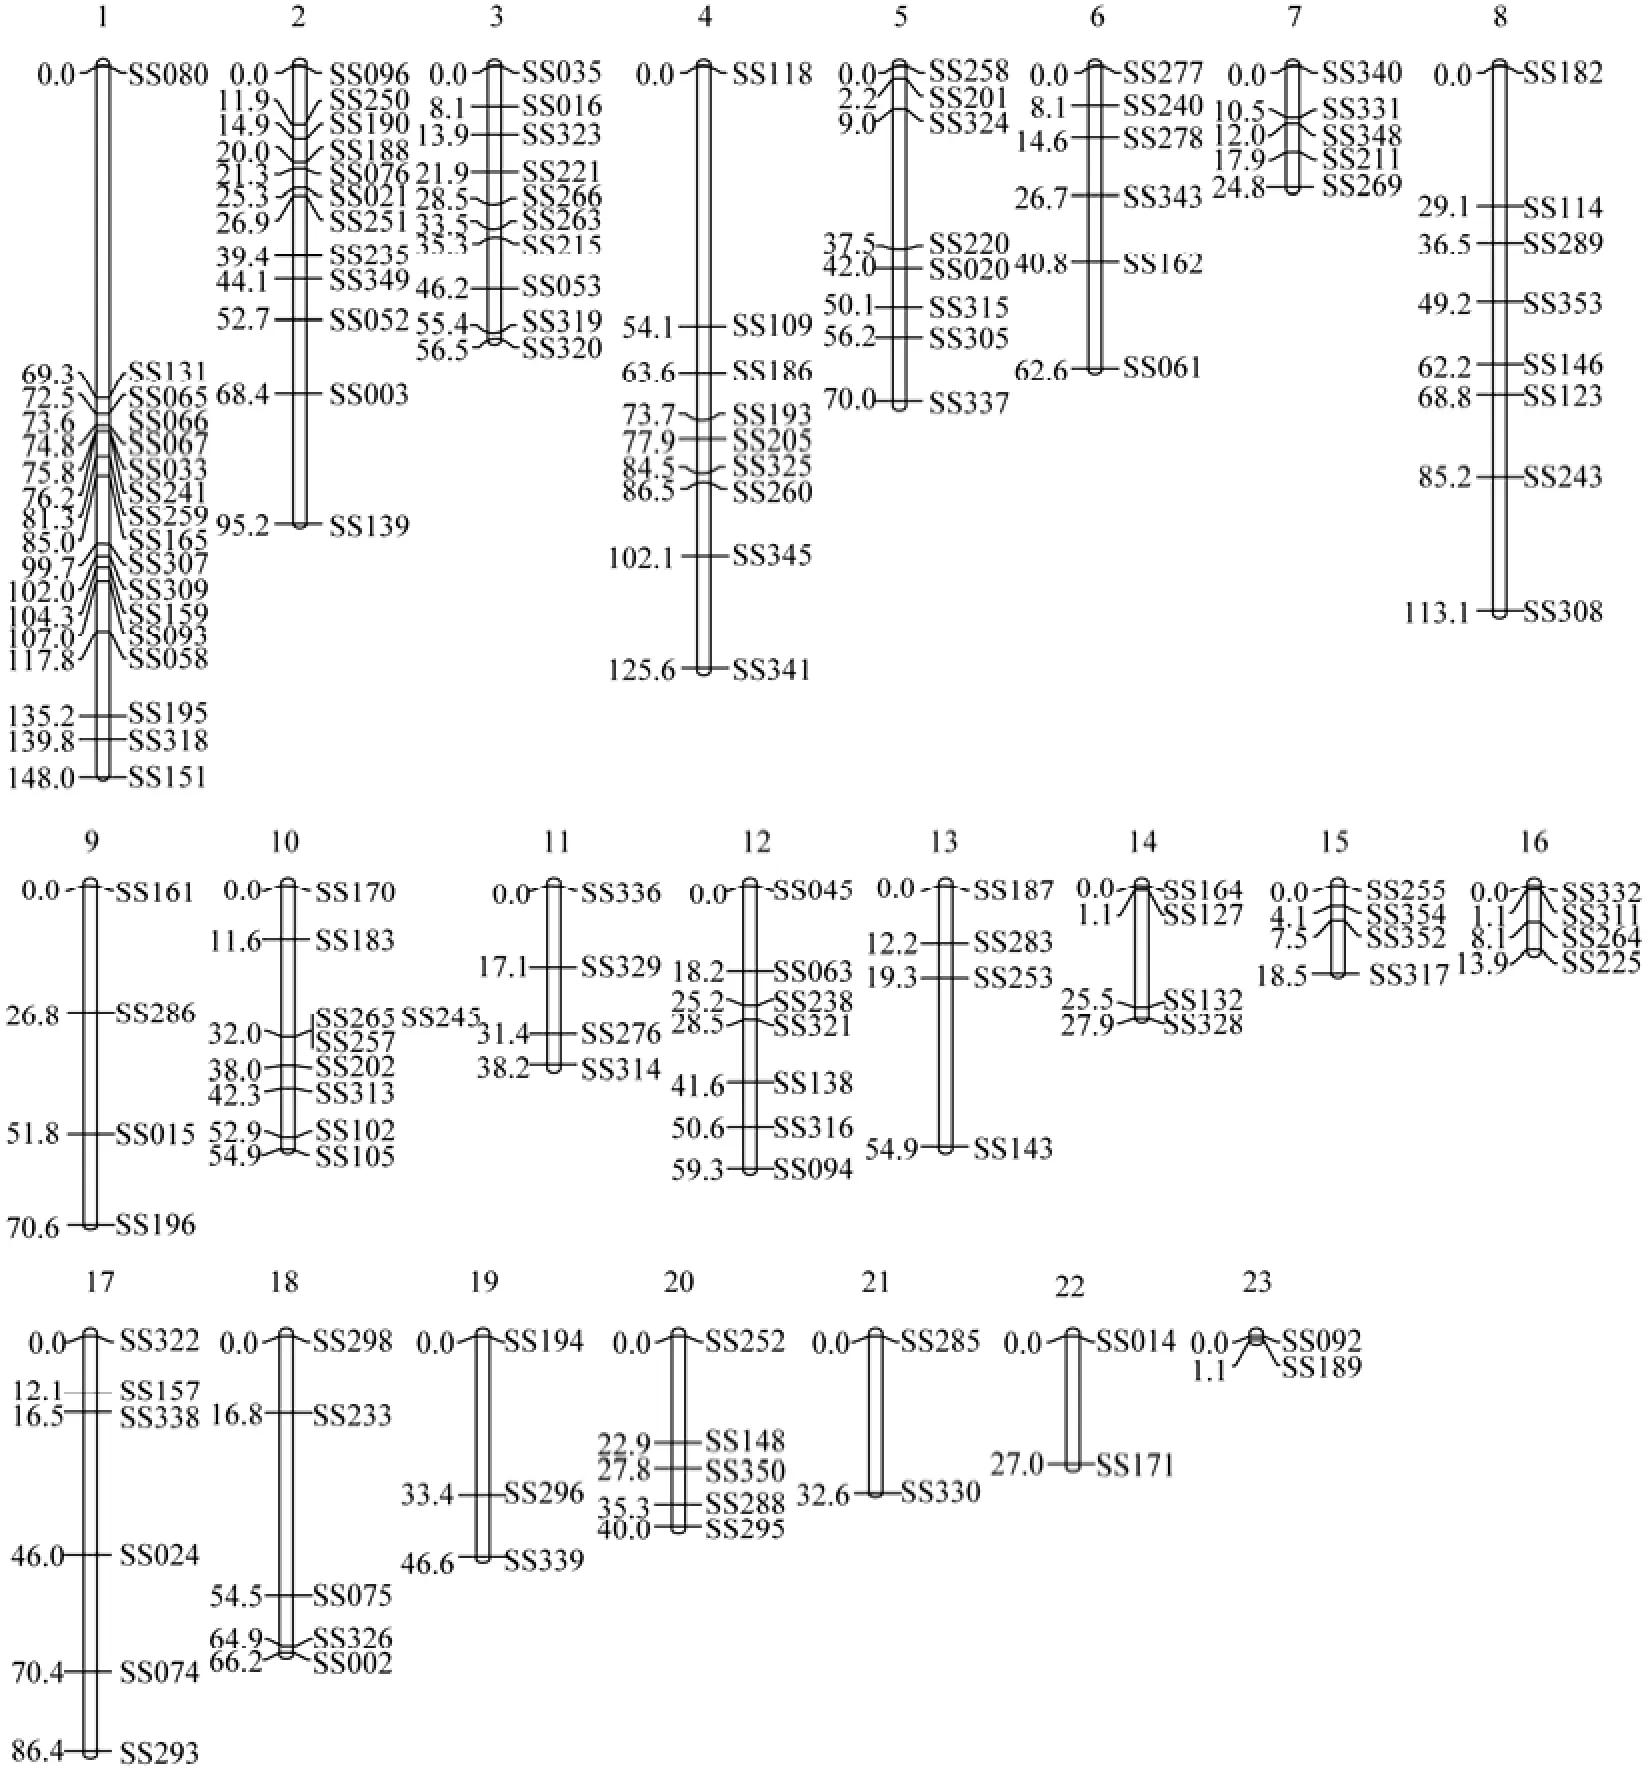
Fig.1 Female-specific genetic linkage map of microsatellites in the black rockfish Sebastes schlegeli.
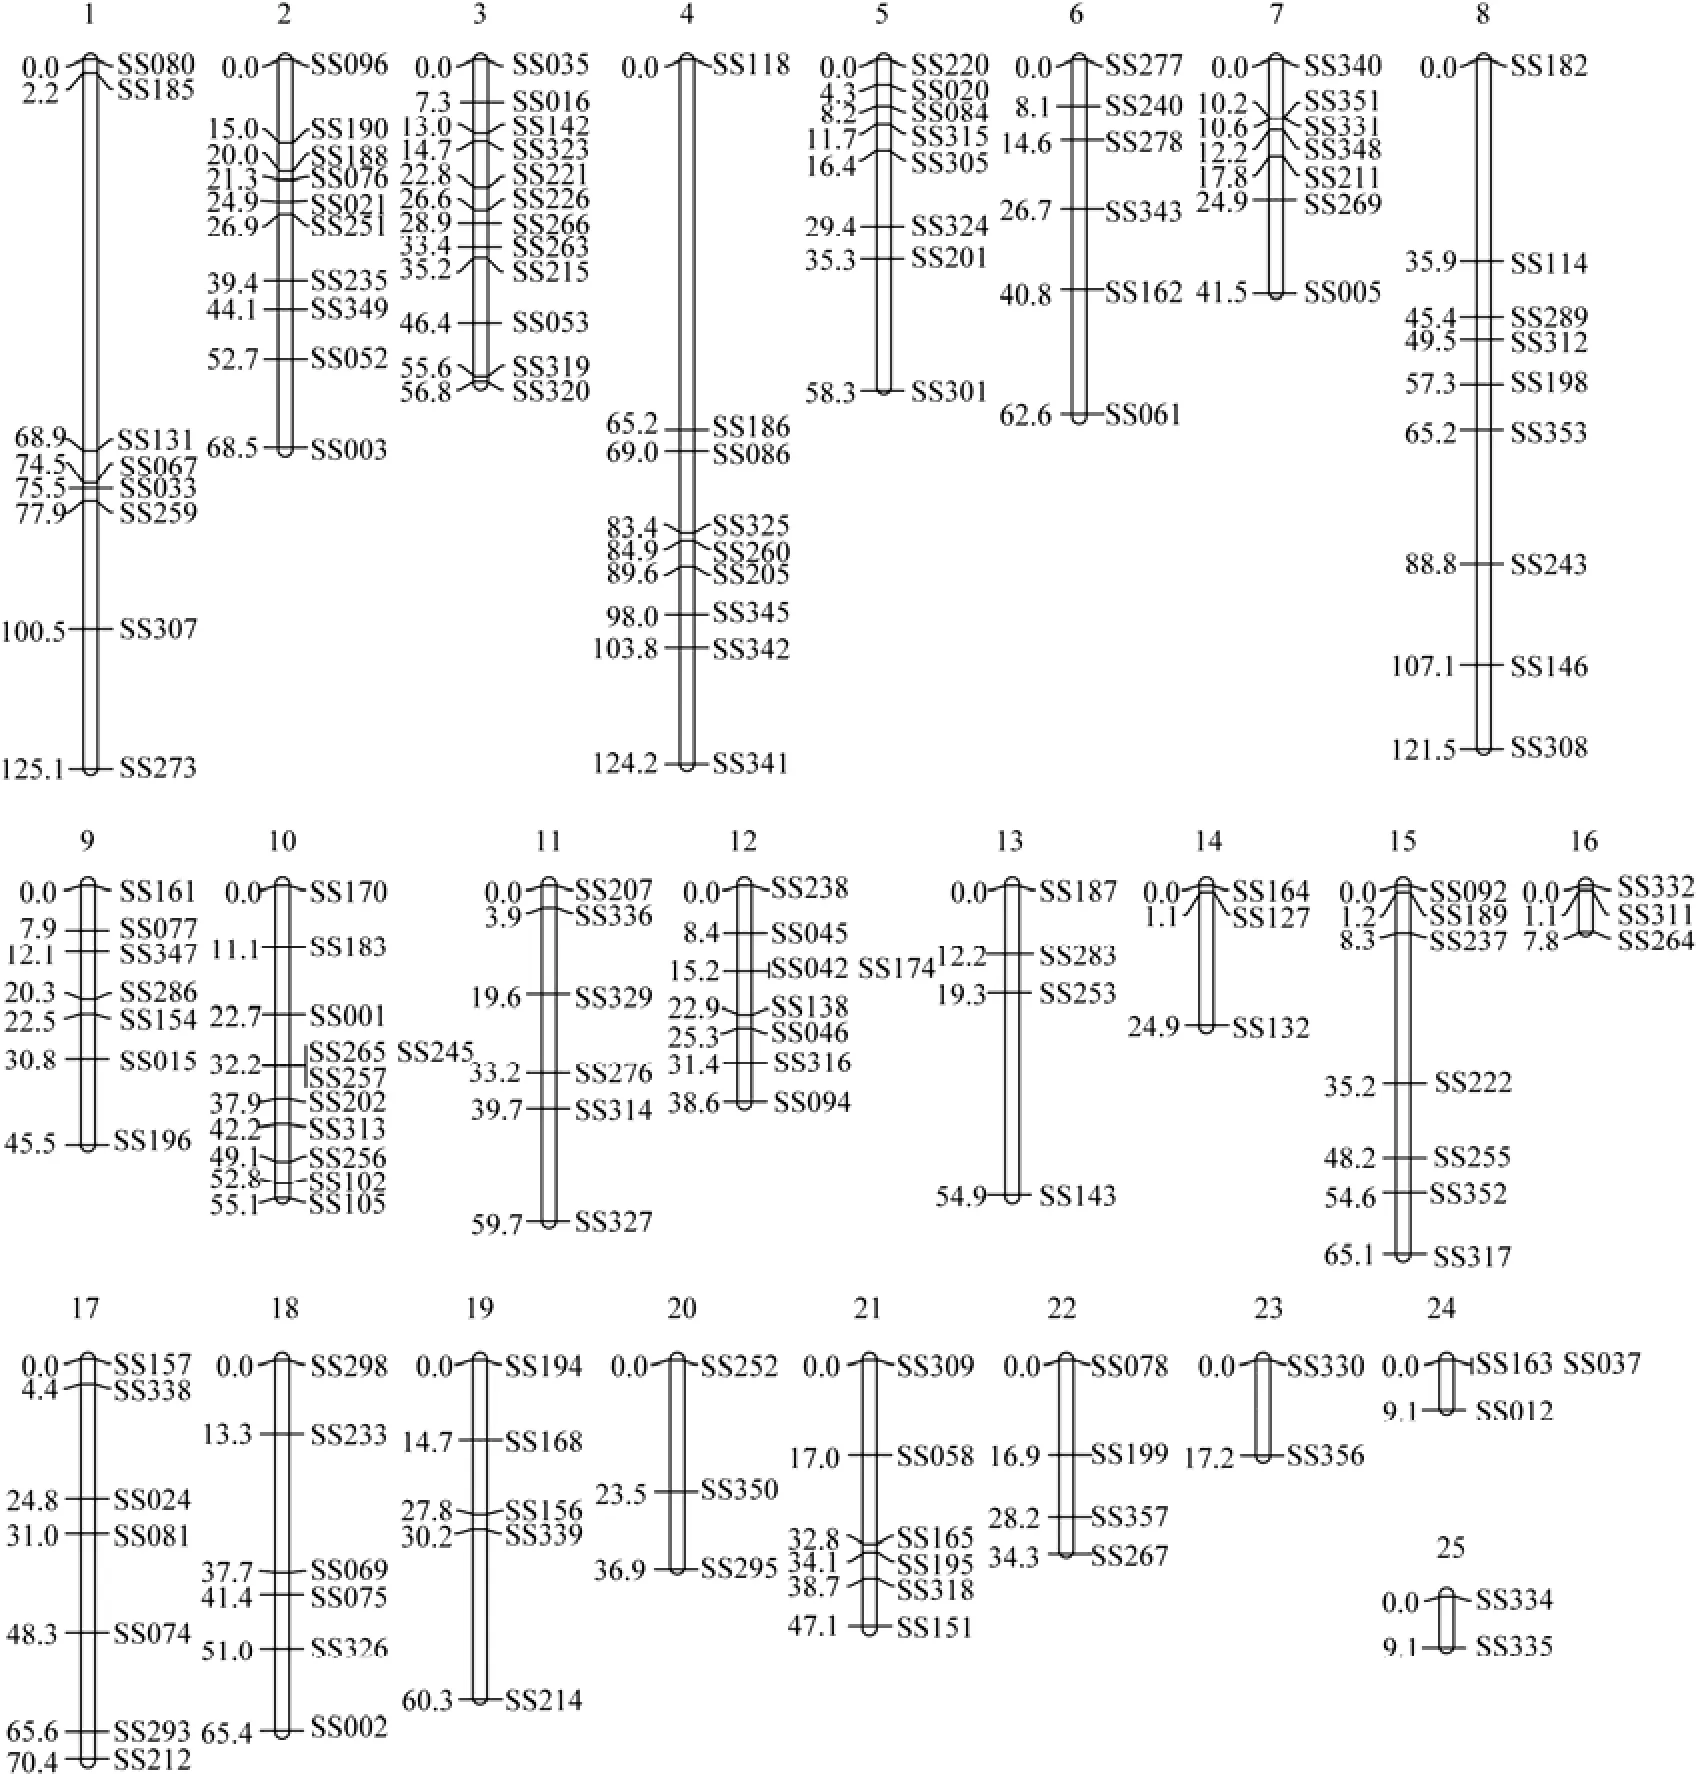
Fig.2 Male-specific genetic linkage map of microsatellites in the black rockfish Sebastes schlegeli.

Table 1 A summary of the female- and male-specific genetic linkage maps of microsatellites in the black rockfish Sebastes schlegeli
(to be continued)

(continued)

Table 2 Characteristics of the male- and female-specific genetic linkage maps of microsatellites in the black rockfish Sebastes schlegeli
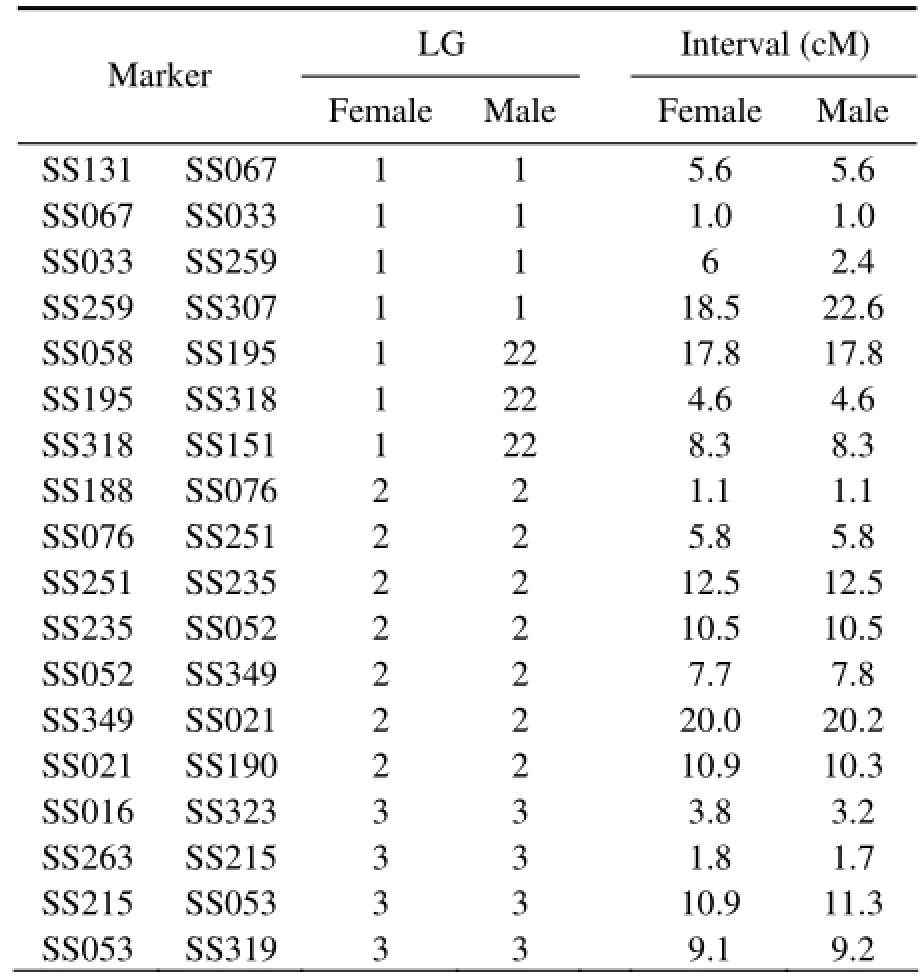
Table 3 Comparison of the recombination rates between female and male genetic linkage maps of microsatellites in the black rockfish Sebastes schlegeli
SS319SS3203 3 1.1 1.1 SS325SS2604 4 2.0 1.5 SS201SS3245 5 6.8 6.7 SS324SS2205 5 28.4 28.9 SS220SS0205 5 4.6 4.3 SS315SS3055 5 5.8 4.3 SS277SS2406 6 8.5 8.5 SS240SS2786 6 7.0 7.0 SS278SS3436 6 15.4 15.4 SS343SS1626 6 17.1 17.1 SS331SS3487 7 1.5 1.6 SS348SS2117 7 5.9 5.6 SS211SS2697 7 6.9 7.1 SS289SS1148 8 13.1 13.9 SS015SS1969 9 18.8 14.7 SS170SS18310 10 11.4 11.3 SS245SS31310 10 10.4 9.9 SS265SS31310 10 10.4 9.9 SS257SS31310 10 10.4 9.9 SS314SS32911 11 20.8 19.1 SS329SS33611 11 20.6 19.5 SS316SS09412 12 8.8 7.2 SS187SS28313 13 12.1 12.1 SS283SS25313 13 7.0 7.0 SS164SS12714 14 1.1 1.1 SS127SS13214 14 24.4 23.8 SS352SS31715 15 11.1 13.9 SS332SS31116 16 1.1 1.1 SS311SS26416 16 7.0 6.7 SS338SS15717 17 4.4 4.4 SS293SS07417 17 15.8 17.1 SS075SS32618 18 10.4 10.4 Total 486.0 456.1
4 Discussion
4.1 Polymorphism of Microsatellite Markers
Microsatellite markers characterized by co-dominant Mendelian inheritance, high polymorphism rate, and wide ranging abundance have become a preferential choice for constructing framework linkage maps (Zhong et al., 2009; Wang et al., 2010). However, related studies on black rockfish have been limited because of the lack of polymorphic molecular markers. A microsatellite-enrichedlibrary of black rockfish was constructed in the present study, and a large number of polymorphic microsatellite markers were developed and characterized. Sex-specific genetic linkage maps of ovoviviparous black rockfish were constructed for the first time. Given the homozygosity of specific markers in both parents, not all the isolated markers were included in the construction of the genetic linkage map. Nevertheless, the collection of markers can be used to evaluate the population structure and genetic diversities of wild and cultured populations, as well as parentage identification of hatchery stocks. Moreover, the microsatellite markers can be applied for effective mapping of QTLs in high-density genetic linkage maps and MAS in breeding programs of black rockfish (Cecilia et al., 2010).
4.2 Linkage Map
The female linkage map consisted of 140 markers of 23 linkage groups with an average inter-marker spacing of 13.3 cM, whereas the male map contained 16 more markers and 25 linkage groups with an average inter-marker distance of 12.4 cM. The female and male linkage maps constructed at the LOD score of 4.0 had 25 and 27 linkage groups, respectively. When the segregation distortion markers were included by decreasing the LOD score to 3.0, a couple of pairs of linkage groups merged together. Finally, 23 and 25 linkage groups were in the female and male maps, respectively. This result was inconsistent with the number of haploid chromosomes in this species (2n = 48) (Zhu and Cai, 2006), possibly because of the small sample size (48 individuals) or the lack of microsatellite markers. A similar discrepancy between the numbers of linkage groups and haploid chromosomes has been observed in Japanese flounder (Coimbra et al., 2003), turbot (Bouza et al., 2007), common carp (Cheng et al., 2009), and red drum (Portnoy et al., 2010). Of the 435 polymorphic markers identified in the present study, 159 and 176 were heterozygous in the female and male parents, respectively. These heterozygous markers could be used for segregation analysis and map construction. Given that a small proportion of these markers were excluded from the final map, more markers are needed and more individuals should be analyzed to fill the gaps for constructing maps with higher resolution and more accurate QTL allocation. With the development of molecular biology techniques, high-throughput sequencing will soon replace the traditional method (Li et al., 2010). By then, a large number of markers can be obtained in a short term, thereby reducing the experiment cost and improving the work efficiency.
4.3 Difference in the Recombination Rate Between Sexes
The relative rates of recombination for both sexes of any species should be known (Singer et al., 2002). The recombination rates of autosomal genes in female and male are commonly different. Significant differences in sex-specific recombination rates have been reported in many fish species. Low recombination rates of males have been identified in zebrafish (2.74:1) (Singer et al., 2002), European sea bass (1.5:1) (Chistiakov et al., 2005), Atlantic halibut (1.89–2.53:1) (Reid et al., 2007), turbot (1.6:1) (Bouza et al., 2007), Japanese flounder (1:0.7) (Cecilia et al., 2010), red drum (1.03:1) (Portnoy et al., 2010), and half-smooth tongue sole (1:1.02) (Jiang et al., 2013). The reduced male recombination rates in teleost fish may vary greatly among the chromosomes and subchromosomal regions. Crossing over is considered less frequent in the heterogametic sex, and most of the vertebrates, including human (Dib et al., 1996) and mouse (Dietrich et al., 1996), comply with this viewpoint (Haldane et al., 1922).
As of this writing, the sex determination of black rockfish remains unclear. When the linkage maps were compared to examine the recombination differences between sexes, we observed that the homologous linkage groups sharing the same microsatellite markers in the female map had slightly higher recombination rates than those in the male map. Such differences were not consistent in all chromosomes. Compared with the data of other fish species, the sex difference in black rockfish (F:M = 1.07:1) was relatively small. This phenomenon is related to the time spent in meiotic prophase in one sex, transcriptional activity of certain genes during meiosis in one sex, and presence of sequences that are recognized by sex-specific enzymes (Lindahal et al., 1991). Evidence showed that recombination along the chromosome depends on the chromosome structure (Lynn et al., 2004). The recombination rate of zebrafish is higher in centromere-proximal regions in females and telomere-proximal regions in males (Singer et al., 2002). The difference in the recombination rate between sexes remains unclear (Singer et al., 2002; Kukekova et al., 2007).
5 Conclusions
In this study, a large number of polymorphic microsatellite markers were isolated from ovoviviparous black rockfish. A microsatellite-based genetic linkage map of black rockfish was constructed for the first time. The female linkage map consisted of 140 markers of 23 linkage groups with an average inter-marker space of 13.3 cM. The male linkage map contained 156 markers of 25 linkage groups with an average inter-marker distance of 12.4 cM. The total length of the female linkage map was 1334.1 cM, which covered 68.6% of the genome. The male linkage map was 1359.6 cM in length, with genome coverage of 69.3%. The recombination rate was higher in females than that in males (female:male = 1.07:1). The constructed linkage map formed the basis for QTL mapping and MAS in genetic breeding programs of black rockfish.
Acknowledgement
This study was supported by the National High-Tech Research and Development Program (Grant Nos. 2012AA10A408 and 2012AA10A402).
An, H. S., Kim, M. J., Park, K., Cho, K., Bae, B., Kim, J., and Myeong, J. I., 2012. Genetic diversity and population structure in the heavily exploited Korean rockfish, Sebastes schlegeli, in Korea. Journal of the World Aquaculture Society, 43: 73-83.
An, H. S., Park, J. Y., Kin, M. J., Lee, E. Y., and Kim, K. K., 2009. Isolation and characterization of microsatellite markers for the heavily exploited rockfish Sebastes schlegeli, and cross-species amplification in four related Sebastes spp. Conservation Genetics, 10: 1969-1972.
Benson, G., 1999. Tandem repeats finder: A program to analyze DNA sequences. Nucleic Acids Research, 27: 573-580.
Bentsen, H. H., and Gjerde, B., 1994. Design of fish breeding programs. Proceedings of the 5th World Congress of Genetics Applied to Livestock Production, Guelph, Canada, 19: 352-359.
Bouza, C., Hermida, M., Pardo, B. G., Fernández, C., Fortes, G. G., Castro, J., Sánchez, L., Presa, P., Pérez, M., Sanjuán, A., de Carlos, A., Alvarez-Dios, J. A., Ezcurra, S., Cal, R. M., Piferrer, F., and Martínez, P., 2007. A microsatellite genetic map of the turbot (Scophthalmus maximus). Genetics, 177: 2457-2467.
Cecilia, C., Fuji, K., Ozaki, A., Hasegawa, O., Sakamoto, T., Morishima, K., Nakayama, I., Fujiwara, A., Masaoka, T., Okamoto, H., Hayashida, K., Tagami, M., Kawai, J., Hayashizaki, Y., and Okamoto, N., 2010. A second generation genetic linkage map of Japanese flounder (Paralichthys olivaceus). BMC Genomics, 11: 554-564.
Chakravarti, A., Lasher, L. K., and Reefer, J. E., 1991. A maximum likelihood method for estimating genome length using genetic linkage data. Genetics, 128: 175-182.
Cheng, L., Liu, L., Yu, X., Wang, D., and Tong, J., 2009. A linkage map of common carp (Cyprinus carpio) based on AFLP and microsatellite markers. Animal Genetics, 41: 191-198.
Chistiakov, D. A., Hellemans, B., Haley, C. S., Law, A. S., Tsigenopoulos, C. S., Kotoulas, G., Bertotto, D., Libertini, A., and Volckaert, F. A., 2005. A microsatellite linkage map of the European sea bass Dicentrarchus labrax L. Genetics, 170: 1821-1826.
Chistiakov, D. A., Tsigenopoulos, C. S., Lagnel, J., Guo, Y. M., Hellemans, B., Haley, C. S., Volckaert, F. A. M., and Kotoulas, G., 2008. A combined AFLP and microsatellite linkage map and pilot comparative genomic analysis of European sea bass Dicentrarchus labrax L. Animal Genetics, 39: 623-634.
Chu, G. N., Jiang, L. M., Yu, H. Y., Wang, Y. N., Jiang, H. B., and Zhang, Q. Q., 2013. Family assessment with microsatellite markers in the ovoviviparous black rock fish Sebastes schlegelii. Oceanologia et Limnologia Sinica, 44 (3): 670-676 (in Chinese with English abstract).
Cnaani, A., Hallerman, E. M., Ron, M., Weller, J. I., Indelmanc M., Kshic, Y., Galld, G. A. E., and Hulata, G., 2003. Detection of a chromosomal region with two quantitative trait loci, affecting cold tolerance and fish size, in an F2tilapia hybrid. Aquaculture, 223: 117-128
Coimbra, M. R. M., Kobayashi, K., Koretsugu, S., Hasegawa, O., Ohara, E., Ozaki, A., Sakamoto, T., Naruse, K., and Okamoto, N., 2003. A genetic linkage map of the Japanese flounder, Paralichthys olivaceus. Aquaculture, 220: 203-218.
Coimbra, M. R. M., Kobayashi, K., Koretsugu, S., Hasegawa, O., Ohara, E., Ozaki, A., Sakamoto, T., Naruse, K., and Okamoto, N., 2003. A genetic linkage map of the Japanese flounder, Paralichthys olivaceus. Aquaculture, 220: 203-218.
Danzmann, R. G., and Gharbi, K., 2001. Gene mapping in fishes: A means to an end. Genetica, 111: 3-23.
Dib, C., Fauré, S., Fizames, C., Samson, D., Drouot, N., Vignal, A., Millasseau, P., Marc, S., Kazan, J., Seboun, E., Lathrop, M., Gyapay, G., Morissette, J., and Weissenbach, J., 1996. A comprehensive genetic map of the human genome based on 5264 microsatellites. Nature, 380: 152-154.
Dietrich, W. F., Miller, J., Steen, R., Merchant, M. A., and Damron-Boles, D., 1996. A comprehensive genetic map of the mouse genome. Nature, 380: 149-152.
Edwards, K., Baker, J. J. H., and Daly, A., 1996. Microsatellite libraries enriched for several microsatellite sequences in plants. Biotechniques, 20: 758-760.
Fuji, K., Hasegawa, O., Honda, K., Kumasaka, K., Sakamoto, T., and Okamoto, N,. 2007. Marker-assisted breeding of a lymphocystis disease-resistant Japanese flounder (Pralichthys olivaceus). Aquaculture, 272: 291-295.
Fuji, K., Kobayashi, K., Hasegawa, O., Coimbra, M. R. M., Sakamoto, T., and Okamoto, N., 2006. Identification of a single major genetic locus controlling the resistance to lymphocystis disease in Japanese flounder (Paralichthys olivaceus). Aquaculture, 254: 203-210.
Haidle, L., Janssen, J. E., Gharbi, K., Moghadam, H. K., Rerguson, M. M., and Danzmann, R. G., 2008. Determination of quantitative trait loci (QTL) for early maturation in rainbow trout (Oncorhynchus mykiss). Marine Biotechnology, 10: 579-592.
Haldane, J. B. S., 1922. The part played by recurrent mutation in evolution. American Naturalist, 67: 5-9.
Hamrick, J. L., Godt, M. J. W., Murawski, D. A., and Loveless, M. D., 1991. Correlations between species traits and allozyme diversity: Implications for conservation biology. In: Genetics and Conservation of Rare Plants. Falk, D. A., and Holsinger, K. E., eds., Oxford University Press, New York, 75-86.
Hubert, S., Higgins, B., Borza, T., and Bowman, S., 2010. Development of a SNP resource and a genetic linkage map for Atlantic cod (Gadus morhua). BMC Genomics, 11: 191.
Jackson, T. R., Ferguson, M. M., Danzmann, R. G, Fishback, A. G., Ihssen, P. E., O’Connell, M., and Crease, T. J., 1998. Identification of two QTL influencing upper temperature tolerance in three rainbow trout half-sib families. Heredity, 80: 143-151.
Jiang, L., Chu, G., Zhang, Q., Wang, Z., Wang, X., Zhai, J., and Yu, H., 2013. A microsatellite genetic linkage map of half smooth tongue sole (Cynoglossus semilaevis). Marine Genomics, 9: 17-23.
Kukekova, A. V., Trut, L. N., Oskina, I. N., Johnson, J. L., Temnykh, S. V., Kharlamova, A. V., Shepeleva, D. V., Gulievich, R. G., Shikhevich, S. G., Graphodatsky, A. S., Aguirre, G. D., and Aclan, G. M., 2007. A meiotic linkage map of the silver fox, aligned and compared to the canine genome. Genome Research, 17: 387-399.
Lee, B. Y., Lee, W. J., Streelman, J. T., Carleton, K. L., Howe, A. E., Hulata, G., Slettan, A., Stern, J. E., Terai, Y., and Kocher, T. D., 2005. A second generation genetic linkage map of tilapia (Oreochromis spp.). Genetics, 170: 237-244.
Li, R., Fan, W., and Tian, G., 2010. The sequence and de novo assembly of the giant panda genome. Nature, 463 (7279): 311-317.
Lindahal, K. F., 1991. His and hers recombinational hotspots. Trends in Genetics, 7: 273-276.
Lynn, A., Ashley, T., and Hassold, T., 2004. Variation in human meiotic recombination. Annual Review of Genomics Humman Genetics, 5: 317-349.
Moen, T., Delghandi, M., Wesmajervi, M. S., Westgaard, J. I., and Fjalestad, K. T., 2009. A SNP/microsatellite genetic linkage map of the Atlantic cod (Gadus morhua). Animal Genetics, 40: 993-996.
Moen, T., Hayes, B., Baranski, M., Berg, P. R., Kjøglum, S., Koop, B. F., Davidson, W. S., Omholt, S. W., and Lien, S., 2008. A linkage map of the Atlantic salmon (Salmo salar) based on EST-derived SNP markers. BMC Genomics, 9: 223.
O’Connel, M., and Wright, J. M., 1997. Microsatellite DNA in fishes. Reviews in Fish Biology and Fisheries, 7: 331-363.
Portnoy, D. S., Renshaw, M. A., Hollenbeck, C. M., and Gold, J. R., 2010. A genetic linkage map of red drum, Sciaenops ocellatus. Animal Genetics, 41: 630-641.
Postlethwait, J. H., Yan, Y. L., Gate, M. A., and Home, S., 1998. Vertebrate genome evolution and the zebrafish gene map. Nature Genet, 18: 345-349.
Reid, D. P., Smith, C. A., Rommens, M., Blanchard, B., Martin-Robichaud, D., and Reith, M., 2007. A genetic linkage map of Atlantic halibut (Hippoglossus hippoglossus L.). Genetics, 177: 1193-1205.
Rexroad, C. E., Palti, Y., Gahr, S. A., and Vallejo, R. L., 2008. A second generation genetic map for rainbow trout (Oncorhynchus mykiss). BMC Genetics, 9: 74.
Sambrook, J., and Russell, D. W., 2001. Molecular Cloning: A Laboratory Manual. Cold Spring Harbor Laboratory Press, New York, 2100pp.
Singer, A., Perlman, H., Yan, Y., Walker, C., Corley-Smith, G., Brandhorst, B., and Postlethwait, J., 2002. Sex-specific recombination rates in zebrafish (Danio rerio). Genetics, 160: 649-657.
Voorips, R. E., 2002. Mapchart: Software for the graphical presentation of linkage maps and QTLs. Journal of Heredity, 93: 77-78.
Wang, J. S., Yu, H. Y., Hui, H., Huang, Z., Wang, X. B., Wang, Z. G., and Zhang, Q. Q., 2010. Isolation and characterization of 21 novel microsatellite markers from spotted halibut (Verasper variegatus). Aquaculture Research, 41: 930-933.
Xie, S. G., Yang, H. S., Zhou, Y., and Zhang, F. S., 2004. Effects of body weight and water temperature on maximum food consumption of juvenile Sebastodes fuscescens (Houttuyn). Chinese Journal of Oceanology and Limnology, 22: 83-88.
Yamada, J., and Kusakari, M., 1991. Staging and the time course of embryonic development in kurosoi, Sebastes schlegeli. Environmental Biology of Fishes, 30: 103-110.
Yoshida, K., Nakagawa, M., and Wada, S., 2005. Multiplex PCR system applied for analyzing microsatellite loci of Schlegel’s black rockfish, Sebastes schlegeli. Molecular Ecology Notes, 5: 416-418.
Zhang, L., Yang, C., Zhang, Y., Li, L., Zhang, X., Zhang, Q., and Xiang, J., 2007. A genetic linkage map of Pacific white shrimp (Litopenaeus vannamei): Sex-linked microsatellite markers and high recombination rates. Genetica, 131: 37-49.
Zhong, Q. W., Yu, Y., Zhang, Q. Q., Wang, Z. G., Yu, H. Y., and Wang, J. S., 2009. Isolation and characterization of twenty novel microsatellite markers for half-smooth tongue sole (Cynoglossus semilaevis). Conservation Genetics, 10: 1617-1620.
Zhu, L., and Sui, F. M., 1999. Biology and artificial culture of Sebastes schiegeli Hilgendorf. Modern Fisheries Information, 14: 21-25 (in Chinese with English abstract).
Zhu, W. T., and Cai, Z. P., 2006. Review on karyotype study of marine fishes in China. Journal of Xiamen University (Natural Science), 45: 125-131 (in Chinese with English abstract).
(Edited by Qiu Yantao)
(Received February 8, 2013; revised April 18, 2013; accepted June 20, 2014)
© Ocean University of China, Science Press and Spring-Verlag Berlin Heidelberg 2014
* Corresponding author. Tel: 0086-532-82031832
E-mail: yuhaiyang@ouc.edu.cn
杂志排行
Journal of Ocean University of China的其它文章
- Ultrastructure Developments During Spermiogenesis in Polydora ciliata (Annelida: Spionidae), a Parasite of Mollusca
- Structures and Antiviral Activities of Butyrolactone Derivatives Isolated from Aspergillus terreus MXH-23
- Effects of Pseudoalteromonas sp. BC228 on Digestive Enzyme Activity and Immune Response of Juvenile Sea Cucumber (Apostichopus japonicus)
- Feasibility of Partial Replacement of Fishmeal with Proteins from Different Sources in Diets of Korean Rockfish (Sebastes schlegeli)
- Effect of Spatial and Temporal Scales on Habitat Suitability Modeling: A Case Study of Ommastrephes bartramii in the Northwest Pacific Ocean
- Profiling and Comparison of Color Body Wall Transcriptome of Normal Juvenile Sea Cucumber (Apostichopus japonicus) and Those Produced by Crossing Albino