Community ecology and spatial distribution of trees in a tropical wet evergreen forest in Kaptai national park in Chittagong Hill Tracts, Bangladesh
2014-04-20FerozMdRabiulAlamProkashDasAbdullahAlMamun
S. M. Feroz • Md Rabiul Alam • Prokash Das Abdullah Al Mamun
Introduction
Biodiversity is a key issue in nature conservation (Wilson 1988; 1992) and species diversity is one of the important components of biodiversity (Itô 1997). Diversity of trees is fundamental to total forest biodiversity, because trees provide resources and habitats for almost all other forest species (Hall and Swaine 1976; Huston 1994; Whitmore 1998; Huang et al. 2003). Generally, tree species diversity in a forest varies greatly from place to place mainly due to variations in biogeography, habitat and disturbance (Whitmore 1998).
Measures of species diversity play a central role in ecology and conservation biology. The most commonly employed measures of species diversity are the Shannon function, species richness (number of species), and evenness (the distribution of abundance among the species, sometimes known as equitability). In addition, spatial distribution of trees has been a major source of interest for plant ecologists because of its potential role in explaining the coexistence of tree species in species-rich forests (Bunyavejchewin et al. 2003). Analyzing the spatial distribution patterns of trees may help to determine the mechanisms important in structuring forest communities because such patterns can reflect underlying processes, such as establishment, growth, competition, reproduction, senescence and mortality, which are affected by environmental factors (Sterner et al. 1986).
The Chittagong Hill Tracts (CHT) region is the major hill range of Bangladesh covering about 10% of the total land area of the country. It consists of diverse landscapes from hills to water bodies and is rich in flora and fauna. Phyto-geographically, it shows the admixture of Indo-Chinese floristic elements. The forests of this region may be broadly classified into tropical evergreen, semi evergreen and deciduous types. Commercial tree plantations, illegal logging, dam mega-projects, and forced displacement are responsible for the accelerated destruction of the precious ecosystems and biodiversity of this region. Rubber, teak and eucalyptus monocultures for export have provoked negative ecological effects and converted the forest into degraded forest land. Despite having only about 10% of the country’s land area, the CHT possess one-third of the flowering plant species of the country. The people of CHT were abruptly deprived of the traditional community ownership of lands, which they used for their homesteads, jhum cultivation, extraction of forest resources, hunting and gathering, etc.
The government implemented reforestation with Tectona grandis L. f. in the degraded areas of CHT. Natural patches have grown up in some places of this region where government could not take reforestation. Our concern was about the present ecological condition and structure of such a natural patch of forest in Kaptai national park of CHT. Therefore, the objectives of our study were (1) to elucidate the woody floristic composition and species diversity of tropical wet evergreen forest in Kaptai national park of CHT, and (2) to quantify spatial distribution and association of trees.
Materials and methods
Study site and sampling plot
The study was conducted on a tropical wet evergreen forest, located at Rampahar (mountain), Kaptai national park (22°29.991′ N and 92°10.722′ E) in the Chittagong hill tracts of Bangladesh. This mountain is about 500 m high from the sea level (Uddin and Hassan 2012) and was declared as a first reserve forest within the Chittagong Hill Tracts (CHTs) in 1875 (Anonymous 1960). The top part of the mountain is like a mossy forest with high humidity. However, the middle part of the mountain is really the tropical wet evergreen forest. In this part, subsoil is yellowish brown. Loamy soil developed on consolidated or semi-consolidated siltstone, sandstone, and clayey soil on shale. Soil on the high hill is excessively drained and less than 1 m depth. The soil pH ranges from 4.5 to 6.0. The mean monthly minimum temperature and the mean monthly maximum temperature are respectively 24°C in December and 35°C in May. Mean annual temperature was 29.6°C. The mean annual rainfall is 2,540 mm. The maximum wind velocity recorded is 96.54 km/h.
A sampling plot was less than 400 m2on the Yaeyama Islands, Japan for the vegetation survey (Niiro et al. 1974; Suzuki 1979; Niiro 1981; Miyawaki 1989), and was 400 m2on Iriomote Island, Japan for the forest stratification study (Hozumi 1975). Therefore, our sampling plot was established in the middle portion of the mountain as a representative of the forest and had an area of 900 m2(30 m × 30 m) that was divided into 36 quadrats (5 m × 5 m). The plot, which faced south with a slope of 31.2°, was 77.11 m above sea level. All woody plants were numbered and identified to species according to the nomenclature of Das and Alam (2001). The measurements obtained for the area were: tree height (H) and stem diameter at a height of 10% H/10 of trees height (D0.1H).
Data analysis
Species dominance
Dominance of a species was defined by the importance value IV (%) which was calculated from the equation proposed by Feroz et al. (2008):

where niis the number of individuals of the ith species, aiis the basal area at a height of H/10 of trees belonging to the ith species, fiis the number of quadrats in which the ith species appeared, and S is the total number of species.
Species-area relationship
The expected number of speciesSqappeared within the number of quadrats (q) selected at random from the total number of quadrats (Q) was calculated from the equation proposed by Shinozaki (1963) (cf. Hurlbert 1971):

where qiis the number of quadrats in which the ith species occurred. The Sq-values were obtained for q-values of 1, 2, 4, 8, 16, 32 and 36.
Species diversity
The following two indices of Shannon’s (MacArthur and MacArthur 1961) H′ and Pielou’s (1969) indexJ′were used to measure woody species diversity or equitability (evenness).


where N is the total number of individuals and the unit of H′is bit, or the unit of entropy (e.g. Goldman 2005).
Spatial distributions of trees

where xjis the number of individuals in the jth quadrat, andis the total number of quadrats when the quadrat size is u. The qu-values were 36, 16, 8, 4, and 2, respectively, for the uvalues of 1 (5 m × 5 m), 2, 4, 8, and 16. On the other hand, mean crowdingis defined as the mean number of other individuals per individual per quadrat (Lloyd 1967) as follows:

If the basic component of the spatial distribution is a single individual tree, individual trees are considered to be randomly distributed whenaggregately distributed whenand uniformly distributed whenfor any quadrat size.
Interspecific spatial association
On the basis of the concept of mean crowding proposed by Lloyd (1967), Iwao (1977) derived the ω-index for analyzing spatial associations between species.

For m*ABm*BA≥ mAmB

For m*ABm*BA≤ mAmB
In Eq. (7), m*ABquadrat-based mean crowding on species A by species B, is defined as:

where Q is the total number of quadrat existed in species A and species B, and nAjand nBjare the number of individuals belonging to the jth quadrat in species A and species B, respectively.
Similarly, m*BA, quadrat-based mean crowding on species B by species A, is defined as:

The interspecies quadrat-based mean crowding indicates the mean number of individuals of the other species per individual of the subject species per quadrat. On the other hand, m*A, quadratbased mean crowding within species A, is defined as:

Similarly, m*B, quadrat-based mean crowding within species B, is defined as:

The interspecies quadrat-based mean crowding indicates the mean number of the other individuals per individual of the subject species per quadrat. The symboland mBstand for the mean density per quadrat in species
A and species B, respectively. The value of ω changes from the maximum of +1.0 for complete positive interspecies association, through 0.0 for independent association, to the minimum of -1.0 for complete negative association.
Dendrogram
The dendrogram for analyzing the degree of spatial association of species was constructed following Mountford’s (1962) method, or unweighted paired-group method using arithmetic averages (Sneath and sokal 1973).
Results and discussion
Floristic composition
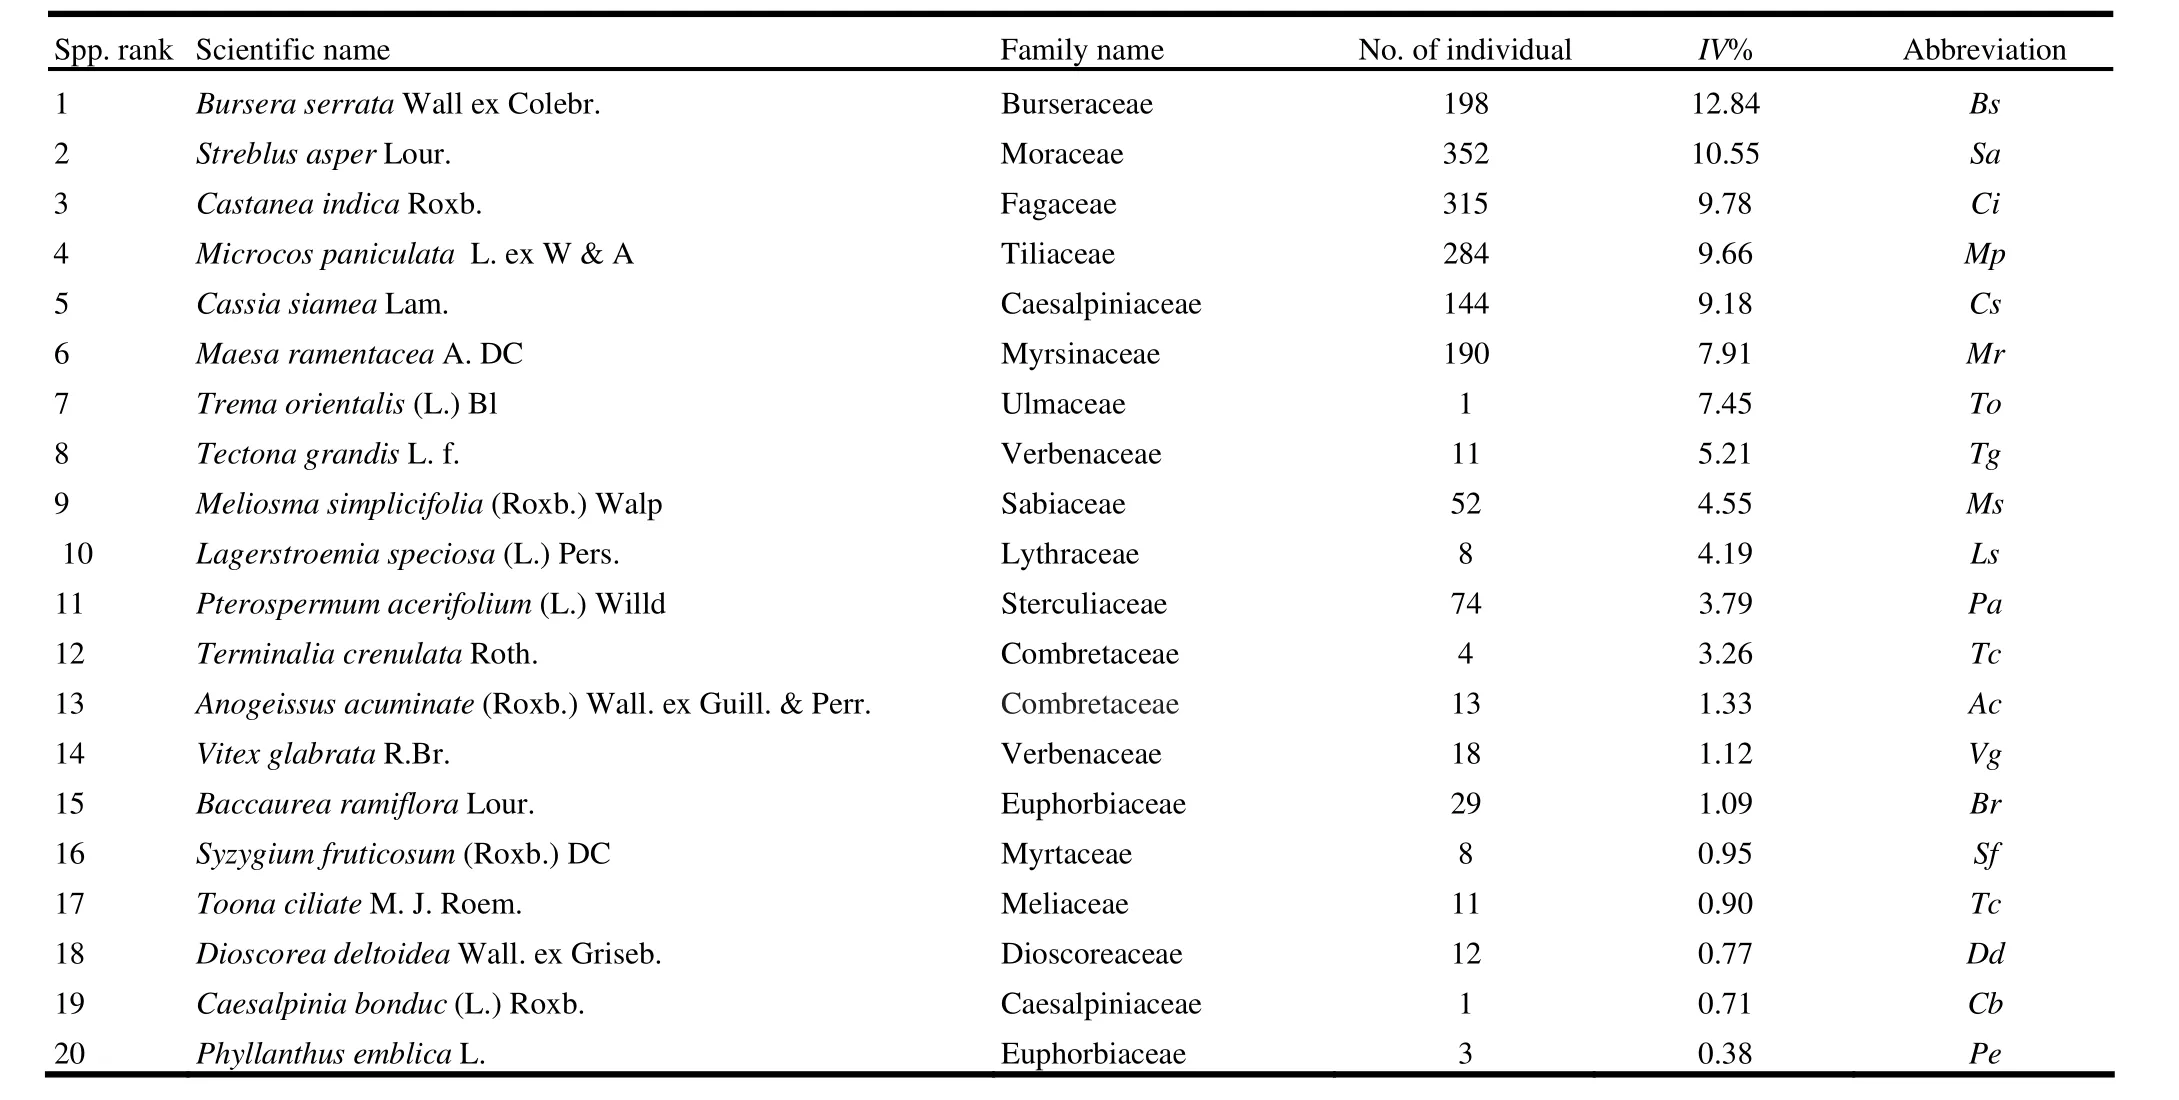
We recorded 25 families, 37 genera, 40 species and 1771 woody individuals in the sampling plot. Out of 25 families, 19 families (76%) consisted of a single species. Euphorbiaceae and Moraceae were the most species-rich families, each of which had four species. Out of 37 genera, 34 genera (92%) consisted of a single species. Castanopsis, Ficus and Terminalia were the most specious genera; each of which contained two species. Of the 40 species, 10 species (25%) were represented by single individuals. Bursera serrata Wall ex Colebr. was the most dominant species in terms of the highest importance value (13%) in the total stand (Table 1). Therefore, Kaptai national park in Chittagong Hill Tracks is dominated by B. serrata. However, this area is highly populated by Streblus asper Lour. with the highest number of regeneration. Trema orientalis (L.) Bl was typically a light demanding species as it appeared only in the top canopy with the seventh highest importance value, but had no regeneration (Table 1). This phenomenon may indicate shade-intolerance for T. orientalis, i.e. early successional species (pioneer species), and also indicate a sign of threatening for the present forest. In addition, some other species (approximately 27%) with only a few individuals (one to three) may be only shade species or light demanding species which may also be in danger for their survivability.
Species-area relationship
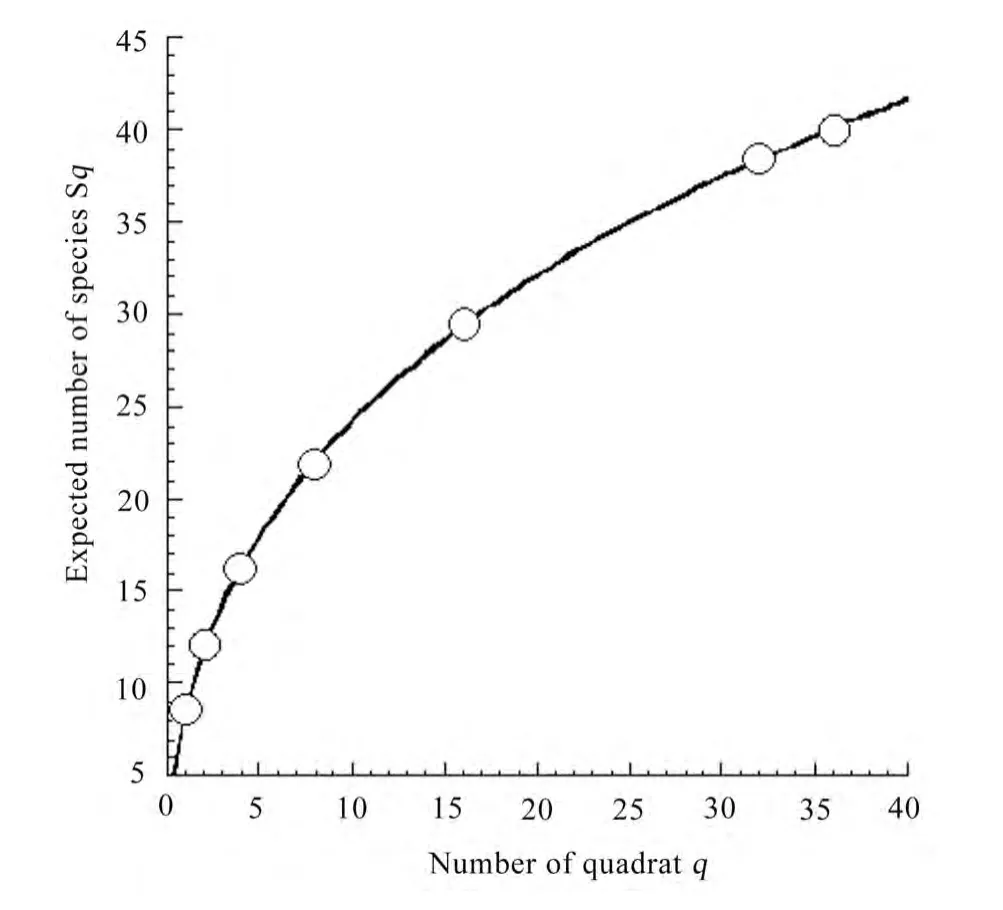
As shown in Fig. 1, the expected number of species increased with an increase in the number of quadrats. The relationships of the expected number of species Sqto the number of quadrats q in the total stand were accurately approximated using the following equation (Ogawa 1980; cf. Hagihara 1995):

where c and d are coefficients, and Smaxis the expected maximum number of species.
The expected maximum number of species was 140 in the total stand. This result indicates many species may newly invade the forest in the near future as the recorded total number of species is 40. Hence, this type of changing species composition, i.e. appearance of new species (Fig. 1) and disappearance of species (approximately 30% species having only one to two individuals in the total stand) (Table 1) in the present forest may express instability of floristic composition.

Fig. 1: Species-area relationship (area of one quadrat: 5 m × 5 m). The curve is given by Eq. (8), where c = 9.13, d = 0.50 and Smax = 144 (R2 = 0.99) for the total stand.
Species diversity
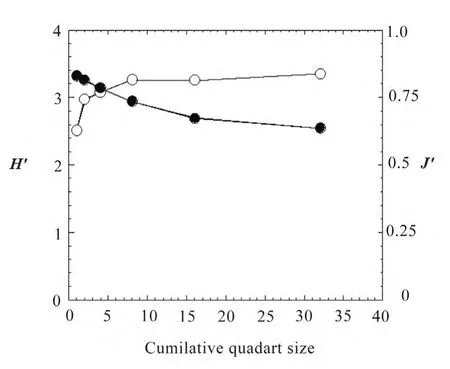
The values of Shannon′s index H′ and Pielou′s index J′(evenness) were respectively 3.36 bit and 0.63 (Table 2). The values of H′ and J′ in the present forest are higher than the values of those reported in a subtropical evergreen broadleaf forest in Guangzhou, South China (Wu et al. 2010), whereas species richness and expected maximum number of species Smaxare lower in the former forest than those in the latter forest. It can be concluded that the tropical wet evergreen forest in Chittagong hill tracts, Bangladesh and the subtropical evergreen broadleaf forest in Guangzhou, South China seem to be most likely unequilibrium in floristic composition with moderately high species diversity, because the values of Smaxare higher than the species richnesses for both of the forests. The subtropical evergreen broadleaf forest in Okinawa, Japan is stable with very high species diversity, because the expected maximum number of species (62) is very close to the total numbers of species (60) (Table 2). Nevertheless, the values of H′ increased rapidly up to 8 (200 m2) quadrats and then the values tended to be became stable despite an increase of area, whereas the values of J′ gradually decreased with increasing area (Fig. 2). This result suggests that the sample area of 200 m2in this forest would be sufficient for measuring H′. On the other hand, the trend of J′may indicate that the rate of equality of individuals among the different species decreased with increasing area.

Table 1: List of 50% woody species of the total stand in order of species rank determined by importance value IV (dominant species)

Table 2: Comparison in species diversity, expected maximum number of species, tree density and basal area among the same type of forests in the tropics

Fig. 2: Relationships of H′ and J′to area. Open circle, H′; closed circle J′. The values of H′ and J′are the mean of ten samples, which were randomly selected.
Spatial distribution of trees
The spatial distribution patterns of trees for the total stand and top five dominant species are shown in Fig. 3 based on unit-sizerelation (Iwao 1972). The distribution pattern for the total stand was completely random, because therelation lines did not differ from the Poisson line. Similarly, Castanea indica and Cassia siamea were randomly distributed. On the other hand, Bursera serrata, Streblus asper and Microcos paniculata showed a different trend in spatial distribution, i.e. at the beginning there seemed to exist an aggregate distribution and later tended to be random distribution with increasing quadrat size. Therefore, dominant species showed random distribution for large area. Thus, they may maintain total stand’s random distribution. Such type of distribution pattern is probably general for the tropical forest.

Fig. 3: Relationships between mean crowding mu and mean density mu with successive changes of quadrat sizes for spatial distribution of total stand and five dominant species
Spatial association between species
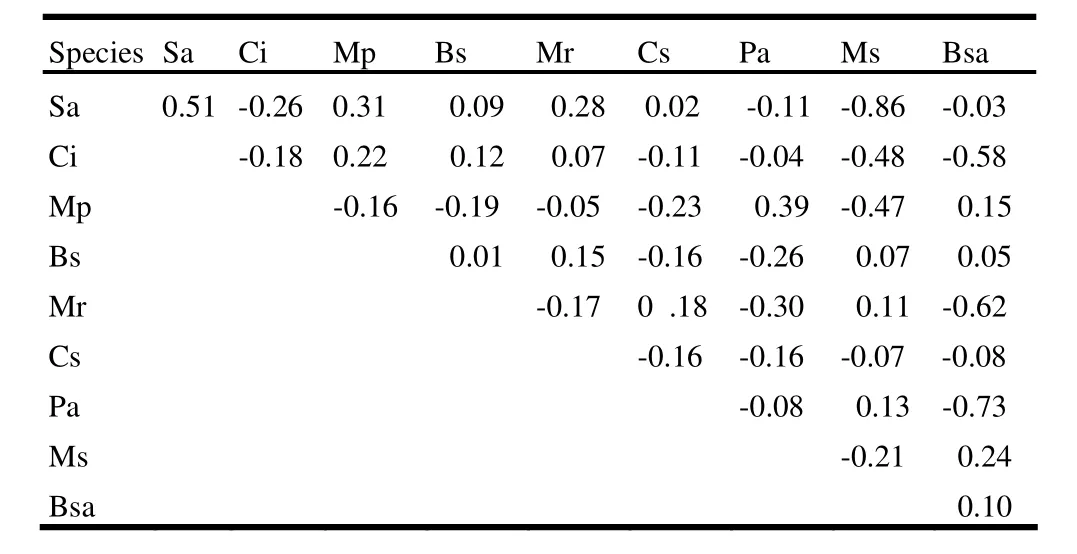
The spatial association between species was analyzed by the ωindex (Iwao 1977) for 25% of the total number of species (i.e. 10 species) in terms of their number of individuals arranged in descending order (Table 3). The strongest positive interspecific association occurred between Streblus asper Lour. and Castanea indica Roxb. (ω =0.51). Microcos paniculata L. ex W & A and Meliosma simplicifolia (Roxb.) Walp (ω =0.39), Streblus asper and Bursera serrata Wall ex Colebr. (ω =0.31), and Streblus asper and Cassia siamea Lam. (ω = 0.28) showed a modest association). A total of 58% species associations was completely negative i.e. ω = -1. As a whole, most species were spatially associated weakly with each other.
The cluster analysis of interspecific spatial pattern of association between species produced three major clusters (A, B and C), though the degree of spatial association or the degree of overlapping within these clusters was a little less than 0.0 (Fig. 4), i.e. clusters A, B and C were slightly exclusive with each other. However, almost species in the clusters were modestly associated with each other. Cluster A contains four species (Streblus asper, Castanea indica, Bursera serrata and Cassia siamea), cluster B contains three species (Maesa ramentacea, Pterospermum acerifolium and Baccaurea sapida) and cluster C contains three species (Microcos paniculata, Meliosma simplicifolia and Vitex glabrata).

Table 3: Spatial association of ten major species in terms of their large number of individuals analyzed by the value of ω-index
The result of cluster analysis showed a general pattern of species association, in which species pairs were spatially independent at all or most small clusters. Species of cluster B and C have similar habitat preference, where different species existed, whereas those of cluster A have specific preference, where a moderately strong association of species exists. It is likely that stands of species from all clusters are mosaics of complete habitat and pioneer habitat. As a whole, it is apparent that all patches in this forest community have similar habitat and regeneration niches, which could be a phenomenon for a young growth forests. Thus, the existence of habitat and regeneration niche may be important factor in the maintenance of diversity in this forest.

Fig. 4: Cluster diagram showing species spatial association (see Table 1 for species abbreviation). Sa -- Streblus asper, Ci--Castanea indica, Mp--Microcos paniculata, BS -- Bursera serrata, Mr-- Maesa ramentacea, Cs -- Cassia siamea, Pa-- Pterospermum acerifolium, Ms --Meliosma simplicifolia, Bsa -- Baccaurea sapida
Tree density and basal area
Tree density and basal area for D0.1Hin the present forest were 19,677 ha-1and 39.0 m2·ha-1, respectively, at the stand level (H ≥0.10 m) (Table 2). These results are lower than the values of 62,452 ha-1and 50.3 m2·ha-1(H ≥ 0.10 m) in a subtropical evergreen broadleaf forest in Okinawa, Japan (Feroz et al. 2006). However, the tree density in the tropical wet evergreen forest in CHTs, Bangladesh is much lower than that of 119,836·ha-1(H > 0.0 m) in a subtropical evergreen broadleaf forest in Guangzhou, South China, whereas the basal area in the formaer forest is slightly higher than that of 35.0 m2·ha-1(H > 0.0 m) in latter forest (Wu et al. 2010). The above results suggest that the present forest is lowly populated with a little high value for basal area, whereas the subtropical evergreen broadleaf forest in Guangzhou, South China is highly populated with low value for basal area. On the other hand, the subtropical evergreen broadleaf forest in Okinawa is well populated with a high value for basal area.
Acknowledgements
We are grateful to Chief Conservator of Forest (CCF), Bangladesh Forest Department, Agargaon, Sere Bangla Nagor, Dhaka, for permitting us to construct a sampling plot in the tropical wet evergreen forest of Kapatai National Park, CHT. Special thanks go to Mr. Md. Zahidul Kabir, DFO and Mr. Md. Zahidur Rahman, ACF, Pulp Wood Division, Rangamati North, CHT for their cooperation and valuable suggestions. We greatly appreciate Dr. A. T. M. Rafiqul Haque, Assiociate Professor, IFESCU, Chittagong University, for his kind help in species identification.
Anonymous. 1960. Working plan of the Chittagong Hill Tracts North and South Forest Division for the period from 1953-54 to 1972-73, vol. 2. Working Plan Division, Forest Department, the Government of East Pakistan, pp. 1-89.
Bunyavejchewin S, LaFrankie JV, Baker PJ, Kanzaki M, Ashton PS, Yamakura T. 2003. Spatial distribution patterns of the dominant canopy dipterocarp species in a seasonal dry evergreen forest in western Thailand. Forest Ecology Management, 175: 87–101.
Das DK, Alam MK. 2001. Trees of Bangladesh. Chittagong, Bangladesh: BFRI.
Feroz SM, Hagihara A, Yokota M. 2006. Stand structure and woody species diversity in relation to the stand stratification in a subtropical evergreen broadleaf forest, Okinawa Island. Journal of Plant Research, 119: 293–301.
Feroz SM, Yoshimura K, Hagihara A. 2008. Stand stratification and woody species diversity of a subtropical forest in limestone habitat in the northern part of Okinawa Island. Journal of Plant Research, 121: 329–337.
Goldman S. 2005. Information theory. New York: Dover Publications, p.400.
Hagihara A. 1995. The Size-Dependence curve as a generalized Competition-Density curve. Japanese Journal of Forest Planning, 24: 15–23.
Hall JB, Swaine MD. 1976. Classification and ecology of closed-canopy forest in Ghana. Journal of Ecology, 64: 913–951.
Huang W, Pohjonen V, Johansson S, Nashanda M, Katigula MIL, Luukkanen O. 2003. Species diversity, forest structure and species composition in Tanzanian tropical forests. Forest Ecology and Management, 173: 11–24.
Hurlbert SH. 1971. The nonconcept of species diversity: a critique and alternative parameters. Ecology, 133: 125–133.
Huston MA. 1994. Biological Diversity. Cambridge: Cambridge University Press, p. 681.
Hozumi K. 1975. Studies on the frequency distribution of the weight of individual trees in a forest stand. V. The M-w diagram for various types of forest stands. Jpn J Ecol, 25: 123–131.
Itô Y. 1997. Diversity of forest tree species in Yanbaru, the northern part of Okinawa Island. Plant Ecology, 133: 125–133.
Iwao S. 1972. Application of the*m–m method to the analysis of spatial patterns by changing the quadrat size. Researches on Population Ecology, 14: 97–128.
Iwao S. 1977. Analysis of spatial association between two species based on the interspecies mean crowding. Researches on Population Ecology, 18: 243–260.
Lloyd M. 1967. Mean crowding. Journal of Animal Ecology, 36: 1–30.
MacArthur RH, MacArthur JW. 1961. On bird species diversity. Ecology, 42: 594–598.
Miyawaki A. (Eds.) 1989. Vegetation of Japan Vol. 10. Okinawa & Ogasawara. Tokyo: Shibundo Co. Ltd., p. 676. (in Japanese)
Mountford MD. 1962. An index of similarity and its application to classificatory problems. In: P.W Murphy (ed), Progress in Soil Zoology. London: Butterworths, pp. 43–50.
Niiro Y. 1981. An outline of vegetations found on Mt. Omoto and its vicinity (in Japanese). In: Science Report on Biota on Mt. Omoto and its Neighboring Areas, a Candidate Site for Nature Conservation Areas of Okinawa Prefecture. Naha: Okinawa Prefectural Government, pp. 55–114.
Niiro Y, Miyagi Y, Shinjo K, Shimabukuro H. 1974. Vegetation of the Yaeyama Islands. In: S. Ikehara (ed), Ecological Studies of Conservation of the Ryukyu Islands (1) Naha: University of the Ryukyus, pp. 5-36. (in Japanese).
Ogawa H. 1980. Structure and Function of Populations. Tokyo: Asakurashoten, p.221. (in Japanese)
Pielou EC. 1969. An Introduction to Mathematical Ecology. New York: John Wiley & Sons, Inc.
Shinozaki K. 1963. Note on the species-area curve (in Japanese). In: Proceedings of Annual Meeting for the Ecological Society of Japan, Tokyo, p 5.
Sneath PHA, Sokal RR. 1973. Numerical Taxonomy. San Francisco: W. H. Freeman and Company, p. 572.
Sterner RW. 1986. Testing for life historical changes in spatial patterns of four tropical tree species. Journal of Ecology, 74: 621–623.
Suzuki K. 1979. Vegetation der Ryukyu-Inseln, Japan - Pflanzensoziologische Studien der Ryukyu-Inseln VI. Bulletin of the Institute of Environmental Science and Technology, Yokohama National University, 5: 87–160. (in Japanese with German summary)
Uddin SN, Hassan MA. 2012. Angiosperm flora of Rampahar reserve forest under Rangamati district in Bangladesh. L. Liliopsida (Monocots). Bangladesh J Plant Taxon, 19: 37–44.
Whitmore TC. 1998. An Introduction to Tropical Rain Forests. London: Oxford University Press, p. 282.
Wilson EO. 1988. Biodiversity. Washington, D.C.: National Academy Press.
Wilson EO. 1992. The Diversity of Life. Cambridge: Harvard University Press..
Wu M, Feroz SM, Hagihara A, Xue L, Huang ZL. 2010. Vertical stratification, floristic composition and woody species diversity in a subtropical evergreen broadleaf forest (Dinghushan Nature Reserve, South China). Tropics, 19: 9–20.
杂志排行
Journal of Forestry Research的其它文章
- Carbon sequestration in Chir-Pine (Pinus roxburghii Sarg.) forests under various disturbance levels in Kumaun Central Himalaya
- Regional differences of water conservation in Beijing’s forest ecosystem
- Spatial modeling of the carbon stock of forest trees in Heilongjiang Province, China
- Spatial heterogeneity of factors influencing forest fires size in northern Mexico
- Diversity, regeneration status and population structure of gum- and resin-bearing woody species in south Omo zone, southern Ethiopia
- Floristic diversity and regeneration status of woody plants in Zengena Forest, a remnant montane forest patch in northwestern Ethiopia
