Atomistic Modeling of Spall Response in a Single Crystal Aluminum
2014-04-16ValisettyDongareRajendranandNamburu
R.R.Valisetty,A.M.Dongare,A.M.Rajendranand R.R.Namburu
1 Introduction
Spallation[Knott(1973)]is a dynamic failure event that occurs when a flyer plate is impacted against a target plate at very high velocities.In particular,it refers to the ejection of material from the back end of the target plate in plate impact experiments,[Curran,Seaman,and Shockey(1987)].The material typically experiences strain rates in the range of 105to 107/sec.The impact initially generates compressive waves in the plates which upon reflection from the stress free normal surfaces become tensile and interact with each other giving rise to a tri-axial stress transient in a small spall region in the back of the target plate.Under the condition of a highly triaxial stress state,multiple voids are observed to nucleate in the spall region which grow and coalesce to form microscopic cracks to cause the loss of stress carrying capability and eventual failure of the material.Several plate-to-plate experiments were done in the past to understand the spall failure and spall strength.Various continuum solid mechanics theories were proposed to understand the experimental results but these theories are stymied by that facts that spall is a highly transient event and it occurs in a very small region and that the experiments give only the visor based ‘back of the target plate’data and not the in-situ spall region data.Compare this situation to a strain rate test in a bar experiment which assures a region of uniform stress state in the tested bar specimen which makes for a simpler reduction of the test data.
Most plate-to-plate spall experiments were aimed at quantifying the effects of the microstructure and loading conditions on the spall strength of the material From the results of these experiments were proposed continuum solid mechanics theories for understanding the void nucleation,coalescence at the onset of spall failure.Even though peak strain rates of 105s−1to 109s−1were achieved in the experiments[Minich,Cazamias,Kumar,and Schwartz(2004);Rivas,Zurek,Thissell,Tonks,and Hixson(2000);Fowler,Worswick,Pilkey,and Nahme(2000)];[Tamura,Kohama,Kondo,and Yoshida(2001);Moshe,Eliezer,Dekel,Ludmirsky,Henis,Werdiger,Goldberg,Eliaz,and Eliezer(1998);Moshe,Eliezer,Dekel,Henis,Ludmirsky,Goldberg,and Eliezer(1999);Kanel,Razorenov,Utkin,Fortov,Baumung,Karow,Rusch,and Licht(1993);Eliezer,Gilath,and Bar-Noy(1990);Meyers(1994)],because the underlying deformation is controlled by small time scales it was difficult to identify and characterize the fracture processes using experiments alone or from the continuum solid mechanics approaches.
Among such theories were the empirical yield functions based formulations[Gurson(1977);Tvergaard,and Needleman(1984)]to study ductile failure and mechanism of void growth and porosity in porous materials.As strain rate effects were key to understanding the spall deformation,[Rajendran,Dietenberger,and Grove(1989);Bodner and Rajendran(1995);Thomason(1999);Wright,and Ramesh(2008)]considered the effects of strain rates and microstructure on nucleation,growth,and coalescence For example,[Rajendran,and Fyfe(1982)]studied failure strains in aluminum and copper at high strain rates under uniaxial stress state.On modeling of spall failure using yield functions,several review articles are available:[Kanel,Seaman,and Antoun(2003)].
Almost all continuum models that described the nucleation and growth of voids and their effects on the degradation of strength in solids under both quasi-static and dynamic loading conditions were based on empirical formulations.The model parameters to describe the failure processes were mostly adjusted to fit some exper-imental measurements.The models often require estimating several parameters that cannot be directly measured from any dynamic experiments.In general,from the extensive metallographic analyses on the recovered specimens,the dynamic failure process events of the void nucleation,growth and coalescence were inferred,and were introduced into the continuum models with the aid of approximations.The voids nucleation and growth were modeled through the evolution of some state variables,such as a cumulative damage or a void volume fraction.
Many spall failure theories were postulated using dislocations,void volume fraction,grain boundary sliding mechanisms,etc.,mechanisms that are all sub-continuum scale.Due to the advent of computer enabled large scale statistical mechanics simulations in the last decade,it is now possible to perform molecular dynamics(MD)simulations to get an atomic level detail needed for the physical understanding and interpretation of the evolution of voids,beginning with the void nucleation itself.Void growth mechanisms in single-crystal systems were studied by[Seppala,Belak,andRudd(2004a);Dongare,Rajendran,LaMattina,Zikry,and Brenner(2008);Traiviratana,Bringa,Bensona,and Meyers(2008)].Void coalescence at strain rates≥108s−1was studied by[Seppala,Belak,and Rudd(2004b);Seppala,Belak,and Rudd(2005)].The simulations suggested that void growth occurred through the heterogeneous nucleation of dislocations from void surfaces and void coalescence through a development of slip planes.
MD simulations were used for studying material strength under shock loading by[Bringa,Caro,Wang,Victoria,McNaney,Remington,Smith,Torralva,Van Swygenhoven,(2005)].Atomistic simulations of shock induced microstructural evolution and spallation in single crystal nickel were conducted by[Srinivasan,Baskes,and Wagner,(2007);Srinivasan,and Baskes,(2007)].Void nucleation mechanisms in nanocrystalline Cu were studied by[Dongare,Rajendran,LaMattina,Zikry,and Brenner(2009a)]for an uniaxial tensile strain condition at a constant strain rate of 108s−1,and for a shock loading by[Dongare,Rajendran,LaMattina,Zikry,and Brenner(2010a)].These studies highlighted the triple junctions of grain boundaries as significant sources for void nucleation and growth.The simulations by[Dongare,Rajendran,LaMattina,Zikry,and Brenner(2009b),Dongare,Rajendran,LaMattina,Zikry,and Brenner(2010b)]demonstrated two additional stages of void growth in nanocrystalline Cu at a constant strain rate of 108s−1.These were attributed to mechanical separation/sliding at triple junction points,and to a shearing of the disordered material that formed surrounding the voids Later[Dongare,Rajendran,LaMattina,Zikry,and Brenner(2011)]extended their high strain rate MD simulations to include grains in a size range of 6-12 nm.They reported an increasing spall strength and a power-law dependence of the void nucleation strains and time durations for the with respect to an increasing strain rate for the nanocrystalline Cu.A quantitative description of plastic deformation by dislocation glide versus grain boundary sliding in nanocrystalline Cu was reported by[Vo,Averback,BellonOdunuga,and Caro(2008)].Besides for void growth,MD simulations were demonstrated for studying various hardening mechanisms in atom systems including the effects of dopants on properties of thin films[Xiong,and Chen(2008)]and for inclusions[Dong,and Atluri(2012)].
The above studies indicated an increased role for strain rate to affect the damage generated in the material than the grain boundary facilitated dislocation type mechanisms.But shock loadings cause even higher strain rates and give rise to a stress state that is fundamentally different from the ones that are usually seen in simple uniaxial strain rate simulations.A unique but a transient stress state is generated in the shock loading which affects the damage in a fundamental away.This aspect was studied in this paper.Since spall events occur at very high strain rates,the MD simulations are naturally suitable for analyzing the atomic scale void causing events in spall failures.If the void growth based mechanisms are present across all atomistic,micro,and macro scales,then it may be possible to seamlessly bridge the scales.The fact that the strain rates are similar in all scales allows for investigating the results of the MD simulations for insights into the void growth mechanisms which in turn may help gain a better understanding of the results from the plate experiments and later to come up with better models for improving the finite element/difference based continuum modeling.
MD simulations are now extended into the continuum scales using multi-scale modeling such as coarse graining,hot-qc,meshless methods:local Petrov-Galerkin(MLPG)method[Atluri,and Shen(2002);Shen,and Atluri(2004a)],the lattice Green function method[Tewary,and Read(2004)],the 3D T-Trefftz Voronoi cell based finite element method[Dong,and Atluri(2012)].But for these methods to succeed,a good understanding of the extent and duration of the spall transients must be established,so that the transition zones from lower to the upper scales can properly be managed.To date most MD simulations of shock dwelled only on the shock,or the positive pressure regime to gain an understanding of the atom level equation of state but not the spall regime.In this paper,attention was focused on isolating the spall affected region in a shocked single crystal atom system and on understanding the causes for spall in those regions.
This paper focuses on the deformation and failure response of single crystal aluminum under shock loading conditions.The objective was to investigate how the damage was initiated by the fast changing stress state in the spall transient.The damage was tracked via voids from the event of void nucleation to void coalescence.
The results suggested that the stress triaxiality parameter(χ),de fined as the ratio of the pressure(P)to the effective stresshad a strong influence on the nucleation of the voids and it subsequently affected the post-elastic stress vs.strain behavior(plasticity)and the spall strength( flow stress).It was observed that at the atomistic level,the voids began nucleating as the effective stress reduced to a minimum causing a sharp drop in the stress triaxiality factor.At this condition,the stress state became hydrostatic:all the three normal stressesand all the three shear stressesThis was then taken to imply that the void nucleation was caused by having the crystal lattice pulled apart with nearly the same magnitude of tensile stress in all the three directions simultaneously.This also indicated a no preference for the lattice orientation with respect to the shock travel direction and was con firmed by considering the shock travel in three different lattice directions.Many experiments have hinted at and continuum theories have assumed the primacy of the stress triaxility condition in spall;this has been demonstrated in the present study for the single crystal aluminum at atom level
The effect of impact velocities and crystal orientation were documented on the following responses:1.spall width,2.spall duration,3.axial strains at the minimum triaxiality condition,4.axial strains at the onset of void nucleation,5.void volume fraction at the onset of void coalescence,6.the peak axial stress during the void nucleation phase
The objective in this paper was to seek the mechanical response that contributed to the spall failure in the single crystal aluminum.But unlike for the shock pulse,the duration and extent cannot be controlled during the spall event which was short in duration and small in extent in the shock direction.Because of this,special effort was focused on identifying and isolating the spall region and obtaining the detailed stress vs.strain information in the spall width region.The computational details are presented in Section 2.The shock wave propagation,the extent and duration of the spall transient,and the stress-strain response along the length of the atom systems in the shock direction are discussed in Section 3.The effects of the impact velocity and lattice orientation are discussed in Section 4.
2 Computational Details
Large scale molecular dynamics simulations are carried out using the LAMMPS code[Plimpton,(1995)]and the embedded atom method(EAM)potential of[Mishin,Farkas,Mehl and Papaconstantantopoulos(1999)]to de fine the interactions for Al.The EAM potential is fitted to give a good description of the defect structures,the stacking fault energies as well as surface energies for Al.It was demonstrated by[Voter(1994);Tsuru,and Shibutani(2004)]to give a good description of the material failure behavior in nano-crystalline Al.
The present study focused on the spall behavior of a single crystal Al atom system with a fcc lattice structure with a lattice constant of 4.05 Å.The initial atoms systems were created with dimensions of∼60nm x∼60 nm x∼92 nm in the<100>,<110>,and<111>orientations that corresponds to 19847694 atoms,19808440,and 19789389,respectively.Periodic boundary conditions were applied in the x and y directions and z the direction was kept free.The as created systems were then equilibrated to have zero pressure at 300K for 600 ps using a time step of 2 fs.To achieve shock-induced deformation,the first 1 nm of the sample was chosen as the piston and the atoms in the piston were given an impact velocity in the z direction of the target sample.This end is referred to as the impacted end or left end of the atom system in the following text.The velocity was maintained for 9.6 ps,a time duration enough to send an approximate square shock pulse into the atom system.Large scale MD simulations were conducted for the shock compression followed by the spall expansion for three lattice orientations.For a 1stlattice orientation of<1,0,0>in the shock front travel direction,the atom system was subjected to the following impact velocities:0.6 km/s,0.7 km/s,0.8 km/s,1.01 km/s,1.2 km/s,1.5 km/s.For the 2ndand the 3rdlattice orientations of<1,1,0>and<1,1,1>,respectively,in the shock front travel direction,the atom system was subjected to only one impact at 1.5 km/s.For all the impacts,the contact was maintained with the shock piston for 9.6 ps.
2.1 Distributions of pressure,stress,and strain in the shock travel direction
As the impact was underway,equations of motion of the atoms in the atom systems were solved using the ‘nve’statistical procedure of the LAMMPS code.The elements of the atomic-level stress tensor were calculated as

whereαandβdenote the Cartesian coordinates,Ω0is the atomic volume,Fijis the force on atomidue to atomj,Mjis the mass of atomi,andviis the velocity of atomi.While,a recently developed atomic-level stress tensor[Shen,and Atluri(2004b)]proves to be more accurate under conditions of non-homogeneous deformation,the above atom level stress definition was still used in this study,because it was assumed that in the current simulation of the shock front and spall transients regions existed in the atom system wherein the stresses and strains were reasonably uniform.When the stress tensor is averaged over atoms in such regions,average stressesσx,σy,σzcan be computed for such regions.From these stresses,the effective stress was computed as follows:

MD simulations provide,at any given time,snapshots,i.e.the atom level stresses and displacements of an atom system.But because the stress-strain conditions were changing very drastically in the shock direction from being very highly compressive under the shock to being tensile under the spall,the atom level definitions of stress were not directly useful.However,because periodic boundary conditions were used in directions normal to the shock travel direction,the atom system behaved like an in finite plate in directions normal to the shock travel direction Therefore,only distributions of stress/strain in the shock direction,or z-axis,were relevant here.
To obtain such distributions,the atom system was divided into several atom sections or slices in the shock direction,and mechanical responses were all averaged over all atoms in such atom sections.The procedure was tested for various section widths and a width of 8.1 Å that is approximately equal two lattice constants was used in this study.This section width allowed for de fining 114 sections with each section having∼117,212 atoms for the case of Al system oriented in the<1,0,0>lattice direction and in equilibrium at 0 GPa and 300◦K prior to the simulation.For all the subsequent snapshots during the course of the simulations,the section widths were discerned to have roughly the same number of atoms(∼117,212)in each section,and were computed by counting off the number of atoms from the impacted end.Each section was then given a section identity number‘Sn’with Section S1starting at the impacted end on the left and Section S114ending at the free end on the right.The averaging procedure for each section allowed for using the engineering definition for strain,which was computed from a simple change in the atom slices’thicknesses.The strain rate response was computed from the atom section averaged axial strains separated by a 0.1 ps interval.
The values for the pressure(P),particle velocity(Us),stress in the shock direction(σz),strain in the shock direction(εz),effective stress(σe)in the shock direction,the strain rate,are averaged for all the atoms in each section for all the simulations listed above.The triaxiality parameter(χ)was computed as the ratio of P overσe.When the section averaged responses are plotted against a section identity number(‘Sn’),with the number increasing along the shock direction from S1at the impacted end on the left side of the atom systems to S114at the free end on the right side,the monitoring of the mechanical response variables along the shock direction was made possible in this study.
2.2 Voids in the bulk atom systems
In addition to the mechanical responses of stress and strain,damage in the single crystal atom system was investigated in terms of voids.To calculate them,a three dimensional grid of cubic cells was superimposed over the deforming atom system and clusters of two or more contiguous empty cells were identified as voids[Zhigilei,Ivanov,Leveugle,Sadigh,and Bringa(2004);Dongare,Rajendran,LaMattina,Zikry,and Brenner(2009b)].A cell size of 4.06 Å was chosen to ensure at least several atoms in a cell deemed not part of any void Once a void is identified its volume is easily computed as the product of the number of the empty cells in it and the basic cell volume and its contribution to the void volume fraction as the ratio of its volume to the atom system volume.In this manner,voids were computed first for the bulk of the atom systems.
Even though,in the current simulations the void evolution was tracked from the nucleation stage,through coalescence to the final ejection of material through spall,attention was focused only until the peak void formation stage,because,during this phase,the axial stress reached a peak value and began to drop off.This stage was recognized by the beginning of the reducing trend in the void totals.Once voids begin to coalesce,one of two things were observed:1.either an ‘incipient spall’,in which voids recover and material heals completely,or 2.‘above threshold’spall,in which the voids coalesce into a few and the material ejects in spall separation.In the present simulations,both kinds of spall were observed and will be reported upon.
2.3 Voids in the atom sections
Void volume fraction is an important material damage parameter that traditional continuum strength theories have often used.In these theories,the material stress carrying capability is related to the amount of void volume fraction present in the material,and the void volume fraction itself was computed from the section met-allographic studies.Therefore,in order to consider the presently computed void volume fraction as a material damage parameter,the computed voids should be widely and evenly(homogeneously)distributed in the spall width region.Also because there is non-uniform deformation along the length of the atom systems,i.e.high compression under the shock pulse to high tension under the spall,and because the spall width,wherein the most voids are found,itself can be much smaller than the length of the atom systems,the void volume fraction will not be useful if computed dividing the voids’volume over the entire bulk of the atom systems.
Therefore,the aforementioned voids that were computed over the entire bulk of the atom systems were mapped onto the individual atom slices by keeping track of the locations of the empty cells that were identified for each void.After such a mapping,each atom slice was individually examined for the presence of the bulk voids in it,and the total numbers of the bulk voids present in each atom section were calculated and ‘Nv’was assigned to represent the atom-section-specific void totals.Similarly,portions of the bulk voids contained in each atom section were tallied by the volume and divided by the respective atom section volumes and were assigned ‘vf’to represent the atom-section-specific void volume fractions.In the discussions that follow from now onwards,Nvandvfwill thus be deemed atom-section-specific,and will be used to keep track of the void nucleation and void coalescence in each atom slice separately.These parameters will be used to identify the section averaged stress state that precipitated the void nucleation and the void coalescence in the atom sections and thus spall in the atom systems
2.4 Types of results reduced from the data from the MD simulations
From the large scale MD simulations,snapshots were generated to include atom level stresses and displacements at 0.1 ps interval.Using the 8.1 Å thick atom section averaging process,the following four types of results were obtained from these snapshots and were used in characterizing the spall in single crystal aluminum:
1.snapshots of the atom section averagedσz,εz,andχvs.atom sections to give an idea of how these averaged section responses are varying in the shock travel direction at any given time,(Figures 1-4);
2.temporal variation of the atom section averaged P,σz,εz,σe,Nvandvfto give an idea of how they are varying in each of the atom section with respect to time,(Figures 5 and 6);
3.variation with respect to theεzof P,σz,σe,Nvandvfin each of the atom section,which were obtained by pairing the same time values,(Figures 7-13);and
4.for some selected responses,the effect of the crystal orientation and impact velocities,(Figures 14 and 15).
3 Spall development in the Single Crystal Aluminum
The objective in this paper was to seek the mechanical response that contributed to the spall failure in single crystal aluminum.In order to study the spall failure,effort was first focused on characterizing the extant and duration of the spall width and on obtaining the detailed stress vs.strain information in the atom sections in the spall width region.But unlike for the shock pulse,the duration and extent for spall cannot be controlled in simulations because spall occurs as a result of the interaction between reflecting tensile waves which are much harder to control.Because of this,special effort was focused on identifying and isolating the spall region.This effort is described next.
3.1 Spall development
Because of the impact,the atom system was moving while also undergoing axial deformation.The length dimension was constantly changing with some portions of the atom system under compression due to the shock pulse and others under tension due to spall.Given this situation,the axial distribution plots do not lend to an easier comparison if plotted against the actual length dimension of the atom systems on the x-axis in xy-plots.To remove this difficulty,the axial distributions are presented against the atom section identity numbers(Sn)on the x-axis in the plots.By plotting in this manner,plots of a mechanical response variable,such as aσz,made at different times could be compared.
As an example of the spall development,plots of the stress-strain distributions along the length of the atom system in the shock direction are shown in Figure 1 for the 1.5 km/s velocity impact and for the shock travel in the<1,0,0>lattice direction.The responses were averaged using 8.1 Å thick atom slices and are plotted against the atom slice numbers,S1-S114.Since there were 114 atom sections,each curve shown in the figure was plotted with 114 data points.Although snapshots or time histories were computed at 0.1 ps intervals,only six of them are shown in the figure at times 1.4 ps,3.3 ps,8.6 ps,9.4 ps,16.7 ps,30 ps,respectively,measured from the instant the contact with the shock piston was removed.
Although the P and Usare traditionally used to highlight the shock pulse travel,the spall transient evolution is better described by the evolutions ofσzandεz.For this reason,σzandεzdistributions were presented in the figures along with the distributions of the triaxiality parameter,χ,asσzgrew into the tensile range.First Figure 1(a)shows the shock front centered in the middle of the atom system as it was traveling right towards the rear,or stress-free,surface.A stress free condition can be seen taking hold at the left end of the system(tail of the pressure wave)after the contact with the shock piston had just been removed.For the impact velocity of 1.5 km/s,the peak shock wave pressure was calculated to be∼35 GPa.The material behind the shock front can be seen to be under a compressive strain of∼0.228.After the shock front reached the right free end of the atom system,it reflected back into the atom system in Figure 1(b)as an unloading tensile wave.σzcan be seen dropping to zero in a very thin atom section near the right stress-free end.This unloading tensile wave interacted with the tail of the pressure wave as shown in Figures 1(c)-1(f).As a result,the values forσzandεzwere observed to be increasing in tension and the beginning of the spall transient can be seen in Figure 1(c).The sequence of Figures 1(c)through 1(f)show the moving of the positive peak value of the axial stress,to left towards the impacted end as the spall width was developing.The extent of the spall width and spall failure itself can be discerned by the atom sections in which theεzwas increasing.
In Figures 1,χ,the triaxiality parameter,is shown with the dashed curves in blue color.This parameter was observed to be dropping to a minimum in the atom sections in which the spall transient was developing,as can be seen in Figure 1(d).
This seems to indicate that the spall occurred in and near the sections in whichχfirst dropped into the negative region and became a minimum,i.e.when the stress state reached the peak triaxiality condition.This same trend was observed for the four impacts at velocities at 0.7 km/s,0.8 km/s,1.01 km/s and 1.2 km/s for the shock travel in the<1,0,0>lattice orientation,and for the 1.5 km/s impacts in the<1,1,0>and<1,1,1>lattice directions.The role of triaxiality parameter will be Section 4.
3.2 Initial estimates for the spall width
In order to focus the effort on the‘above threshold’spall regions of the atom system and to uncover the spall inducing mechanisms,the extent(width)and duration of the spall region were established first.For this purpose,spatial distributions ofεz,and the strain energy density,and the temporal variation ofwere considered.
In Figure 1,snapshots or axial distributions of several mechanical responses are plotted,at six different times after the impact,to give an idea of how the shock pulse was morphing into a spall transient.By focusing only onεz,snapshots of theεzdistribution are plotted,in Figure 2,vs.atom section numbers,S1-S114,in the shock direction for the 0.6 km/s,0.7 km/s,0.8 km/s,1.01 km/s,1.2 km/s,and 1.5 km/s velocity impacts in the<1,0,0>lattice direction.For each impact velocity,a different‘time after impact’was selected closer to the full spall development to highlight the extant of the atom sections prone to the ‘above threshold’spall.The combinations of the ‘time after impact’and ‘impact velocity’are indicated in the legend to the curves in the figure.

Figure 1:Snapshots of the shock pulse travel and the spall transient development as captured by the axial distributions of the axial stress,triaxiality parameter,and axial strain vs.section identity numbers in the shock direction.All results are for the 1.5 km/s impact and for the shock in the<1,0,0>lattice direction.Snapshots(a)through(f),respectively,were taken at times 1.4 ps,3.3 ps,9.1 ps,9.4 ps,16.7 ps,30 ps after the contact with the impact piston was removed.
In Figure 2,theεzreached only to a high of∼0.125 for the 0.6 km/s impact in atom sections S40-S64.At this level of straining no damage was observed in the simulation.Furthermore,as the time progressed,an unloading of theσzwas observed and along with a full recovery ofεz.Although some voids were observed,they were con firmed to have fully disappeared.These observations con firmed only an‘incipient spall’for this impact velocity.Therefore,anεzvalue of 0.125 was considered a minimum for naming an atom section to be a part of the initial estimates for the spall widths.
In Figure 2,significant spike in theεzcan be noted for the higher velocity impacts.The above 0.125 strain level was observed in many atom sections.Using theεz>0.125 level and plots such as Figure 2,the following initial spall prone atom section ranges were proposed:S57-S72,S58-S75,S59-S78,S59-S81,S60-S82for the 0.7 km/s,0.8 km/s 1.01 km/s,1.2 km/s and 1.5 km/s velocity impacts,respectively,and for the<1,0,0>crystal orientation.In other words,the initial spall widths were proposed to be approximately 16,18,20,23,and 23 sections thick.A note of caution is warranted here though.In the spirit in which the atom sections were proposed,the spall widths do not refer to any physical thicknesses,but rather to the fact that each atom section contains∼117,212 atoms.As the axial strain changes,the widths change in the physical dimension.
In the centers of the initially proposed spall widths,theεzcan be seen rising unbounded indicating an ‘above threshold’spall.In the periphery of the initially proposed spall widths,an ‘incipient’spall was expected with someσzunloading,εzrecovery,Nvreduction,and some mending of the material.Using these observations,the initially proposed spall widths will be narrowed and materialσzvs.εzresponse will be identified in spall.
A traditional understanding of the spall failure is that it is caused by the axial stress,σz,reaching above a material spall strength value.Therefore,to check if the proposed spall ranges can also be con firmed by the risingσzvalues,the maximum value ofσz,i.e.was found in each atom section during the spall transient,and is plotted in Figure 3 vs.the atom sections numbers,S1-S114,in the shock direction for the 0.6 km/s,0.7 km/s,0.8 km/s 1.01 km/s,1.2 km/s and 1.5 km/s impact velocities and for the<1,0,0>crystal orientation.Figure 3 indicates that thereaches an approximate range of 6-6.5 GPa in the atom sections S40-S64and a peak value of∼6.5 GPa in the atom sections S54-S58.From this peak value
of the stress,one can expect to see a rising tensileεz,and thus a spall failure,in the atom sections in the S54-S58range but this was not con firmed by the risingεzresults in Figure 2.Figure 3 in fact shows that in the initially proposed spall sections,thewas dropping off.This clearly highlights the fact that the σzmerely reaching a peak value all by itself could not have caused the spall failure in the single crystal atom systems.This point is further discussed in Section 4.


Figure 3:The peak axial stress computed in each of the atom sections during the spall transient.All results are for the shock travel in the<1,0,0>lattice direction.
In identifying the atom slices prone to spall,a risingεz,thus,should not be the only criteria.A good measure of a material’s load carrying capability,especially one such as the ductile aluminum which is being studied in this paper,is its strain energy density.An increasing strain energy density in the present context can indicate a sustained spall deformation.Therefore,this response was computed as the area under the tensile portion of theσzvs.εzcurves for each atom section.The curves themselves were constructed by pairing the same time values of theσzandεzthat were averaged for each of the atom sections.In Figure 4,this response was plotted vs.the atom section numbers for all the 6 impact velocities considered from 0.6 km/s-1.5 km/s and for the shock travel along the<1,0,0>crystal orientation.The figure clearly showed that in most atom sections the strain energy density is very low,but it increased significantly,i.e.by about 200-400%,in the atom sections prone to the‘above threshold’spall.
The strain energy density information was also used in modifying the initially proposed spall widths.As an example,consider the case of 1.5 km/s impact velocity for the shock travel in the<1,0,0>lattice direction.For this case,Figure 4 suggested a range of S58-S70which is much smaller than the S60-S82range that was deduced from Figure 3 from the risingεzperspective.While a risingεzimplies only a rising deformation,the rising strain energy density implies additionally an increased stress carrying capability.Conversely,the loss of strain energy density implies a loss of either the peak stress,or a strain recovery.Both these two observations were also used for further narrowing the initially proposed spall widths and thus in the process for identifying the materialσzvs.εzresponse in the‘above threshold’spall.
3.3 An initial estimate for the spall duration
While Figure 3 shows the spatial variation ofalong the shock front travel direction,a plot showing the temporal variationwas also constructed.By noting that at any given timeσzcan peak anywhere,i.e.in any atom section,in the atom system and by using the atom state data that were computed at0.1 ps intervals,thevalues were extracted and are plotted in Figure 5 vs.time for the 0.6 km/s,0.7 km/s,0.8 km/s 1.01 km/s,1.2 km/s and 1.5 km/s impact velocities in the<1,0,0>lattice direction.Figure 5 shows that,for all the six impact velocities,the value for therises very sharply at the beginning of the spall transient and drops off just as abruptly.Thereaches a range of 6-6.5 GPa and stays in this range for a duration of 8-16 ps depending on the impact velocity.If viewed solely from the perspective of a risingthis range may be considered a possible spall transient duration.Later in the paper,this range will be compared to the durations computed from the voids perspective.

Figure 4:Strain energy density vs.spall prone atom sections for impact velocities 0.6 km/s,0.7 km/s,0.8 km/s,1.01 km/s,1.2 km/s and 1.5 km/s.All results are for the shock travel in the<1,0,0>lattice direction.

Figure 5:The peak axial stress found in the whole atom system during the spall transient.Times indicated on the x-axis are from the instant contact with the shock piston was removed.The shock pulse travel was in the<1,0,0>lattice direction.
In the present simulations,the stress waves continue to reflect back and forth from the free and spall surfaces.Because of this,it is difficult to identify the stress loss point solely by looking at theσzvs.εzplots alone.Figure 5 clearly indicates,however,the range into whichσzdropped post-gaining thevalues.This information was used to cut-off the materialσzandεzresponse.
4 Material response in spall
The stress/strain response is non-uniform in the spall width region.It varies from one atom section to the next in the shock direction.For each crystal orientation and impact velocity considered in the present study,the atom systems were sliced into 114 atom sections to isolate and identify the material response in the‘above threshold’spall.However,presentingσzvs.εzresponse for each one of these atom sections does not give any useful information.For this reason,the initial sets of atom section ranges were proposed,in Section 3.2,for detailed examination.These ranges were further narrowed by focusing on the void nucleation and coalescence(spall damage beginning and growth)in each atom section.In this process,the actual spall widths were identified along with the materialσzvs.εzresponse in the‘above threshold’spall,and the main reason that led to the spall damage initiation.For this purpose,the atom-section-specificσzvs.εzresponses were constructed,and were compared and contrasted along with the atom-section-specificNvvs.εz,andvfvs.εzresponses.
4.1 ‘Incipient’spall behavior
In Section 3.2,while presenting the initial spall prone atom section ranges,that were proposed with the aid of the risingεzin Figure 2,an ‘incipient spall’behavior was noted for the 0.6 km/s impact velocity and for shock travel in the<1,0,0>lattice orientation.In fact this behavior was observed in many of the atom sections in the periphery of the initially spall prone atom section ranges even at higher velocities.This behavior was characterized by the following observations:
1.in some atom sections,theσzdid not develop at all into the tensile range,
2.even in the atom sections in which the stress developed into a tensile range,theσzunloaded along an elastic slope along with anεzrecovery,and
3.voids began recovering indicating a material healing and no damage.

Figure 6:Evolutions of(-1)*pressure(-P),axial stress(σz),effective stress(σe),axial strain(εz),void volume fraction(vf)and void totals(Nv)vs.time in atom sections S51,S52and S53in spall region for the impact velocity 0.6 km/s and for the shock travel in the<1,0,0>lattice direction.The pressure,axial stress,and effective stress are plotted using the y-axis on the left side of the figure,the axial strain and the void volume fraction using the y-axis with the linear scale on the right,and the void totals using the y-axis with the log scale on the right.
To show as an example of this ‘incipient spall’behavior,the time variation plots of(-1)*P,σz,σe,εz,Nvandvfwere presented in Figure 6 for the atom sections S51-S53for the 0.6 km/s impact velocity and for the<1,0,0>crystal orientation.The(-1)*P,σzandσewere plotted using the y-scale on the left,theεzandvfwere plotted using the linear y-scale on the right,and theNvusing the log y-scale on the right in the figure.The following observations are apparent from the figure:
1.Theεzstrain reached a maximum around 0.14 but recovered completely.After reaching a maximum of∼0.035,thevfreduced to zero and the voids completely recovered.Therefore,it was concluded that there is no spall for the 0.6 km/s impact velocity in the<1,0,0>crystal direction.
2.Although the(-1)*P,σz,σe,εzandvfresponses vary between the atom sections,the variations were all small.
3.Even though theσzreached a peak of 6.4 GPa,voids do not begin to initiate at the same peak stress value.
4.In fact,the voids began nucleating only afterσereached a minimum andχreached a minimum.
5.At the time when voids started nucleating,the stress reached a peak hydrostatic state.As the P reached a minimum(in negative range),andσyalsoand because the transverse boundary conditions were periodic,the atom section averaged shear stresses,
The 3rdpoint clearly highlights the fact thatσzmerely reaching a peak value all by itself could not have initiated the void nucleation.The last two points indicate thatthe stress reaching a peak hydrostatic state and,simultaneously,the stress triaxiality factor reaching a minimum value were the main reasons for the void nucleation in spall.These points will be further illustrated in the text that follows.
4.2 Final estimates for‘above threshold’spall widths
The ‘above threshold spall’was noted only in a few atom sections for each combination of the impact velocity and the crystal orientation.This behavior was recognized by the following observations:
1.an unboundedεzevolution,
2.a fully developedσzvs.εzresponse,
3.an increased strain energy density,
4.a quick pick up in theNvevolution,and
5.a sustained void coalescence.
Even though variations of(-1)*P,σz,σe,εz,Nvandvfvariations were plotted against time in Figure 6 for illustrating the ‘incipient’spall,the material response in the ‘above threshold’spall sections will now be illustrated with the plots of(-1)*P,σz,σe,Nvandvfvs.εz.These plots are presented in Figures(7)-(11)for the 0.7 km/s,0.8 km/s 1.01 km/s,1.2 km/s and 1.5 km/s velocity impacts and for the shock pulse travel in the<1,0,0>lattice direction,respectively,in Figure 12 for the 1.5 km/s velocity impact for the shock pulse travel in the<1,1,0>lattice direction,and in Figure 13 for the 1.5 km/s impact for the shock pulse travel in the<1,1,1>lattice direction.The(-1)*P,σzandσeresponses were plotted using the y-scale on the left,thevfwas plotted using the linear y-scale on the right,and theNvusing the log y-scale on the right in the figures.

Figure 7:Variations of(-1)*pressure(-P),axial stress(σz),effective stress(σe),void volume fraction(vf)and void totals(Nv)vs.the axial strain(εz)in atom sections S67,S68and S69in spall region for the impact velocity 0.7 km/s and for the shock travel in the<1,0,0>lattice direction.The pressure,axial stress,and effective stress are plotted using the y-axis on the left side of the figure,the void volume fraction using the y-axis with the linear scale on the right,and the void totals using the y-axis with the log scale on the right.
In each figure,the responses were presented for three atom sections which were identified in the captions to the figures and,as prefixes,in the legends to the plotted curves in the figures.The atom sections were selected based on all of the five‘above threshold spall’criteria.From each of the figures,the atom sections can be identified which show a majority of the criteria.For example,Figure 11 shows that spall deformation was concentrated in atom sections S63and S64,even though voids started forming in the preceding atom sections on the left.Away,in either direction from these atom sections,only a partialσzvs.εzresponse was seen occurring in tension.Also in the atom sections selected for displaying theσzvs.εzresponses in Figures(7)-(13),theNvevolution was seen rising the fastest,and the void coalescence occurring in a sustained manner over a large range ofεz.Because of theεzrange selected for the x-axis in the figures,it was not possible to show the fact thatvf,the void volume fractions in the atom sections,rose unabated even as the void coalescence continued until there were only a few voids,in numbers,were left indicating that spall deformation ran its course and the material spalled from the atom systems.

Figure 8:Variations of(-1)*pressure(-P),axial stress(σz),effective stress(σe),void volume fraction(vf)and void totals(Nv)vs.the axial strain(εz)in atom sections S63,S64and S65in spall region for the impact velocity 0.8 km/s and for the shock travel in the<1,0,0>lattice direction.The pressure,axial stress,and effective stress are plotted using the y-axis on the left side of the figure,the void volume fraction using the y-axis with the linear scale on the right,and the void totals using the y-axis with the log scale on the right.
Based on the above ‘above threshold spall’observations,the initially proposed spall section ranges(in Section 3.2)were narrowed and the following spall widths were identified:S61-S71,S61-S68,S59-S66,S60-S66,and S61-S66,respectively,for the 0.7 km/s,0.8 km/s 1.01 km/s,1.2 km/s and 1.5 km/s velocity impacts and for the shock pulse travel in the<1,0,0>lattice direction,S62-S66for the 1.5 km/s velocity impactinthe<1,1,0>latticedirection,andS44-S50forthe1.5km/svelocityimpact in the<1,1,1>lattice direction.In Table 1 are documented these spall widths in terms of the length dimension at the equilibrium conditions,i.e.at 0 GPa and 3000K,prior to the shock/spall deformation.

Table 1:Spall widths and spall durations for the single crystal aluminum for spall in the<1,0,0>crystal direction.
It is interesting to note that,for the impacts in the<1,0,0>lattice orientation,the spall width was reducing with the increasing impact velocities:11,8,8,7,6 atom sections.Therefore,in the single crystal aluminum system with 114 atom sections,the spall transient developed only in some 6-11 atom sections.In Section 3.2,the initial spall prone atom section ranges were proposed solely based on an increasing tensileεz.With the above characteristics of theσzvs.εzresponses and theNvandvfevolutions,these ranges were further narrowed and spall widths were identified.Only by narrowing the extent of the spall region can one focus on the atom sections in which the spall failure may have started and on identifying the factors behind the initiation of such failure.This aspect will be taken up in Section 4.5.
4.3 Final estimates for the spall duration
Earlier in Section 3.3,an initial set spall durations were proposed using the temporal variation of.This set was revised using the void evolution information that was available from the time variation plots such as those in Figure 6.Clearly in this figure,the times can be noted on the x-axis at which void nucleation began in each atom section.Similarly,times can be noted at which void formation ended,i.e.by the timesNvpeaked.From time variation plots such as those shown in Figure 6,it was noted thatσzwas reaching its peak value during the time interval between the events of the very first void nucleation and the beginning of the final void coalescence.Using this information,two additional sets of spall durations were computed;1.based on how long it takes for theσzto go from a zero value to its peak value in the ‘above threshold’spall sections,and 2.based on how long it takes for all the voids to nucleate,i.e.from the beginning of the very first void nucleation to the beginning of the void coalescence.These spall durations were obtained and documented in Table 1 along with the final spall widths.Depending upon the impact velocity,the spall duration based on the first criteria ranged between 3.1 to 5.8 ps,and that based on the second criteria,between 1.9 to 5.2 ps.It is clear from the table that most of the spall duration was taken up by theσzto reach its peak value.Spall duration reduced as the impact velocity increased.
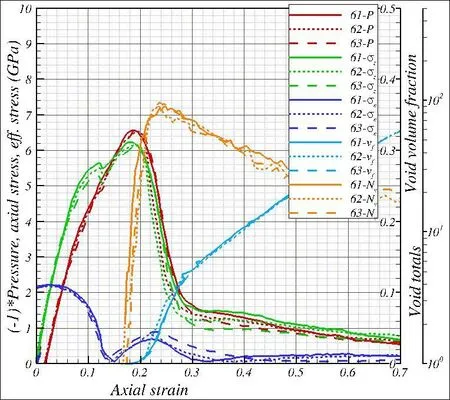
Figure 9:Variations of(-1)*pressure(-P),axial stress(σz),effective stress(σe),void volume fraction(vf)and void totals(Nv)vs.the axial strain(εz)in atom sections S61,S62and S63in spall region for the impact velocity 1.01 km/s and for the shock travel in the<1,0,0>lattice direction.The pressure,axial stress,and effective stress are plotted using the y-axis on the left side of the figure,the void volume fraction using the y-axis with the linear scale on the right,and the void totals using the y-axis with the log scale on the right.
4.4 Material σzvs.εzresponse in ‘above threshold’spall

Figure 10:Variations of(-1)*pressure(-P),axial stress(σz),effective stress(σe),void volume fraction(vf)and void totals(Nv)vs.the axial strain(εz)in atom sections S62,S63and S64in spall region for the impact velocity 1.2 km/s and for the shock travel in the<1,0,0>lattice direction.The pressure,axial stress,and effective stress are plotted using the y-axis on the left side of the figure,the void volume fraction using the y-axis with the linear scale on the right,and the void totals using the y-axis with the log scale on the right.
Figures 7-13 con firm the fact that the atom-section-specificσzvs.εzresponses vary from one atom section to the next even in the narrowed spall widths that were identified with the help of the ‘above threshold spall’criteria.But these variations are small.Similarly small are also the variations,from atom section to the next,in some important features such as:thetheεzat void nucleation,theεzat minimumσe,or thevfat the end of the void formation.For example,Figure 11 can be seen as con firming this,i.e.the bunching of the of(-1)*P,σz,σe,Nvandvfresponses in some narrow bands,for the 1.5 km/s velocity impact in the<1,0,0>crystal direction.Because of this it was proposed thatσzvs.εzresponses can be averaged over all the atom sections that were identified for the final spall widths in Section 4.3,and be used as the materialσzvs.εzresponse in the ‘above threshold’spall.In the spall experiments,such response curves are usually reduced from the free-end velocity measurements off of different thickness plates.In this study,however,they were computed from the in-situ atom level stress and displacement information because of the resolution that was possible in the MD simulations.
4.5 Role of the triaxiality parameter,χ
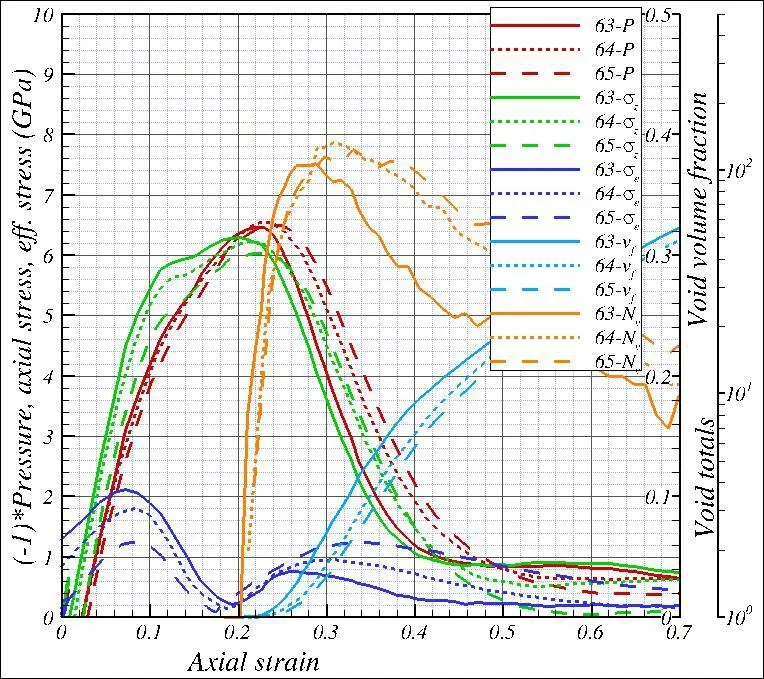
Figure 11:Variations of(-1)*pressure(-P),axial stress(σz),effective stress(σe),void volume fraction(vf)and void totals(Nv)vs.the axial strain(εz)in atom sections S63,S64and S65in spall region for the impact velocity 1.5 km/s and for the shock travel in the<1,0,0>lattice direction.The pressure,axial stress,and effective stress are plotted using the y-axis on the left side of the figure,the void volume fraction using the y-axis with the linear scale on the right,and the void totals using the y-axis with the log scale on the right.
Effect of stress triaxiality condition on void growth in dynamic fracture of metals was investigated under strain rate loading using MD simulations by[Seppala,Belak and Rudd(2004b)].Earlier,and in reference to the time variation response plots under the 0.6 km/s impact in the<1,0,0>lattice direction(see section 4.1 and Figure 6),it was pointed out thatthe stress reaching a peak hydrostatic state and,simultaneously,the stress triaxiality factor reaching a minimum value were the main reasons for the void nucleation in spall.The same observation was also con firmed from the materialσzvs.εzresponse plots in Figures 7-13 at the higher velocity impacts.
In the figures,a common feature that can be observed is that theσewasat theεzvalues that were smaller than theεzvalues at which the void nucleation began in all the atom sections.These strains can be found at the intersections of theεzresponse(on the x-axis)and theNvresponse(shown as the orange dashed curves).Also con firmed,but not shown in the figures with separateχcurves,was the fact that at the sameεzvalues at which thetheχwas alsoThe figures consistently showed aσedropping into a range of0-3%ofσz,i.e.σebecoming very small in relation toσz,σe<<σz.Thus asthenandThis was whenχreached a negative minimum,a condition that was traditionally observed in the plate-to-plate spall experiments in high velocity impacts.Thus the present atomistic simulations con firmed that the void nucleation in spall was precipitated by the stress state reaching a peak hydrostatic state,the shock stress reaching the tensile maximum pressure,and χ,the stress triaxiality factor,dropping to a minimum.

Figure 12:Variations of(-1)*pressure(-P),axial stress(σz),effective stress(σe),void volume fraction(vf)and void totals(Nv)vs.the axial strain(εz)in atom sections S62,S63,S64,S65in spall region for the impact velocity 1.5 km/s and for the shock travel in the<1,1,0>lattice direction.The pressure,axial stress,and effective stress are plotted using the y-axis on the left side of the figure,the void volume fraction using the y-axis with the linear scale on the right,and the void totals using the y-axis with the log scale on the right.
Even though σeis associated with the material strength,for spall it is best to use these two conditions:At these conditions,the stress reaches a near hydrostatic state with approximately the same positive peak normal stress values in all the three coordinate directions simultaneously.At this stress state,the material was being pulled apart in all the three directions with a similar level of force.In the single crystal atom system that was considered in the present study,there were no grain boundaries to initiate a void nucleation by grain boundary sliding.Similarly the fcc lattice considered herein for the single crystal Al atom system had symmetry w.r.t.to all the three coordinate directions.When such a crystal system was under a hydrostatic stress state,no one single normal stress component was dominant with respect to any one lattice direction,to cause void nucleation by dislocations’driven mechanisms Moreover,the shear stresses were(approximately)zero.Because of this,void nucleations were caused only by atom de-bonding in the present spall simulations.
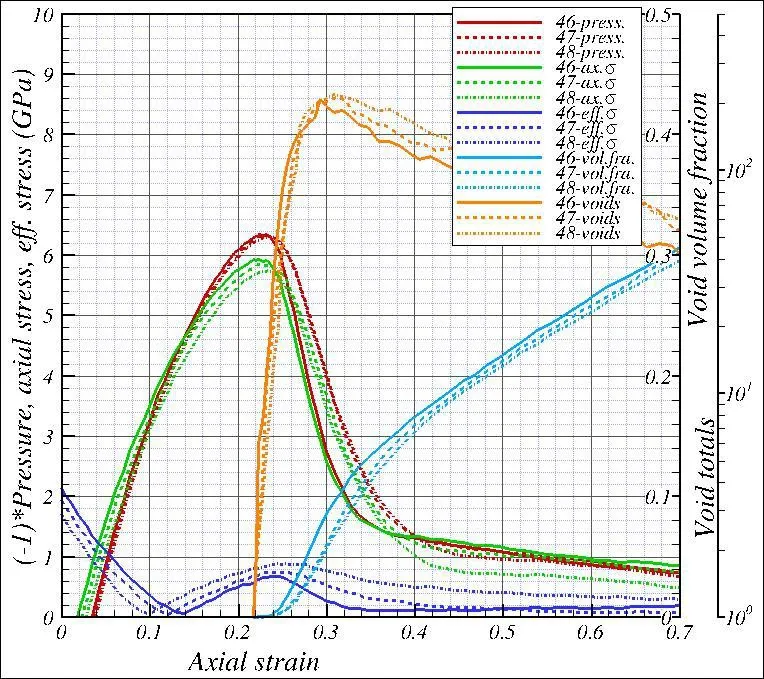
Figure 13:Variations of(-1)*pressure(-P),axial stress(σz),effective stress(σe),void volume fraction(vf)and void totals(Nv)vs.the axial strain(εz)in atom sections S46,S47,S48in spall region for the impact velocity 1.5 km/s and for the shock travel in the<1,1,1>lattice direction.The pressure,axial stress,and effective stress are plotted using the y-axis on the left side of the figure,the void volume fraction using the y-axis with the linear scale on the right,and the void totals using the y-axis with the log scale on the right.
Under the peak hydrostatic stress state and the minimum stress triaxiality condition,the computed range of the void nucleation strains and,perhaps to a lesser extent,the observed stress level,in the atom sections with the ‘above threshold’spall should roughly be equal even when the crystal lattice was oriented differently from the shock direction.This was con firmed in the present atomistic simulations for all the three crystal orientations at the 1.5 km/s impact,see Figures(11)-(13),and again for all the five impact velocities for the<1,0,0>crystal orientation,see

Figure 14:Effect of impact velocity on the axial strain at the onset of void nucleation,on the axial strain at the onset of void coalescence,the axial strain at at the minimum value of the triaxiality parameter(χ),and on the void volume fraction computed at the onset of void coalescence.All responses were avergaed over atom sections in the spall region.All results are for the shock travel in the<1,0,0>lattice direction.
Figures(7)-(11).Therefore it was concluded thatthe conditions for void nucleation in spall namely stress state reaching a peak hydrostatic state,the shock stress reaching the tensile maximum pressure,and χ,the stress triaxiality factor,dropping to a minimum all remain valid at different velocities and crystal orientations for the single crystal aluminum.
4.6 Effect of impact velocity on the void nucleation and coalescence strains,strain rate generated in spall,and material spall strength
To show the effect of the impact velocity on the axial strains at the onset of void nucleation,on the axial strains at the onset of void coalescence,on the axial strains at at the minimum value of the triaxiality parameter(χ),and on the void volume fractions at the onset of void coalescence,these responses were averaged over the atom sections in the ‘above threshold’spall widths and were shown in Figure(14)against the impact velocity for the shock travel in the<1,0,0>lattice direction.From this figure,it can be clearly seen that for all the impact velocities from 0.7 km/s through 1.5 km/s that were considered in this study,the axial strain curve atχminpreceded the void nucleation strain curve.This figure thus clearly showed that theχreaches a negative minimum before the void nucleation,or spall damage,in the single crystal aluminum.
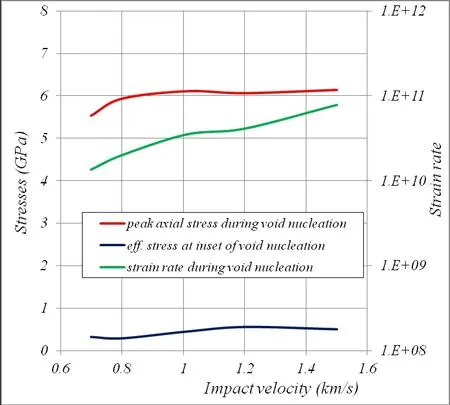
Figure 15:Effect of impact velocity on the peak axial stress recodrded during the void nucleation,on the efective stress recorded at the onset of void nucleation,and on the strain rate during void nucleation.All responses were avergaed over atom sections in the spall region.All results are for the shock travel in the<1,0,0>lattice direction.
Next were extracted the peak axial stress,,in all the atom sections during the void nucleation phase,and their averages values were shown against the impact velocity in Figure(15).Similarly,the strain rates experienced by the atom sections in the ‘above threshold’spall widths were also extracted and were avergaed and plotted in the same figure.The shock travel in the lattice<1,0,0>direction was once again considered for these results.For the range of the impact velocities from 0.7 km/s through 1.5 km/s,the figure shows that while the average strain rate increased nearly by a factor of 10 from 1x10¹⁰to 1x10¹¹,the average of thein the ‘above threshold’spall prone atom sections stayed nearly a constant.An approximately the same averagewas also noted for the 1.5 km/s impact in the<1,1,0>and<1,1,1>lattice directions.This then suggested thatin the atom sections with the ‘above threshold’spall stays invariant w.r.t.the impact velocity or the lattice orientation.This invariance of theindicates that the estimated value of 6 GPa may be considered a material spall strength for the single crystal aluminum at the atomistic scale.
5 Conclusions
Over the past five decades or so,the spall phenomenon in metallic systems has been fully understood at macroscopic level through the plate impact experiments and from the metallurgical studies on the recovered target plates.Through empirical relationships for damage evolution[Gurson(1977);Needleman(1972);Tvergaard(1990);Tvergaard and Needleman(1984)],the fundamental mechanisms of spall such as voids’nucleation,growth,coalescence were modeled at macro level.For understanding spall damage at a fundamental level,modeling efforts started only in the last two decades.In the present paper,the void nucleation process in spall was investigated through large scale MD simulations a single crystal aluminum.
Brief shock pulses were driven into the single crystal aluminum system in three of its lattice directions,<1,0,0>,<1,1,0>,and<1,1,1>,at velocities ranging from 0.6 km/s to 1.5 km/s.Once the moving shock fronts encountered the stress free ends of the atom system,tensile pressure waves ensured which upon interaction produced spall transients.The work in this paper then focused on characterizing the ‘above threshold’spall region,specifically the spall width,the spall duration,theσzvs.εzresponse in spall,and the conditions for the initiation and growth of the spall damage via the void nucleation and void coalescence.Special attention was focused on uncovering the reasons for the void nucleation.
First snapshots,or time histories,of the mechanical responses’distributions in the shock travel direction were obtained using an atom section averaging process.In spite of the fast evolving spall transients,using a mainly strain energy density based sustained spall deformation criteria,atom sections showing the ‘above threshold’spall were identified.
With the aid ofvs.atom section plots,σzvs.time plots andσzvs.εzplots,it was shown thatσzmerely reaching a peak value all by itself could not have initiated the void nucleation.Instead,by overlaying theNvvs.εz,vfvs.εz,and theσevs.εzon theσzvs.εzplots for the ‘above threshold’spall prone atom sections,the following conditions for void nucleation in spall were identified namely:1.stress state reaching a peak hydrostatic state,2.the shock stress reaching the tensile maximum pressure,and 3.χ,the stress triaxiality factor,dropping to a minimum.Because there were no grain boundaries to initiate a void nucleation by grain boundary sliding,and because,there were no shear stresses to cause voids by dislocation driven mechanisms,the observed voids were concluded to have been nucleated only by atom de-bonding.
By plotting axial strains at the onset of void nucleation and the axial strains atχminagainst the impact velocities,the axial strain curve atχminwas shown to precede the axial strain curve at the void nucleation,clearly showing that theχreaches a negative minimum before the void nucleation,or spall damage,in the single crystal aluminum
Next the peak axial stress and the average strain rate were extracted and were plotted against the impact velocity showing that inspite of the fact that the average strain rate increased nearly by a factor of 10 from 1x10¹⁰to 1x10¹¹,the average of theremained at∼6 GPa during the void nucleation.This value stayed at the approximately ths same value even when the crystal orientation was changed from<1,0,0>to<1,1,0>to<1,1,1>.Because of this observation,the estimated value of 6 GPa is proposed as a material spall strength for the single crystal aluminum at the atomistic scale.
Continuum mechanics based spall theories are based on the spall data obtained from the free-end velocity measurements from the plate-to-plate impact experiments.The present MD simulations revealed a similar and approximately closeσzvs.εzresponses in the ‘above threshold’spall prone atom sections,a nearly constant material spall strength,and that fulfilling the peak hydrostatic state and minimum stress triaxiality conditions initiated the voids in spall.These observations were,however,solely reached from the mechanical,i.e.σzvs.εz,response perspective.A better understanding of the void nucleation and coalescence can be gained from a detailed scientific visual study of the atom displacement maps.Such a study is proposed for future work to uncover any additional micromechanisms that may underline the spall damage in single crystal aluminim.
Atluri,S.N.;Shen,S.(2002):The meshless local Petrov-Galerkin(MLPG)method:A simple and less-costly alternative to the finite element and boundary element methods.Computer Modeling in Engineering&Sciences,vol.3,no.1,pp.11-51.
Bodner,S.R.;Rajendran,A.M.(1995):On the strain rate and temperature dependence of hardening of copper.AIP Conf.Proc.,vol.370,pp.499-502.
Bringa,E.M.;Caro,A.;Wang,Y.;Victoria,M.;McNaney,J.M.;Remington,B.A.;Smith,R.F.;Torralva,B.R.;Van Swygenhoven,H.(2005):Ultrahigh strength in nanocrystalline materials under shock loading.Science,vol.309,pp.1838-1841.
Curran,D.R.;Seaman,L.;Shockey,D.A.(1987):Dynamic failure of solids.Phys.Rep.,vol.147,pp.253-388.
Dong,L.;Atluri,S.N.(2012):Development of 3D T-Trefftz Voronoi Cell Finite Elements with/without Spherical Voids&/or Elastic/Rigid Inclusions for Micromechanical Modeling of Heterogeneous Materials.Comp.Mat.Continua,vol.29,no.2,pp.169.
Dongare,A.M.;Rajendran,A.M.;LaMattina,B.;Zikry,M.A.;Brenner,D.W.(2008):Atomic scale simulations of orientation of loading axis on the growth of voids at the onset of ductile failure in single crystal Cu.Mat.Res.Soc.Sym.Proc.,vol.1137,pp.EE08-09-W10-09.R1.
Dongare,A.M.;Rajendran,A.M.;LaMattina,B.;Zikry,M.A.;Brenner,D.W.(2009a):Atomistic studies of void-growth based spall failure in single crystal copper at high strain rates,Shock Compression of Condensed Matter-2009.AIP Conference Proceedings.vol.1195,pp.769 772
Dongare,A.M.;Rajendran,A.M.;LaMattina,B.;Zikry,M.A.;Brenner,D.W.(2009b):Atomic scale simulations of ductile failure micromechanisms in nanocrystalline Cu at high strain rates.Phys.Rev.B,vol.80,pp.104108.
Dongare,A.M.;Rajendran,A.M.;LaMattina,B.;Zikry,M.A.;Brenner,D.W.(2010a):Atomic scale studies of spall behavior in nanocrystalline Cu.J.Appl.Phys.,vol.108,pp.113518.
Dongare,A.M.;Rajendran,A.M.;LaMattina,B.;Zikry,M.A.;Brenner,D.W.(2010b):Atomic scale study of plastic-yield criterion in nanocrystalline metals using molecular dynamics simulations.Metall.Mater.Trans.A,vol.41A,pp.523-531.
Dongare,A.M.;Rajendran,A.M.;LaMattina,B.;Zikry,M.A.;Brenner,D.W.(2011):Dynamic Failure behavior of Nanocrystaline Cu at atomic scales.CMC,vol.24,no.1,pp.43-60.
Eliezer,S.;Gilath,I.;Bar-Noy,T.(1990):Laser-induced spall in metals:Experiment and simulation.J.Appl.Phys.,vol.67,pp.715.
Fowler,J.P.;Worswick,M.J.;Pilkey,A.K.;Nahme H.(2000):Damage leading to ductile fracture under high strain-rate conditions.Metall.Mater.Trans.A,vol.31,pp.831-844.
Gurson,A.L.(1977):Continuum theory of ductile rupture by void nucleation and growth:Part 1–Yield Criteria and Flow rules for porous ductile.J.Eng.Mater.Technol.,vol.99,pp.2-15.
Kanel,G.I.;Razorenov,S.V.;Utkin,A.V.;Fortov,V.E.;Baumung,K.;Karow,H.U.;Rusch,D.;Licht,V.(1993):Spall strength of molybdenum sin-Effect of the Strain Rate and Microstructure on Damage Growth 253 gle crystals.J.Appl.Phys.,vol.74,pp.7162.
Kanel,G.I.;Seaman,L,;Antoun,T.(2003):Spall Fracture,Springer-Verlag.
Knott,J.F.(1973):Fundamentals of Fracture Mechanics,Butterworths,London.
Kelchner,C.L.;Plimpton,S.J.;Hamilton,J.C.(1998):Dislocation nucleation and defect structure during surface indentation.Phys Rev B,vol.58,pp.11085.
Minich,R.W.;Cazamias,J.U.;Kumar,M.;and Schwartz,A.J.J.(2004):Effect of microstructural length scales on spall behavior of copper.Metall.Mater.Trans.A,vol.35,pp.2663-2673.
Meyers,M.A.(1994):Dynamic Behavior of Materials.Wiley-Interscience,New York.
Mishin,Y.;Farkas,D.;Mehl,M.J.;Papaconstantantopoulos,D.A.(1999):Interatomic potentials for monoatomic metals from experimental data and ab initio calculations.Phys.Rev.B,vol.59,pp.3393.
Moshe,E.;Eliezer,S.;Dekel,E.;Ludmirsky,A.;Henis,Z.;Werdiger,M.;Goldberg,I.B.;Eliaz,N.;Eliezer,D.(1998):An increase of the spall strength in aluminum,copper,and Metglas at strain rates larger than 107 s-1.J.Appl.Phys.,vol.83,pp.4004.
Moshe,E.;Eliezer,S.;Dekel,E.;Henis,Z.;Ludmirsky,A.;Goldberg,I.B.;Eliezer,D.(1999):Measurements of laser driven spallation in tin and zinc using an optical recording velocity interferometer system.J.Appl.Phys.,vol.86,pp.4242.
Needleman,A.(1972):Void growth in an elastic plastic medium.J.Appl.Mech.,vol.39,pp.964-970.
Plimpton,S.(2011):LAMMPS code 2011 version.http://lammps.sandia.gov/.
Rajendran,A.M.;Fyfe,I.M.(1982):Inertia Effects on the Ductile Failure of Thin Rings.Appl.Mech,Trans.ASMR,vol.49,pp.31-36.
Rajendran,A.M.;Dietenberger,M.A.;Grove,D.J.(1989):Results from the Recently Developed Dynamic Failure Model.Shock Compression of Condensed Matter-1989.S.C.Schmidt,J.N.Johnson,and L.W.Davison(Editors),Elsevier Science Publishers,pp.373-376.
Rivas,J.M.;Zurek,A.K.;Thissell,W.R.;Tonks,D.L.;Hixson,R.S.(2000):Quantitative description of damage evolution in ductile fracture of tantalum.Metall.Mater.Trans.A,vol.31,pp.845-851.
Seppala,E.T.;Belak,J.;and Rudd,R.E.(2004a):Effect of stress triaxiality on void growth in dynamic fracture of metals:A molecular dynamics study.Phys.Rev.Lett.,vol.69,pp.134101.
Seppala,E.T.;Belak J.;Rudd,R.E.(2004b):Onset of void coalescence during dynamic fracture of ductile metals.Phys.Rev.Lett.,vol.93,pp.245503.
Seppala,E.T.;Belak,J.;Rudd,R.E.(2005):Three-dimensional molecular dynamics simulations of void coalescence during dynamic fracture of ductile metals.Phys.Rev.B,vol.71,pp.064112.
Shen,S.;Atluri,S.N.(2004a):Computational nano-mechanics and multi-scale simulation.Computers,Materials,&Continua,vol.1,no.1,pp.59-90.
Shen,S.;Atluri,S.N.(2004b):Atomic-level Stress Calculation and Continuum-Molecular System Equivalence.CMES:Computer Modeling in Engineering&Sciences,vol.6,no.1,pp.91-104.
Srinivasan,S.G.;Baskes,M.I.;Wagner,G.J.(2007):Atomistic simulations of shock induced microstructural evolution and spallation in single crystal nickel.J.App.Phys.,vol.101,pp.101-107.
Srinivasan,S.G.;Baskes,M.I.(2007):Atomistic simulations of the plasticity behavior of shock-induced polycrystalline nickel,metallurgical and materials transactions a,vol.38a.
Tamura,H.;Kohama,T.;Kondo,K.;Yoshida,M.(2001):Femto-second laser induced spallation in aluminum.J.Appl.Phys.,vol.89,pp.3520-3522.
Tewary,V.K.;Read,D.T.(2004):Integrated Green’s function molecular dynamics method for multiscale modeling of nanostructures:application to Au nanoisland in Cu.Computer Modeling in Engineering&Sciences,vol.6,no.4,pp.359-371.
Thomason,P.F.(1999):Ductile spallation fracture and the mechanics of void growth and coalescence under shock-loading conditions.Acta Mater.,vol.47,pp.3633-3646.
Traiviratana,S.;Bringa,E.M.;Bensona,D.J.;Meyers,M.A.(2008):Void growth in metals:Atomistic calculations.Acta Mater.,vol.56,pp.3874-3886.
Tvergaard,V.;Needleman,A.(1984):Analysis of the cup-cone fracture in a round tensile bar.Acta Metall.,vol.32,pp.157-169.
Tvergaard,V.(1990):Material failure by void growth to coalescence.Adv.Appl.Mech.,vol.27,pp.83-151.
Tsuru,T.;Shibutani,Y.(2004):Atomistic simulations of elastic deformation and dislocation nucleation in Al under indentation-induced stress distribution.Modeling Simul.Mater.Sci.Eng.,vol.14,pp.S55–S62.
Vo,N.Q.;Averback,R.S.;Bellon,P.;Odunuga,S.;Caro,A.(2008):Quantitative description of plastic deformation in nanocrystalline Cu:Dislocation glide versus grain boundary sliding.Phys.Rev.B,vol.77,pp.134108.
Voter,A.F.(1994):The Embedded Atom Method.In:Intermetallic Compounds:Principles and Practice.Edited by J.H.Westbrook and R.L.Fleischer,Wiley,New York,pp.77.
Wright,T.W.;Ramesh,K.T.(2008):Dynamic void nucleation and growth in solids:A self consistent statistical theory.J.Mech.Phys.Solids,vol.56,pp.336-359.
Xiong,L.;Chen,Y.(2008):Effects of dopants on the mechanical properties of nanocrystalline silicon carbide thin film.Comp.Model.Engg.Sci.,vol.24,no.2/3,pp.203.
Zhigilei,L.V.;Ivanov,D.S.;Leveugle,E.;Sadigh,B.;Bringa,E.M.(2004):Computer modeling of laser melting and spallation of metal targets.Proc.SPIE,vol.5448,pp.505.
