Aggregation of Diesel Contaminated Soil for Bioremediation
2014-03-07YuYingShiXiuhongLiSongandXuJinggang
Yu Ying, Shi Xiu-hong, Li Song, and Xu Jing-gang,
1College of Resources and Environment, Northeast Agricultural University, Harbin 150030, China
2Alberta Environmental Centre, Vegreville, Alberta, Canada, T6L 2C6
Aggregation of Diesel Contaminated Soil for Bioremediation
Yu Ying1, Shi Xiu-hong1, Li Song1, and Xu Jing-gang1,2
1College of Resources and Environment, Northeast Agricultural University, Harbin 150030, China
2Alberta Environmental Centre, Vegreville, Alberta, Canada, T6L 2C6
Diesel contaminated soil (DCS) contained a large amount of the hydrocarbons and salt which was dominated by soluble sodium chloride. Aggregation process which made the desired aggregate size distribution could speed up the degradation rate of the hydrocarbons since the aggregated DCS had better physical characteristics than the non-aggregated material. Artificial aggregation increased pores >30 µm by approximately 5% and reduced pores <1 µm by 5%, but did not change the percentage of the pores between 1 and 30 µm. The saturated hydraulic conductivity of non-aggregated DCS was 5×10⁻⁶m • s-l, but it increased to 1×10⁻⁵m • s-lafter aggregation. The compression index of the non-aggregated DCS was 0.0186; however, the artificial aggregates with and without lime were 0.031 and 0.028, respectively. DCS could be piled 0.2 m deep without artificial aggregation; however, it could be applied 0.28 m deep when artificial aggregates were formed without limiting O2transport.
diesel contaminated soil, aggregation, non-aggregation, salt leaching, aeration
Introduction
A considerable amount of the oily contaminated soil can be generated from the petroleum industry during its crude oil exploration, production, transportation, storage, and refining processes (Xu et al., 2009; Mrayyan and Battikhi, 2005). In particular, the soil sludge generated during the petroleum refining process has received increasing attention in recent years. It contained a high concentration of the petroleum hydrocarbons (PHCs) and other recalcitrant components. As being recognized as a hazardous waste in many countries, the improper disposal or the insufficient treatment of the oil contaminated soil can pose serious threats to the environment and human health (Xu et al., 2009; Mrayyan and Battikhi., 2005; Liu et al., 2009; Mater et al., 2006; Rocha et al., 2010).
Bioremediation of petroleum and salt-contaminated soil, as found often in oil-fields due to pipeline leakage and inappropriate operations, is challenged by the coexistence of the salt and petroleum in the contaminated soil (Nicholson and Fathepure, 2004). On one hand, salt at high concentration inhibits microbial growth and subsequent petroleum degradation (Rhykerd et al., 1995). On the other hand, the petroleum makes the soil granules hydrophobic and thus hinders the salt leaching via water infiltration (Andrade et al., 2004). Bioremediation of the contaminated soil is performed via the addition of microorganisms so as to enhance a specific biological activity; however, the properties of the treated materials and environmental factors are also validated important in removing organic pollutants from soil (Vogel, 1996; Ellis et al., 2000; Salanitro et al., 2000; Lendvay et al., 2003; Fantroussi and Agathos, 2005).
To decrease the bulk density and improve the aeration and leaching characteristics, an aggregation experiment was conducted to broke up large clods of diesel contaminated soil (DCS) and recombine the individual mineral particles into aggregates, which was considered to provide better environment for the hydrocarbon biodegradation. The aggregate characteristics and some parameters influencing microbial activity in soil were also tested in the experiment.
Materials and Methods
A food mixer (Kitchen Aid, model K5SS) was used to produce artificial aggregates. Both DCS and amendments were added to the mixing bowl at the same time. Approximately 1 to 1.5 kg of the material was used for each mixing. The speed of the mixer was 2-4 cycles per second. Each mixing lasted for 5 min. The soil amendments including water were added while mixer was operating.
Wet aggregate stability was measured using the fraction of the aggregates between 1.4 and 2.4 mm. Five to seven grams of the aggregates were placed into a 1.2 mm sieve and shaken to sieve out any loose particles. The aggregates were wetted slowly using 30 kPa of vacuum for 2 to 3 h depending on the wettability of the aggregates. The sieve with pre-wetted aggregates was then placed into the wet sieving apparatus which provided a sieving frequency of 35 cycles per min. The sieving time was 3, 10, 20, 30, and 40 min. The aggregates remained in the sieve were soaked into a container containing 110 mL of 0.2% sodium hexametaphosphate (NaHMP, dispersing solution).
The stable aggregate fraction (STi) was calculated by

Where, WsNa=soil in NaHMP solution, WsH2O=soil in the water. When i=1, t=3 min, and i=5, t=40 min. The detailed procedure is given by Kemper and Chepil (1965).
The water release curve was measured up to 300 kPa, using pressure plates with a continually weighing method. The pore sizes of DCS were calculated by

Where, r=pore radius (m); σ=surface tension of water (72 N • m-1); ρ=density of water (Mg • m-3), g= gravitational acceleration (9.8 m • s-2); and h=hydraulic head (m).
Compressibility of DCS was tested in a one-dimensional consolidation test (McNabb et al., 1994). The DCS was gently packed into plastic columns with a diameter of 74 mm and a height of 35 mm by tapping the column on a flat surface. The column of DCS was saturated for 24 h. The consolidation curve was measured using a consolidation machine.
A 14 cm PVC column (7.4 cm diameter) was used for the leaching test. Two centimetres of the sand were packed at the bottom of the column. The sand layer prevented water flow from disturbing the aggregates. The ends of the column were sealed with rubber plungers. The rubber plungers were connected to a Mariott bottle, which controls hydraulic head, with a Tygon tubing of 0.75 cm in diameter.
DCS was packed into a column at a bulk density of 1 (±0.2) Mg • m-3, simulating natural consolidation. DCS was then divided into three portions. Each portion was successively poured into the column and gently pressed with a rubber plunger to occupy one third of the column length. This procedure produced uniform packing and avoided channels which could cause preferential water movement in the column. After packing each layer, the top 0.5 cm of the material was loosened before another layer was added. This ensured continuity within the column.
The column was then saturated by applying water with 10 cm of the hydraulic head from the bottom. This allowed air to escape from the top. It took approximately 2 to 3 h to saturate a 10 cm column. After reaching saturation, the effluent was collected and measured every 10 min. The electrical conductivity was measured on each leachate fraction. Leachingwas terminated when EC of the leachate was less than 8 dS • m-1. The experiment lasted for 4 to 5 h. Water flow rate was used to determine the hydraulic conductivity. EC measurements were used to determine the amount of the water required to leach the salts from DCS.
Hydraulic conductivity was calculated by

Where, Q=water flow rate (m3• s-1), L=length of column (m), A=cross sectional area of the column (m2), and H=hydraulic head (m).
Results and Discussion
Physical characteristics of DCS aggregates
Desired aggregate size distribution was formed at 0.23-0.25 kg • kg-lof the water content (Table 1). Water content was an important factor in aggregation. If water content was too high, large lumps were formed. If water content was too low, the aggregation process produced very fine aggregates. A rather narrow range of the water content was optimal for artificial aggregation. More than 90% of the aggregates were in the size between 0.85 to 4.75 mm (Fig. 1). After excess salts were leached, the aggregate size distribution did not change significantly. Over 80% of the aggregates were stable after leaching (Fig. 2).
Artificial aggregation of the oil contaminated soil showed to enhance microbial activity (Xu and Juma, 1995) by increasing aeration and salt leaching. The potential need for the artificial aggregation of DCS would be removing the soluble salts quicker and providing aeration more for hydrocarbon biodegradation. O2/CO2, profiles, especially in relation to compression would provide valuable information to determine the optimal depth of DCS for bioremediation.

Table 1 Aggregate size distribution of DCS before and after artificial aggregation (%)
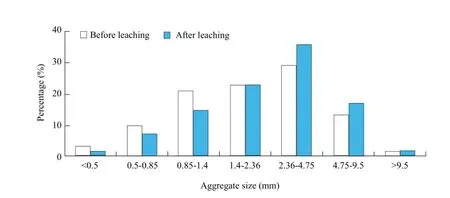
Fig. 1 Aggregate size distributions before and after leaching
Pore size distribution
Pore size distributions of the aggregated and nonaggregated DCS are presented in Fig. 3, which was calculated from the water release curve (Fig. 4). The artificial aggregation increased pores >30 µm by approximately 5% but reduced pores <1µm by 5%; however, did not change the percentage of pores between 1 and 30 µm. Approximately 60% of the pore was greater than 30 µm, 30% of the pore space wassmaller than 1 µm and less than 10% of the pore space was between 1 and 30 µm, which was considered suitable for microbial growth in DCS. A 30 µm diameter pore was equivalent to 10 kPa matrix suction (or water potential), which was normally considered as field capacity. A 1µm pore was equivalent to 300 kPa matrix suction, which was considered to be smaller than a bacterium cell.
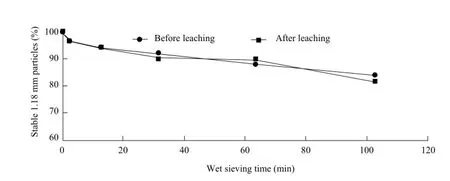
Fig. 2 Aggregate stability before and after leaching
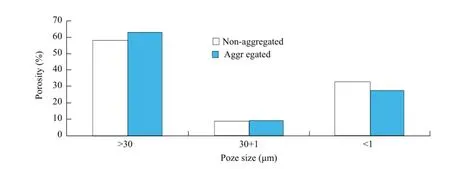
Fig. 3 Pore size distribution of aggregated and non-aggregated DCS
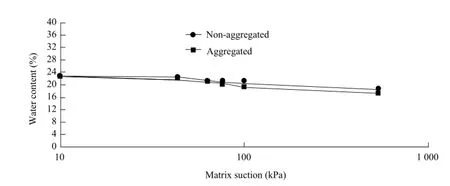
Fig. 4 Water release curve of aggregated and non-aggregated DCS
Removal of soluble salts
Electrical conductivity (EC) decreased with an increase in volume of the water used to leach the material (Fig. 5). EC was reduced to 5 dS • m-1, when 1.2 pore volumes of the water were added both artificially aggregated and non-aggregated DCS. Approximately 0.9 L of the water was required to leach the salt from 1 kg of the aggregated DCS, but about 0.75 L was used for the non-aggregatedDCS, since the porosity of the aggregated and nonaggregated DCS was different.
The saturated hydraulic conductivity of the nonaggregated DCS was 5×10⁻⁶m • s-l. After aggregation, the saturated hydraulic conductivity increased to 1×10⁻⁵m • s-l. Thus, aggregation reduced the time required to leach excess salts by about half (Table 2). The calculations in Table 1 were based on the assumption that the materials were saturated and the hydraulic gradient was equal to 1. If the water was applied to the surface and drained under gravity from the bottom, these assumptions would be valid.
Compressibility
Compressibility of DCS could be described by the compression index, which was defined as the change of the bulk density with increasing static load. A higher compression index indicated less aggregate stability. The compression index of the non-aggregated DCS was 0.0186 (Fig. 6).
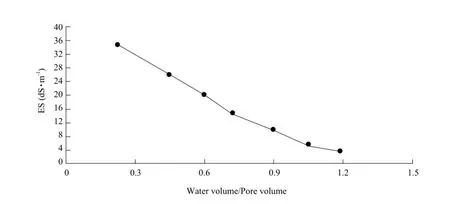
Fig. 5 Electrical conductivity of DCS as a function of water ratio volume to pore volume

Table 2 Time needed for salt removal from aggregated and non-aggregated DCS with different depths
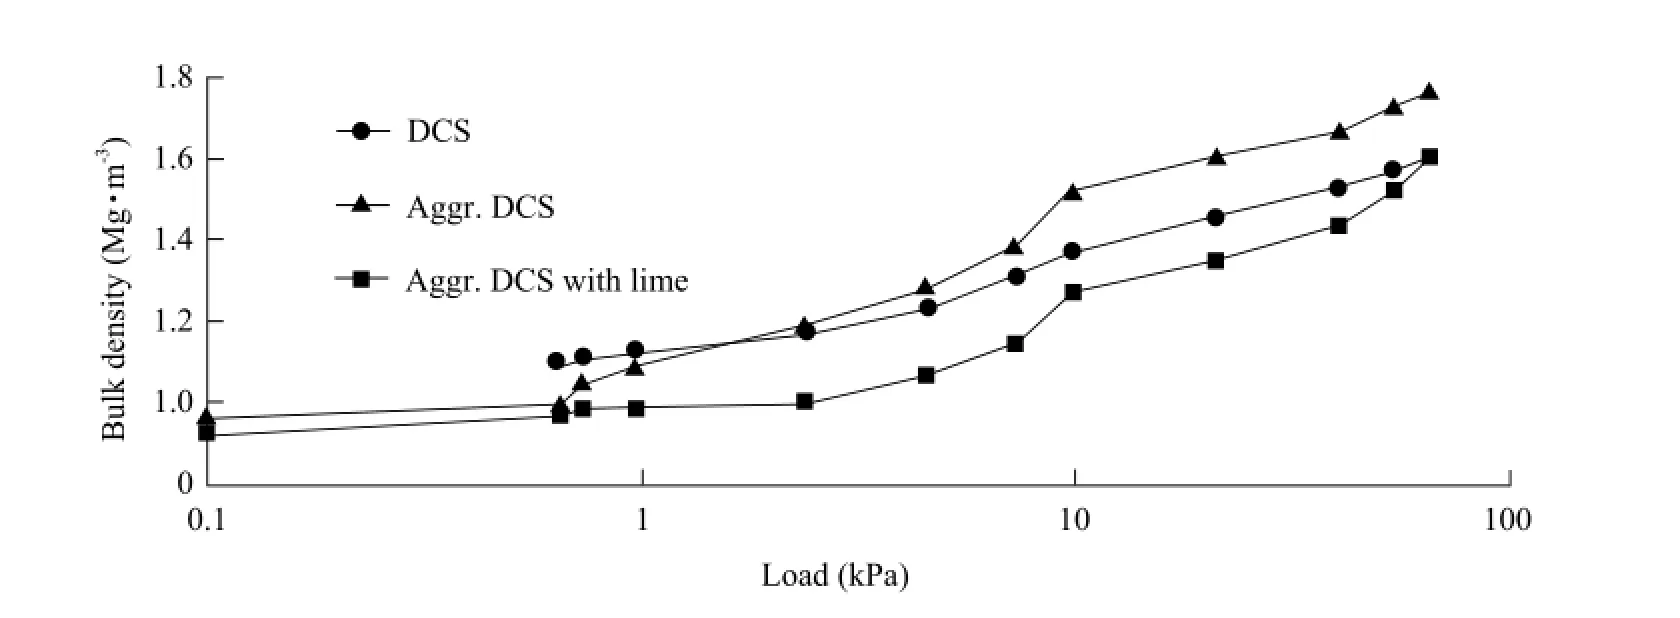
Fig. 6 Consolidation of non-aggregated, artificially aggregated DCS, and DCS artificially aggregated and amended with 1% lime
The artificial aggregates with and without lime were 0.031 and 0.028, respectively, which indicated that both aggregation and liming increased the compression index. However, the aggregation did not improve aggregate strength because the aggregated DCS was more compactable than the non-aggregated DCS.
Aeration
A simple oxygen transport model (Li and Aasen, 1994), simulating O2transport while maintaining 0.2 m3• m-3water content, showed that DCS could be piled 0.2 m deep without any artificial aggregation but 0.28 m deep with artificial aggregation, without limiting O2transport (assuming a 360 g • m-3• d-1of O2consumption rate). The slightly lower initial bulk density of artificially aggregated DCS allowed it to be piled slightly deeper than the non-aggregated DCS.
The measured bulk density of DCS in the field was about 1 Mg • m-3, which yielded a total porosity of 62%. By calculation, when water content was 0.20 kg • kg-1, the air-filled porosity of both aggregated and non-aggregated DCS would exceed 40%, which was well above the acceptable level of 30% for a good agricultural soil.
Conclusions
Aggregated DCS had different physical characteristics from the non-aggregated material. The hydraulic conductivity of artificial aggregates of DCS was more than two times higher than DCS without aggregation, which influenced the efficiency of the salt removing.
Approximately 17% less water and only half the time were needed to reduce ECsatfrom 34 dS • m-1to<5 dS • m-1for the artificially aggregated DCS compared to the non-aggregated DCS. However, the aggregated DCS had a lower compression index than the nonaggregated material signifying that the individual aggregates were not as strong as the clods in the nonaggregated material and therefore less able to bear weight without losing pore space. Yet aggregation by itself did not significantly change the distribution of porosity.
According to calculations from the gas exchange model, O2entry rate into DCS, its internal transfer rate and CO2egress rate were not prohibitive in DCS when it was piled to a 20 cm depth (at water contents <0.25 kg • kg-1). The excellent aeration properties of DCS were also confirmed by O2measurements in the experiment, which ranged from 14% to 20% with 20 cm deep of the materials. Measurements of O2in the deeper pile (40 cm) showed oxygen contents less than 10%, which were inhibitory to microorganisms and biological degradation of hydrocarbons.
Andrade M L, Covelo E F, Vega F A, et al. 2004. Effect of the prestige oil spill on salt marsh soils on the coast of Galicia (northwestern Spain). Journal of Environmental Quality, 33: 2103-2110.
Ellis D E, Lutz E J, Odom J M, et al. 2000. Bioaugmentation for accelerated in situ anaerobic bioremediation. Environmental Science and Technology, 34: 2254-2260.
Fantroussi, S E I, Agathos S N. 2005. Is bioaugmentation a feasible strategy for pollutant removal and site remediation. Current Opinion in Microbiology, 8: 268-275.
Lendvay J M, Loffler F E, Dollhopf M, et al. 2003. Bioreactive barriers: a comparison of bioaugmentation and biostimulation for chlorinated solvent remediation. Environmental Science and Technology, 37: 1422-1431.
Li X, Aasen A. 1994. A simple model to determine maximum depth in a bioremediation facility. Submitted to Proceeding of 31st Annual Alberta Soil Science Workshop. pp. 225-230.
Liu J, Jiang X, Zhou L, et al. 2009. Pyrolysis treatment of oil sludge and model-free kinetics analysis. Journal of Hazardous Materials, 161: 1208-1215.
Mater L, Sperb R M, Madureira L A S, et al. 2006. Proposal of a sequential treatment methodology for the safe reuse of oil sludgecontaminated soil. Journal of Hazardous Materials, 136: 967-971.
McNabb D H, Johnson R L, Guo I. 1994. Aggregation of oil-and brine-contaminated soil to enhance bioremediation. In: Hinchee R E, Alleman B C, Hoeppel R E, et al. Hydrocarbon bioremediation. Lewis Publishers, Boca Raton. pp. 296-302.
Mrayyan B, Battikhi M N. 2005. Biodegradation of total organiccarbon (TOC) in Jordanian petroleum sludge. Journal of Hazardous Materials, 120: 127-134.
Nicholson C A, Fathepure B Z. 2004. Biodegradation of benzene by halophilic and halotolerant bacteria under aerobic conditions. Applied and Environmental Microbiology, 70: 1222-1225.
Rhykerd R L, Weaver R W, McInnes K J. 1995. Influence of salinity on bioremediation of oil in soil. Environmental Pollution, 90: 127-130.
Rocha O R, Dantas R F, Duarte M M M B, et al. 2010. Oil sludge treatment by photocatalysis applying black and white light. Chemical Engineering Journal, 157: 80-85.
Salanitro J P, Johnson P C, Spinnler G E, et al. 2000. Field-scale demonstration of enhanced MTBE bioremediation throughaquifer bioaugmentation and oxygenation. Environmental Science and Technology, 34: 4152-4162.
Vogel T M. 1996. Bioaugmentation as a soil bioremediation approach. Current Opinion in Biotechnololy, 7: 311-316.
Xu J G, Juma NG. 1995. Carbon kinetics in a black chemozem with roots in situ. Canadian Journal of Soil Science, 75: 299-305.
Xu N, Wang W, Han P, et al. 2009. Effects of ultrasound on oily sludge deoiling. Journal of Hazardous Materials, 171: 914-917.
X53
A
1006-8104(2014)-04-0018-07
Received 5 November 2014
Yu Ying (1990- ), female, Master, engaged in the research of soil science. E-mail: 419863908@qq.com
* Corresponding author. Xu Jing-gang, professor, supervisor of Ph. D student, engaged in the research of soil fertility and agricultural environmental protection. E-mail: jinggangxu@qq.com
杂志排行
Journal of Northeast Agricultural University(English Edition)的其它文章
- Degradation of Cry1Ab Protein Within Transgenic Bt Maize Tissue by Composite Microbial System of MC1
- Effect of Plasticizers on Properties of Rice Straw Fiber Film
- Effect of Daidzein on Ileum Microflora Biodiversity in Hy-Line Variety Brown Layers
- Effect of Dietary Alanyl-glutamine Supplementation on Growth Performance,Development of Intestinal Tract,Antioxidant Status and Plasma Non-specific Immunity of Young Mirror Carp (Cyprinus carpio L.)
