Local fscaldistressand investment ef ciency of local SOEs☆,☆☆
2014-02-22inxinLiaoYunguoLiu
X inxin Liao,Yunguo Liu
School of Business,Sun Yat-sen University,China
Local fscaldistressand investment ef ciency of local SOEs☆,☆☆
X inxin Liao1,Yunguo Liu❋
School of Business,Sun Yat-sen University,China
A R T IC L E I N F O
Article history:
Received 4 Sep tember 2012
Accep ted 20 Ju ly 2013
Availab le online 11 November 2013
Local government
In thispaper,weuse A-share listed f rms between 2002 and 2010 to investigate the relationship between local f scal distress and the investment ef ciency of local SOEs,along w ith the ef ect of corpo rate tax payments on this relationship.W e fnd a positive relationship between theextent of local SOEs’overinvestment and the f scal distress of the corresponding local government where the enterprise and this relationship become stronger for f rm s that pay fewer taxes.The pattern o f underinvestment among local SOEs was in contrast, and these relationships do notexist for non-SOEs or central SOEs.M oreover, we f nd that expand ing a f rm’s investm en t scale leads to an increase in to tal taxes paid,including income and turnover taxes,which further result in more local f scal revenue.Overall,we conclude that local governments have an incentive to increase fscal revenue when faced with f scal distress by raising the investment scale of local SOEs and that the incentives and ef ects of such interventions appear to be stronger among f rm s that contribute less to local f scal revenue.
©2013 Production and hosting by Elsevier B.V.on behalf o f China Journalo f Accounting Research.Founded by Sun Yat-sen University and City University o f Hong Kong.
1.Introduction
Investment ef ciency has long been a hot topic in accounting research(Jensen and M eckling,1976;Jensen, 1986;Stu lz,1990;W eiand Liu,2007),w ith Jensen(1986)initially investigating the problem using the agency theory fram ework,followed by Narayanan(1988)and M alm end ler and Tate(2005)exp loring the issue from the perspectives of info rm ation asymm etry and m anagerial overconf dence,respectively.The th ree m ain causeso f enterprises’overinvestm en t are found to be agency p rob lem s,in form ation asymm etry,and m anagerialoverconf dence.Subsequently,Fazzarietal.(1988),Aggarwaland Samw ick(2006),Tang etal.(2007),Xin et al.(2007)and Jiang et al.(2009)separately conduct in-depth assessmentsof the p roblem from the perspectiveso f f nancing constraints,management incentives,cash dividends,executive compensation,and management background,based on the theories of agency con f icts and information asymmetry.
The studies listed above restrict their focus to f rm-level factors,which certain ly do not cover all of China. State-owned enterprises(SOEs)in China are controlled by either the central or the local governmentsat different levels.The agency conf ictsbetween the government,which is the biggest shareho lder in most circumstances,and externalm inority shareholdersare quite dif erent from the common con f ictsbetween managers and shareho lders and between shareholders and bondho lders(La Porta et al.,1999;Jensen and M eck ling, 1976).Yang and Hu(2007),Cheng et al.(2008)and Chen et al.(2011)investigate the investm en t ef ciency prob lem from theperspectivesof thespecif c institutionalenvironmentand governm ent intervention in China. They f nd that the institutional environment in China and government intervention infuence the relationship between the factorso f f rms’free cash f ow,debt f nancing,cash dividends,management compensation,and corporate governance and the level of corporateoverinvestment,creating a non-negligib le factor that leads to f rms’overinvestment.
Contro lled by the government,SOEs are endowed w ith the responsibility for assisting the corresponding regional government in achieving various goals,such as the econom ic,social,and political goals o f boosting regional econom ic grow th;facilitating increases in regional tax revenues and emp loyment rates;maintaining social stability;and ensuring that investm en ts in em erging industries fou rish.This decreases the focus on the elem en tary goal of ef ective operations,com pared to non-SOEs(Chen et al.,2011;W eiand Liu,2007).SOEs bear heavy policy burdens that can lead to m u ltip le targets and inef cient operations.Thus,SOEsm ay suf er from low investment and decreased operational ef ciency,in addition to low pay performance sensitivity (PPS)among executives.Studies f nd that there have been incentives for local governments to boost their regional GDP by forcing the local SOEs under their contro l to overinvest(Tang et al.,2010)and that such activity has been an important approach for local bureaucrats to obtain promotions.M oreover,Xue and Bai(2008)and Chen et al.(2012)both f nd that local governmentshave an incentive to lift the local employment rate through overemployment in local SOEs.
Fo llow ing China’s decentralization reform in the 1980s,the p lanned economy has disintegrated gradually, providing local governmentsw ith extensive autonomous rights,including the right to contro l tax revenue.As a resu lt,local governm en ts acquire f nancial incen tives to com pete w ith each o ther(Jin et al.,2005;Young, 2000).A fter the 1994 refo rm of the tax system,tax revenue becam e a crucial source of local f scal revenue and f scal health becam e a core econom ic and social objective o f local governm en ts(Chen et al.,2011), together w ith the goal of regional econom ic development.In addition,it became an important app roach to help local governments to im plement their government functions and maintain social stability,along w ith the goalof regional employment.Each social and politicalgoal isan important incentive for the localgovernment to press po litical interventions into the operation of local SOEsand the f rms that bear policy burdens from thegovernment should behavedif erently from thosew ithout.However,studieson local fscaland f nancial conditions’inf uence over the operation o f local SOEsare rare,and this paper aims to f ll this gap in the literature.
The StateCouncilo f China issued the Decision of the StateCouncil to Implement Tax Distribution Financial M anagement System on Decem ber 15,1993.It announced that every province,includ ing provincial-level autonom ous regions and m unicipalities,shou ld abandon the present local f scal responsibility system and switch to the tax distribution f nancialm anagement system on January 1,1994.The tax categories wou ldbe unif ed under the follow ing categories:central tax,local tax,and cen tral-local shared tax.Likew ise,a standardized system of tax returnsand transfers from the central to local governm entswould be gradually established,2Refer to the Decision of the State Council to Implement Tax Distribution FinancialM anagement System.which is called the reform o f tax system.Under the new ly estab lished tax distribution system,tax returns from the centralgovernment constitutea certain portion of local f scalexpenditures,ensuring suf cient supp ly for theneedso f local fscalexpenditure.3Refer to the Decision of the State Council to Implement Tax Distribution FinancialM anagement System.The dependence on tax returnsand transfers from the central government variesgreatly across regions,based on their dif erent levelso f econom ic development.According to the fnancialstatisticsof each province(including p rovincial-level autonomous regionsandmunicipalities), app roximately 12.41–86.34%o f local fscal revenue comes from tax returnsand transfers from the centralgovernment,and the levels of each province’s def cit(the gap between fscal revenue and expenditure)vary from 4.91%to 94.7%,4Each percen tage is calculated based on statistics from the Financial Year Book of China(2003–2011),and the level of the def cit is calculated by the ratio of the absolute value of the def cit divided by the co rresponding year’s local expenditure.indicating that tax retu rnsand transfers from the cen tralgovernm ent constitu te a large,nonnegligible portion of local f scal revenue that refects local governm en t’s dem and fo r funds.Thus,we def ne a situation in which a provincial localgovernm en t facesa def cit based on their co rrespond ing f scal revenue and expenditure,which requires theassistanceof funds from tax returnsand transfers from the centralgovernment to pay thepost-def citexpendituresprompted by local fscaldistress.The levelof thedef citand the ratio of tax returnsand transfers from the centralgovernmenton the localgovernment’s total revenue can then beused as p roxies for themeasurem ent o f local fscal distress.
Based on the decentralization reform in the 1980sand the 1994 tax system reform,in this paper,we investigate the relationship between the level o f local fscal distress and the investment ef ciency o f local SOEs, alongw ith the in fuence of total taxes paid by the f rm on theabove relationship,using thedata of all A-share listed f rm sbetween 2002 and 2010.The samp le is classifed into local SOEs,non-SOEs,and central SOEs for robustness checks,w ith R ichardson’s(2006)overinvestm ent m odel,ad justed based on China’s econom ic regions and d if erent developm en t levels,m easu ring the extent o f investm en t d isto rtions.The results show that the levelof local SOEs’overinvestment(underinvestment)ispositively(negatively)related to theextentof corresponding localgovernm ents’fscaldistressand that paying lower corporate taxesenhances thepositive(negative)relationship between the extent o f local fscal distress and f rms’overinvestment(underinvestment). These patterns do not exist for non-SOEs.M oreover,fo llowing further study,we also f nd that raising f rms’investment scales leads to an increase in total corporate taxespaid,including both incom eand turnover taxes, which further results in higher local fscal revenue.Underinvested f rms shou ld increase their investment level directly,whereas those that have already overinvested should adjust their production,operation,and capital structures tomatch the present investm ent level before expanding their investment scale.In addition,we perfo rm robustness checksw ith a sam p le of central SOEs,rather than local SOEs,to rule out alternative exp lanations,such as the existence of abundant investm en t oppo rtunities or o ther facto rs un related to governm en t in terven tion o r political prom o tion tou rnam ents,and w ith 2SLS instead o f OLS to ru le ou t the po tential fo r reverse causality between the dependent and the independent variables.Pearson correlation testsof corporate taxes paid on ad justed/unad justed BTD and ETR are used to ru le out the alternative approach of increasing tax revenue through stronger tax en forcement instead of forcing local SOEs to investmore,w ith tax intensity rather than the level of corporate tax paid to rule out the competitive exp lanation that f rm s pay fewer taxes, thereby preserving more money,which can lead to overinvestment.Basu’s(1997)accounting conservatism m odel is also used to ru le out the possibility o f the government helping hand hypothesis.
This papermakes at least four contributions.First,p rior studies such as Tang et al.(2010),Zhou(2004), Xue and Bai(2008)and Chen et al.(2012)study the ef ect of political burdenson the behavior of SOEs from the perspectives of econom ic grow th and em p loym ent rates,whereaswe investigate the ef ect of governm ent’s social and po litical goals on SOEs’operational behavior from a fnancial perspective,which supp lem ents the literatu re on the po litical burdens from the governm ent that result in f rm s’m ultip le ob jectives.Second,we f nd that local governm entshave an incentive to increase fscal revenue by forcing local SOEs to expand their investment scale and that such intervention leads to local SOEs’overinvestment or a lowering o f the level o f underinvestm ent due to other reasons.M oreover,the local government’s intervention can,to some extent,result in what isexpected by the localgovernm en t,and that underinvestm ent leads to f rm s paying lower taxes. Based on the above f nding,we p rovide theoretical bases and references for theways in which local governmentsm ake fscal po licies and imp rove the supervisory ro les they p lay in relation to local SOEs.Third,we provide empirical evidence o f the governm ent grabbing hand theory through the perspectives o f local public fnance and enterp rise investment.Finally,we ofer a new research perspective for the study of f scal issues through f rm-level aspects.
The remainder o f thispaper p roceedsas fo llows:Section 2 reviews the literatureand describesChina’s institutional background to develop the research hypotheses.Section 3 describes the research design and sample selection procedure.Descriptive statisticsand empirical results,including robustness checksand further analysis,are in Section 4.Section 5 concludes the paper.
2.Literature,institutional background and hypotheses development
In theperfectworld described byM odiglianiand M iller(1958),enterpriseinvestmentdependson thenetp resent valueo f thep rojectand hasnothing to do w ith other factors.In reality,scho lars in f nancial felds fnd that M odiglianiand M iller’s perfectmarket theory doesnot efectively explain actual investment activities.In fact, som e enterp rises invest in p rojectso f negative net p resen t value(NPV)(Jensen,1986;Aggarwaland Samw ick, 2006).They conf rm that facto rs such as agency problem s(Jensen,1986),info rm ation asymm etry(M yersand M ajluf,1984),andm anagerialovercon f dence(Roll,1986;M alm end ler and Tate,2005)afect f rm s’investm en t decisions.Themainstream view argues that agency p rob lemsafect the level of enterp rise investmentexpenditure,further resu lting in underinvestment or overinvestm ent(Jensen,1986;Aggarwal and Samw ick,2006). Theseparation ofownership from management renders theinterestso fmanagersand shareho ldersinconsistent, andmanagersmakedecisions that distract from theshareho lders’p rimary goalof valuemaxim ization for their own privateinterests.This resultsin overinvestmentmosto f the time(Jensen and M eck ling,1976;Stulz,1990).In contrast,the resourcescontro lled by themanagergenerally increasew ith the freecash f ow p reserved in the f rm, whichbrings them moreprivatebenef tsand better reputations.Asa result,managershavean incentiveto engage in empirebuilding(Chen etal.,2011),which resultsin overinvestment(Jensen,1986).From another perspective, in form ation asymm etry scho larssuggest thatoverinvestm en t ism ost likelywhen insidershavem o reinfo rm ation than shareholders,especially regard ing thevalueo fp resentassetsowned by the f rm o r thep rospectivecash fow s of investm ent pro jects,in which the f nancing securities of the f rm are probab ly overvalued or undervalued (M yers and M ajluf,1984).The theory ofmanagers’overcon fdence suggests that overinvestmentmay be due to managers’overcon fdence in their ability or the f rm’s competitiveness,even though them anager isutterly loyal to shareholders’goalof valuemaxim ization(M almendler and Tate,2005).
The traditionalagency theory suggests thatagency conf ictsmainly existbetween shareho ldersandmanagers (Berleand M eans,1932;Jensen and M eckling,1976)and between shareho ldersand bondholders(M yers,1977). However,studies based on China’s capitalmarkets fnd that there exists a third agency conf ict,namely that between thegovernment and them inority shareho lders.In most situations,the government isalso the biggest shareholder(La Po rta etal.,1999;Chen etal.,2011).On the one hand,the governm ent isan owner o f theen terpriseand obtainsbenef ts from itsoperationalactivities,asdo other owners.On theother hand,thegovernm en t sim u ltaneously actsas society’s adm inistrator,responsib le for boosting regionaleconom ic developm en t(GDP grow th)to facilitate increases in regional tax revenues and employment rates(Chen et al.,2011;Zhang and Wang,2010).This leads to themu ltip legoalso f SOEs,which usually dif er from theprimary goalof shareho lders’valuemaxim ization(Zhang and Wang,2010).M oreover,thegovernmentmay actas thegrabbing hand in pursuing itssocialand politicalgoals(Fryeand Sh leifer,1997),reducing thevalueo f localSOEsby tunneling.To summarize,all of theseactivities con f ictw ith the interestsofm inority shareho lders.
The literature fnds that local governmentshave an incentive to boost local GDP grow th through overinvestment by local SOEs(Tang et al.,2010)and to help localbureaucrats succeed in political promotion tournaments–themain criterion for which is GDP grow th(Liand Zhou,2005).In addition,Jin et al.(2005), Young(2000)and M on tinola et al.(1995)suggest that China’s decen tralization reform in the 1980s has created incen tives not only for political prom otion am ong local bu reaucrats,but also fo r f scal revenue.China’s tax system refo rm,which began in 1994,specifes that bo th SOEsand non-SOEs shou ld pay businessand income taxes to the government,declaring an end to a history in which SOEs need not pay taxes under thesystem of f scal contract responsibility.Subsequen tly,tax revenue has becom e one of the m ost im po rtan t sourceso f local f scal revenue and local bureaucrats compete for both local econom ic grow th and tax revenue (Zhou,2004).Compared to the centralgovernment,localgovernmentscontro l fewer resourcesand thushave stronger incentives to seek help from the local SOEsunder their control(Chen et al.,2011).Jin et al.(2005) also suggest that localgovernmentshave an incentive to increase local fscal revenue by forcing local SOEs to increase their investment level.
Based on the fnancialstatisticsof each province(Tab le 1),income taxes constitute about20%o f localgovernments’tax revenue each year,w ith the rem aining 80%rep resented by turnover taxes,which make up the vastmajority o f tax revenue.The objectsof taxation for turnover taxesare the amount o f transfersgenerated by the p roduction and circu lation procedu res fo r comm oditiesand the num ber o f turnovers fo r non-comm odities,so increasing a f rm’s investm ent level ought to result in transfer activities for comm od ities or turnover fo r non-comm odities,lead ing to an increase in turnover taxes.In addition,increasing the investm en t level could help to expand a f rm’sscale,given a normal levelo f investment,thus improving itsp roduction capacity, further raising its pro f tability,and u ltimately increasing the income taxes paid by the f rm.In addition,Jian and W ong(2010)and Cheung et al.(2008)f nd that compared to central SOEs,it ismore common for local SOEs to transport resourcesand interests to the local governm ent underwhich they operate.In termso f non-SOEs,they are relatively free from the intervention of local governments and thus are less likely to invest in negative net present value pro jects for the sake o f the government’s social and political goals,such as local GDP grow th,tax revenue,and employment rate factors.Therefore,as the ultimate controllerso f local SOEs, local governments have an incentive to force local SOEs to raise their investment level–thereby achieving their goals o f increasing f scal revenue and the easing o f fnancial crises when faced w ith fnancial distress, and continuous increases in investm en t,which inevitab ly leads to local SOEs’investm ent levelsbecom ingm ism atched with the p resent production,operation,and capital structures.This can result in an upward biaso f investment scale and,eventually,in overinvestment.Furthermore,the p robability and extent of such an upward bias should be higherwhen local governmentshave a stronger incentive to increase investments,leading to more severe overinvestment of local SOEs.
The above discussion leads to our f rst hypothesis:
H 1.The level of overinvestment for local SOEs is positively related to the extent o f local f scal distress, whereas this relationship does not exist for non-SOEs.
From the perspective of the grabbing hand theo ry,the governm ent hasan incentive to exp loit pub lic f rm s. Thus,not on ly local governm ents have an incen tive to raise f scal revenue by fo rcing local SOEs under their contro l to raise their investm en t scales when the governm en t faces f nancial d istress,which suppo rts H 1,bu t also themotivation and ef ect of such intervention should be stronger for f rms that contribute less to local f nance.

Table 1 Tax revenue structure of local government(provincial level).
In the yearsbefo re the1994 tax system refo rm,thep rof tsgenerated by SOEsshould havebeen to tally or partially turned over to the government.A fter the 1994 reform,SOEs paid the governm ent businessand income taxesinstead ofpro f ts fora longperiod of tim e.In Decem ber2007,theM inistryo f Financeand theState-owned AssetsSupervision and Adm inistration issued the Transientmanagement regulationof theprof tsgenerated by the state-owned capitalofcentralSOEs,which requirescentralSOEs to turn over thepro f ts theygenerate.But,local SOEsarenot included in this regulation.So based on the institutionalbackground suggesting that local SOEs need on ly pay taxesasopposed to turning over their prof ts,tax revenue becomesone o f themost important sourcesof localf scal revenueand avital factor in balancing localf scal revenueand expenditures.W ithout turningoverp rof ts,thenotion thatpaying fewer taxesisequivalent to thato fcontributing lessto localf scal revenue. Asa consequence,localgovernm entshavean incentive to force localSOEs that con tribute lessto local fnance to increase their investm ent level,lead ing once again to an upward biasof investm en t and,ultim ately,overinvestm ent.Thesep redictionsare consisten tw ith Brennan and Buchanan’s(1980)belief that thegovernm en t isalways seeking tomaxim ize tax revenue,and thus,our second hypothesis isas follows:
H 2.Fewer taxes paid by local SOEsenhance the positive relationship between the levelof overinvestment for local SOEs and the exten t of local f scal distress,whereas this relationship does not exist fo r non-SOEs.
The factorsafecting corporate investmentare complicated(Jensen,1986;M yersand M ajluf,1984;Narayanan, 1988;M almendler and Tate,2005;Chen etal.,2011,etc.),and they usually behaveinteractively,resulting in overinvestmentorunderinvestment depending on theinteraction efects.Thegrabbing hand theory suggests that thegovernmentextractsvalue from localSOEsfor their socialorpo liticalsakes through tunneling(Fryeand Shleifer,1997), and the leviathan hypothesis developed by Brennan and Buchanan(1980)defnesgovernmentasan agent thatmaximizes tax revenue.Thus,localgovernmentshavean incentive to force localSOEsunder their controlinto increasing their investment levels to achieve theirgoalof increasing fscalrevenue.Thisresultsin a reliefofunderinvestment for f rm s thathavealready underinvested due to other factors,and theef ectsof such intervention shou ld bestronger fo r the f rm s that contribu te less to local f nance.Finally,we have our third hypothesis:
H 3.For underinvested f rms,the extent of the local governm ent’s f scal distressm itigates the level of local SOEs’underinvestment,and this negative relationship is stronger for f rms that pay fewer taxes,whereas this relationship does no t exist fo r non-SOEs.
3.Research design
3.1.M odel construction and variable description
3.1.1.Overinvestmentmodel
We construct our overinvestmentmodel fo llow ing Richardson(2006)and adjust it based on regional econom ic efects,LocalEco,according to the striking dif erences in investment opportunities across regions,see M odel(1):

In M odel(1),Investi,tmeasures the investment level in year t,and thevariab leson the rightare allmeasured in year t-1,w ith Growi,t-1representing grow th opportunities,Levi,t-1rep resenting the debt-to-asset ratio, Cashi,t-1representing cash fow,Agei,t-1representing the time in years since the f rm went public,Sizei,t-1representing corporate scale,Reti,t-1rep resenting stock returns and Investi,t-1rep resenting the investment level.W e also useΣIndustry,ΣYear,andΣLocalEco to contro l for industry,year,and regional efects, respectively.The regions comprise the east coastal,central,and thewestern frontier areas,5The east coastal areas include the provinces and provincial-level autonomous regions and municipalities of Beijing,Tianjin,Hebei, Liaoning,Shanghai,Jiangsu,Zhejiang,Fujian,Shandong,Chongqing,Guangdong,Guangxiand Hainan.The central areas comp rise Shanxi,Inner M ongolia,Jilin,H eilongjiang,Anhui,Jiangxi,Henan,Hubei and H unan.The western fron tier areas include Sichuan, Guizhou,Yunnan,Tibet,Shaanxi,Gansu,Qinghai,N ingxia and Xinjiang.representing thethree econom ic regions of China.The residualεin themodel refers to the level of overinvestment or underinvestment,w ith positiveor negativevalues,respectively.Wedefneoverinvestmentas OverInvi,tand the absolute value of underinvestment as Under Invi,tw ith a larger value to represent am ore severe underinvestment situation.

Table 2 Variable defnitions and descriptions.
Finally,regarding themodel’s systematic errors,theremustbe some diference between the predicted value and the corresponding observed value,and not all of the gaps between these two values are necessarily overinvestment or underinvestment.Therefore,we select the observations that are larger than the tenth percentile o f OverInvi,tand UnderInvi,tas ou r research sam p le.
3.1.2.The empiricalmodel
W e constructM odel(2)to test H 1 and M odel(3)to test H 2 and H 3.The defnitionsand descriptionsof the variab les are presented in Table 2.W e perform cluster treatm en ts on p rovincial efects.

In M odel(2),we construct two p roxies for them easu rem en t o f local f scal d istress.In m easu ring corporate f nancial distress,W u and Lu(2001)def ne a f rm being ST o r PT as an indicato r o f f nancial distress.Dahiya et al.(2003)def ne fnancial distress as a f rm being unable to pay itsmatured debtwith su f cient cash f ow.Liao and Chen(2007)classify f nancial distress as a f rm’s EBITDA being less than in terest expense fo r two consecutive years,or becom ing insolvent.One o f the common features o f these corporate f nancial distress criteria is that the f rm cannot make end meet.Sim ilarly,government fnance includes f scal revenue and expenditure,w ith a fscal expenditure larger than the revenue referred to as a f scal def cit.Regarding the determ ination of corporate fnancial distress,we defne the existence o f a fscal def cit to be the criterion o f governm ent f scal distress.M oreover,the extent of fscal distress is considered more severe if the government hasmore fscal expenditures than their counterpartsw ith the same f scal def cit.As a result,we use the percentage of f scal def cit on Local Expenditure o f the local government to measure the extent of local f scal distress,defned as Distress1.From the perspective o f fscal revenue alone,in addition to Taxes and Non-tax revenue,the item of local Total Revenue also consists o f Transfers from Central Government(Including Tax Returns),Revenue of Loans from National Debt,and Balance Revenue of Last Year,etc.,com prising the Total Revenue–the am ount equivalen t to that of Total Expenditure,com p rising Local Expenditure and o ther item s such as Transfers to Central Government and Added Budgetary Revolving Fund.Transfers from Central Government(Including Tax Returns)generally constitutesa great portion(from 12.41%to 86.34%)o f thegovernment’s Total Revenue,which serves as supplementary funds when the local government cannotmake ends meet.Therefore,we argue that the ratio o f Transfers from Central Government(Including Tax Returns)on Total Revenue is a good p roxy for the local government’s fscal distress,demonstrated as Distress2.
As Tab le1 demonstrates,the ob jectso f taxation for turnover taxes,which constitute 80%of local revenue, are the amount o f transfers generated by the commodity p roduction and circu lation procedures and the amount o f turnovers for non-commodities.Thus,it increasesw ith corporate investment.In terms of income taxes,it is paid only after operating pro f ts are generated,so there isusually a tim e lag between the increase in corporate investm en t and the co rrespond ing paym ent of incom e taxes.However,since incom e tax com p rises only 20%of total tax revenue for the local government,the problem o f the time lag is not severe,and on ly 1 year lagged values o f Distress are needed.
Incorporating the interaction term o f local fscaldistressand corporate taxespaid into M odel(2),we obtain M odel(3).

Feltenstein and Iwata(2005)argue thatall tax revenue is collected by the localgovernmentand then shared between the localand the centralgovernments,so localgovernments in China havean incentive to reduce their eforts on the typesof tax theymust sharewith the central government under China’s tax distribution system established after 1994.W u et al.(2011)demonstrate that income taxes from enterp rises,business taxes from sales and services and personal incom e taxes constitute localgovernm en ts’m ajor tax revenue.Under China’s tax law,Business Tax,U rban M aintenance and Construction Tax,Contract Tax,Housing Property Tax,Vehicle and Vessel Usage Tax,Stamp Tax,Tax on the Use of A rable Land,Tobacco Tax,Land Value-added Tax, and Urban Land Using Tax,etc.,comprise local governm ents’regular revenue–100%o fwhich is turned over to local governments along w ith Resource Tax,whereas Income Tax and Value-added Tax shou ld be shared between local and central governmentsw ith 40%and 25%,respectively,taken away by the central government.In termsof the income statement,Business Tax and Surcharges consisto f all tax itemsbelonging to local governm ents’regu lar revenue,and Income Tax refers to the income taxescurrently paid by the f rm.A lthough the content of Value-added Tax is not provided in the income statement,it is not signif cant in this study because Business Tax and Surcharges account for 75%of the total turnover taxes,which constitute 80%o f total local tax revenue,leaving the remaining 25%to be Value-added Tax.
Consequently,the Business Tax and Surcharges on the incom e statem en t,to som e extent,could be a good proxy fo r turnover taxesw ith the sum o f Business Tax and Surcharges and Income Tax properlym easu ring the taxes paid by the f rm.The am ount o f taxes actually paid by the f rm is usually afected by item s such as Deferred Income Tax Assets,Deferred Income Tax Liabilities,and Tax Returns,etc.,w ith Tax Payments onthe incom e statem ent consisting o f Payment of Previous Period Due,Payable Tax,and Prepaid Tax.Thus,it is not approp riate tomeasure theamounto f corporate taxespaid w ith Tax Payable on thebalancesheetorw ith Tax Payments on the incomestatement.Thesum o f Income Tax Expense and Business Tax and Surcharges on the income statement app rop riatelymeasures the current taxes paid by the f rm,and we use itsnegative logarithm value asa p roxy for corporate taxespaid,denoted by N_Tax,to properly demonstrate the relationship in H 2.Hence,we have a higher value of N_Tax w ith lower corporate taxes paid and vice versa.
For details regarding the selection of the contro l variables in M odels(2)and(3),please refer to the Introduction.
3.2.Data source and sample procedure
We co llectour f nancialdata from the Finance Year Book of China(2003–2011)and allother f rm-leveldata from the China Stock M arketand Accounting Research database(CSM AR).Our sample comprisesall A-share f rmsbetween 2002 and 2010,elim inating observations thatareas follows:(i)attributed to the fnancial industry,(ii)listed less than 1 year,or(iii)havem issing data.Finally,we obtain 10244 f rm-year observations and w insorize the sample at the 1%and 99%levels.
4.Results
4.1.Descriptive statistics
Table 3 shows the descrip tive statistics for local government fscal distress.Them inimum and maximum values for Distress1 are 4.91%and 94.70%,respectively,and those for Distress2 are 12.41%and 86.34%, respectively.The resu lts show that there is no great diference between the two proxies o f Distress1 and D istress2.
Table 4 disp lays descrip tive statistics for allo f the variab les.Tables5 and 6 provide descriptive statistics fo r the subsamp leso f f rm-yearsw ith overinvestment and underinvestment and for the subsampleso f local SOEs and non-SOEs,respectively.
The resu lts of the two-tailed t-tests shown in Tab le 5 reveal that themajority o f variables for overinvested f rmsare signif cantly dif erent from that for their underinvested counterpartsand that overinvested f rmsare m ore concentrated in regionsw ithm ore severe f scal distress,compared to underinvested f rms.The resultso f the two-tailed t-tests shown in Table 6 disp lay that each variable for local SOEs is signif cantly dif erent from that for non-SOEs,except for GDP grow th.Likew ise,local SOEsaremore concentrated in regionsw ithmore severe f scal distress,compared to non-SOEs.
Table 7 p rovides the Pearson correlation m atrix fo r allo f the variables.The resu lts show that the abso lu te values of the correlationsbetween m ost of the contro l variablesare less than 0.3,which suggests that there are no co llinearity problem s between the con trol variables.M o reover,the co rrelation between the two p roxies o fDistress1 and Distress2 is0.9864,statistically signif cant at the 0.01 level,indicating that these two proxiesare consistentmeasures of the same variable.
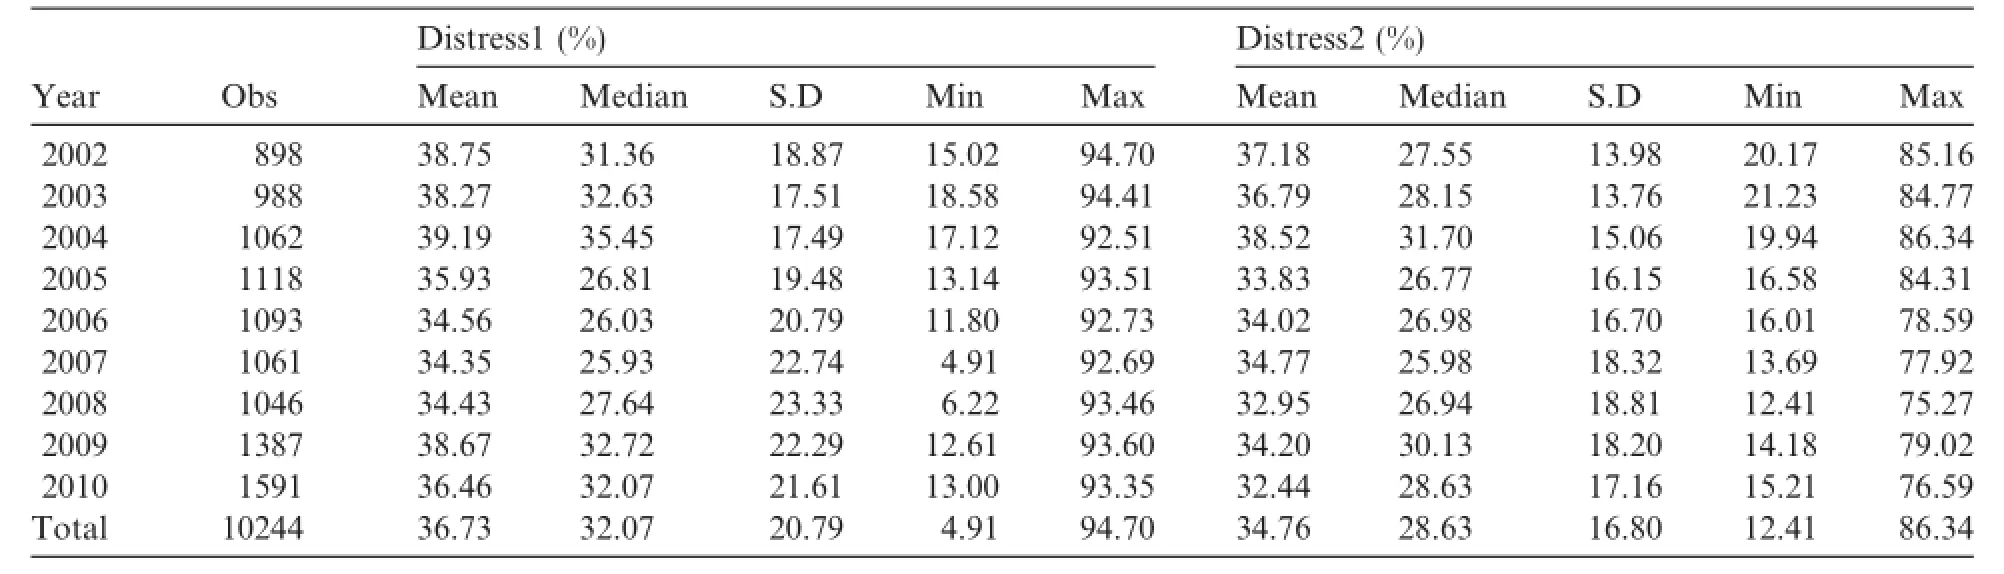
Table 3 Descriptive statistics for local f scal distress.

Table 4 Descriptive statistics for all variables.
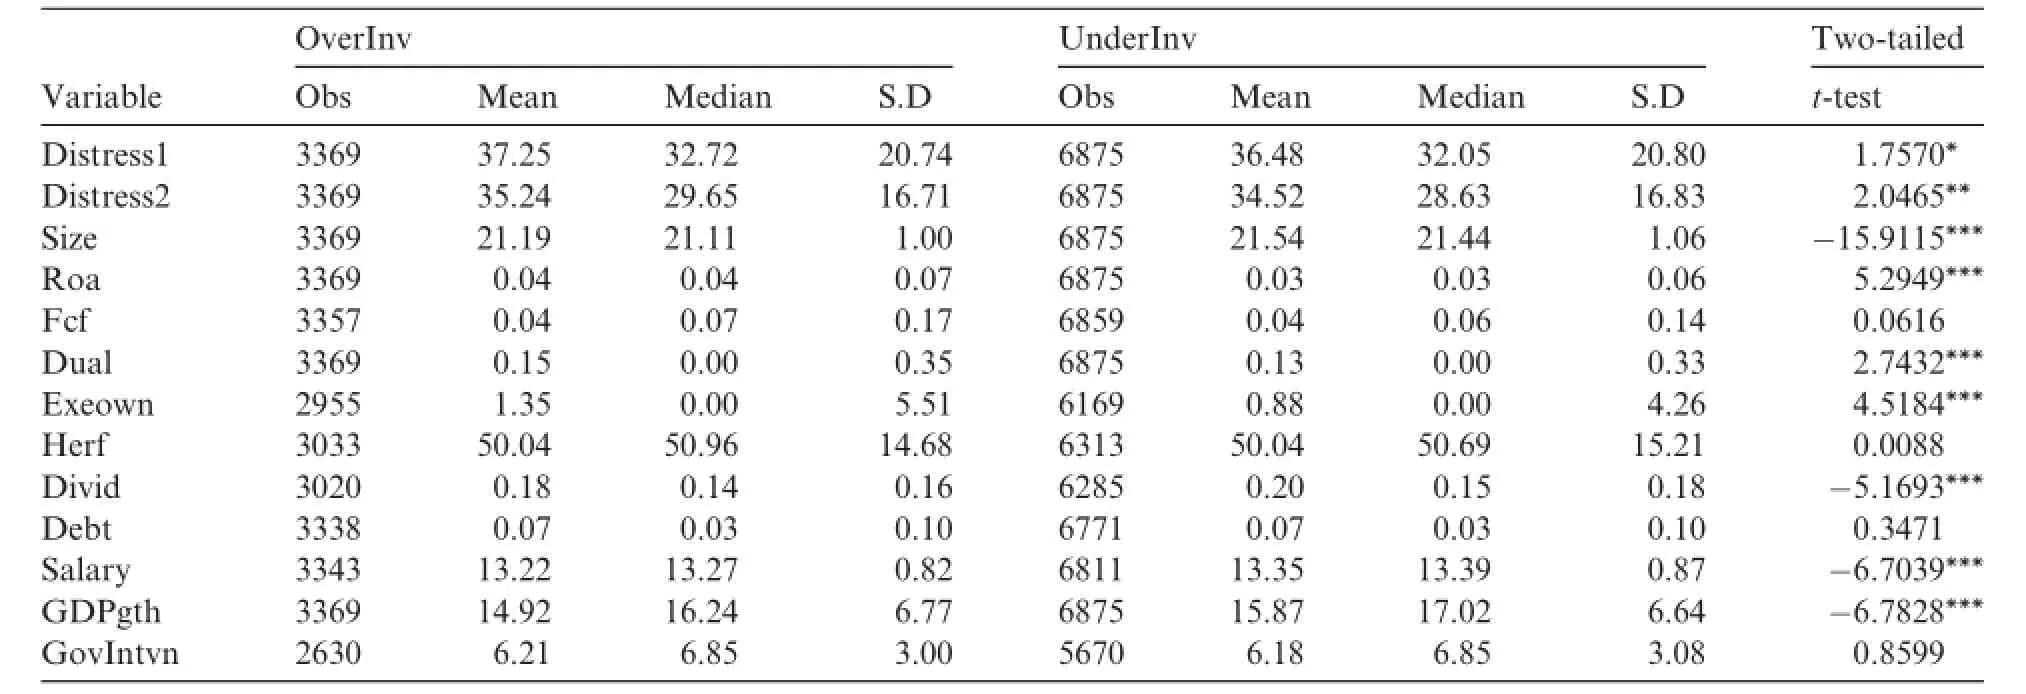
Table 5 Descriptive statistics for all variables for overinvestment and underinvestment groups.
4.2.Empirical results
Table 8 shows the regression results for local fscal distress and the extent o f overinvestment am ong local SOEs and non-SOEs.The f ndings suggest that the coef cients o f Distress1 and Distress2 for local SOEsare positive and statistically signif cant at the 0.01 level,whereas those for non-SOEs are not signif cant at all, which is consistentw ith H 1.
Table 9 reports the resu lts o f the ef ect of co rpo rate taxes paid on the positive relationship between local f scal distress and the level of overinvestm en t dem onstrated in Tab le 8.The resu lts show that the coef cien ts of D istress1×N_Tax and D istress2×N_Tax fo r local SOEs are positive and statistically signif can t at the 0.05 and 0.01 levels,respectively,indicating that lower taxes paid by local SOEs strengthens the positive relationship between local f scal distressand the extento f their overinvestment,while those for non-SOEsare not signif cant at all,which is consistentw ith H 2.

Table 6 D escriptive statistics for all variables for local SOE and non-SOE groups.

Table 7 The Pearson correlation m atrix for all variables.
Table 10 p resents the resu ltsof the relationship between local f scal distress and the extent o f underinvestm ent for local SOEs,and the efecto f corporate taxespaid on this relationship.The resu lts show that the coeff cients of Distress1 and Distress2 in co lumns 1 and 2 and Distress1×N_Tax and Distress2×N_Tax in colum ns 3 and 4 fo r local SOEs are all negative and statistically signif cant,whereas those for non-SOEs shown in colum ns 5–8 are not signif cant at all,ind icating that local f scal d istress helpsm itigate the exten t o f underinvestm ent fo r underinvested local SOEs and that this ef ect is stronger fo r the f rm s that pay fewer taxes,whereas this pattern does not exist for non-SOEs,which is consistentw ith H 3.
In summary,the resu lts shown in Tables 8–10 suggest that local fscal distress is positively related to the extent o f local SOEs’overinvestm ent and that this relationship is strongerwhen lower taxesare paid by local SOEs.M eanwhile,local fscaldistress isnegatively related to the extent o f local SOEs’underinvestment,and this negative relationship is also strongerwhen lower taxes are paid by local SOEs.However,the above rela-tionshipsdo not exist for non-SOEs.Therefore,we conclude from theempirical resu lts that there isa positive relationship between the levelo f local fscaldistressand theextento f local SOEs’investm entexpenditure,such that localgovernmentshavean incentive to boost tax revenue by forcing the local SOEsunder their contro l to raise investment scales.Local governments also have an incentive to exert greater pressure on the f rms that contribute less to local fscal revenue(thosewho pay fewer taxes),whereas the investment behavior o f non-SOEs is o f no relevance to local f nances.

Table 8 Local Fiscal distress and co rporate overinvestm ent.
4.3.Further analysis
Based on the grabbing hand theory,local governments faced w ith fscal distress have an incentive to increase fscal revenue by forcing local SOEs to raise their investment expenditure,and them otivation and efect of such in terven tion are stronger am ong f rm s that contribu te less to local f nances–in linew ith p reviously stated logic.However,lower investm ent ef ciency due to overinvestm en t o r underinvestm en twou ld theoretically lower a f rm’s pro f tability,leading to less incom e tax paid by the f rm.Tu rnover taxes,which m ake up local governm ents’m ajo r tax revenue,are afected by the am oun t o f transfersgenerated by the comm od ityp roduction and circu lation p rocedure and the number o f turnovers for non-commodities.However,a decline in pro f tability leads to a reduction in free cash fow and even f nancialdistress,which impairs f rms’commodity production,distribution,and operations to f nally reduce local turnover revenue.Therefore,it is doubtful that local governm ental intervention hasachieved the p rospective goalo f increasing f scal revenue by forcing local SOEs to raise their investment level,resu lting in overinvestmentor a reduction in underinvestm ent,given that intervention inducesa bad ef ect on corporate performance.The fo llow ing section addresses these issues.
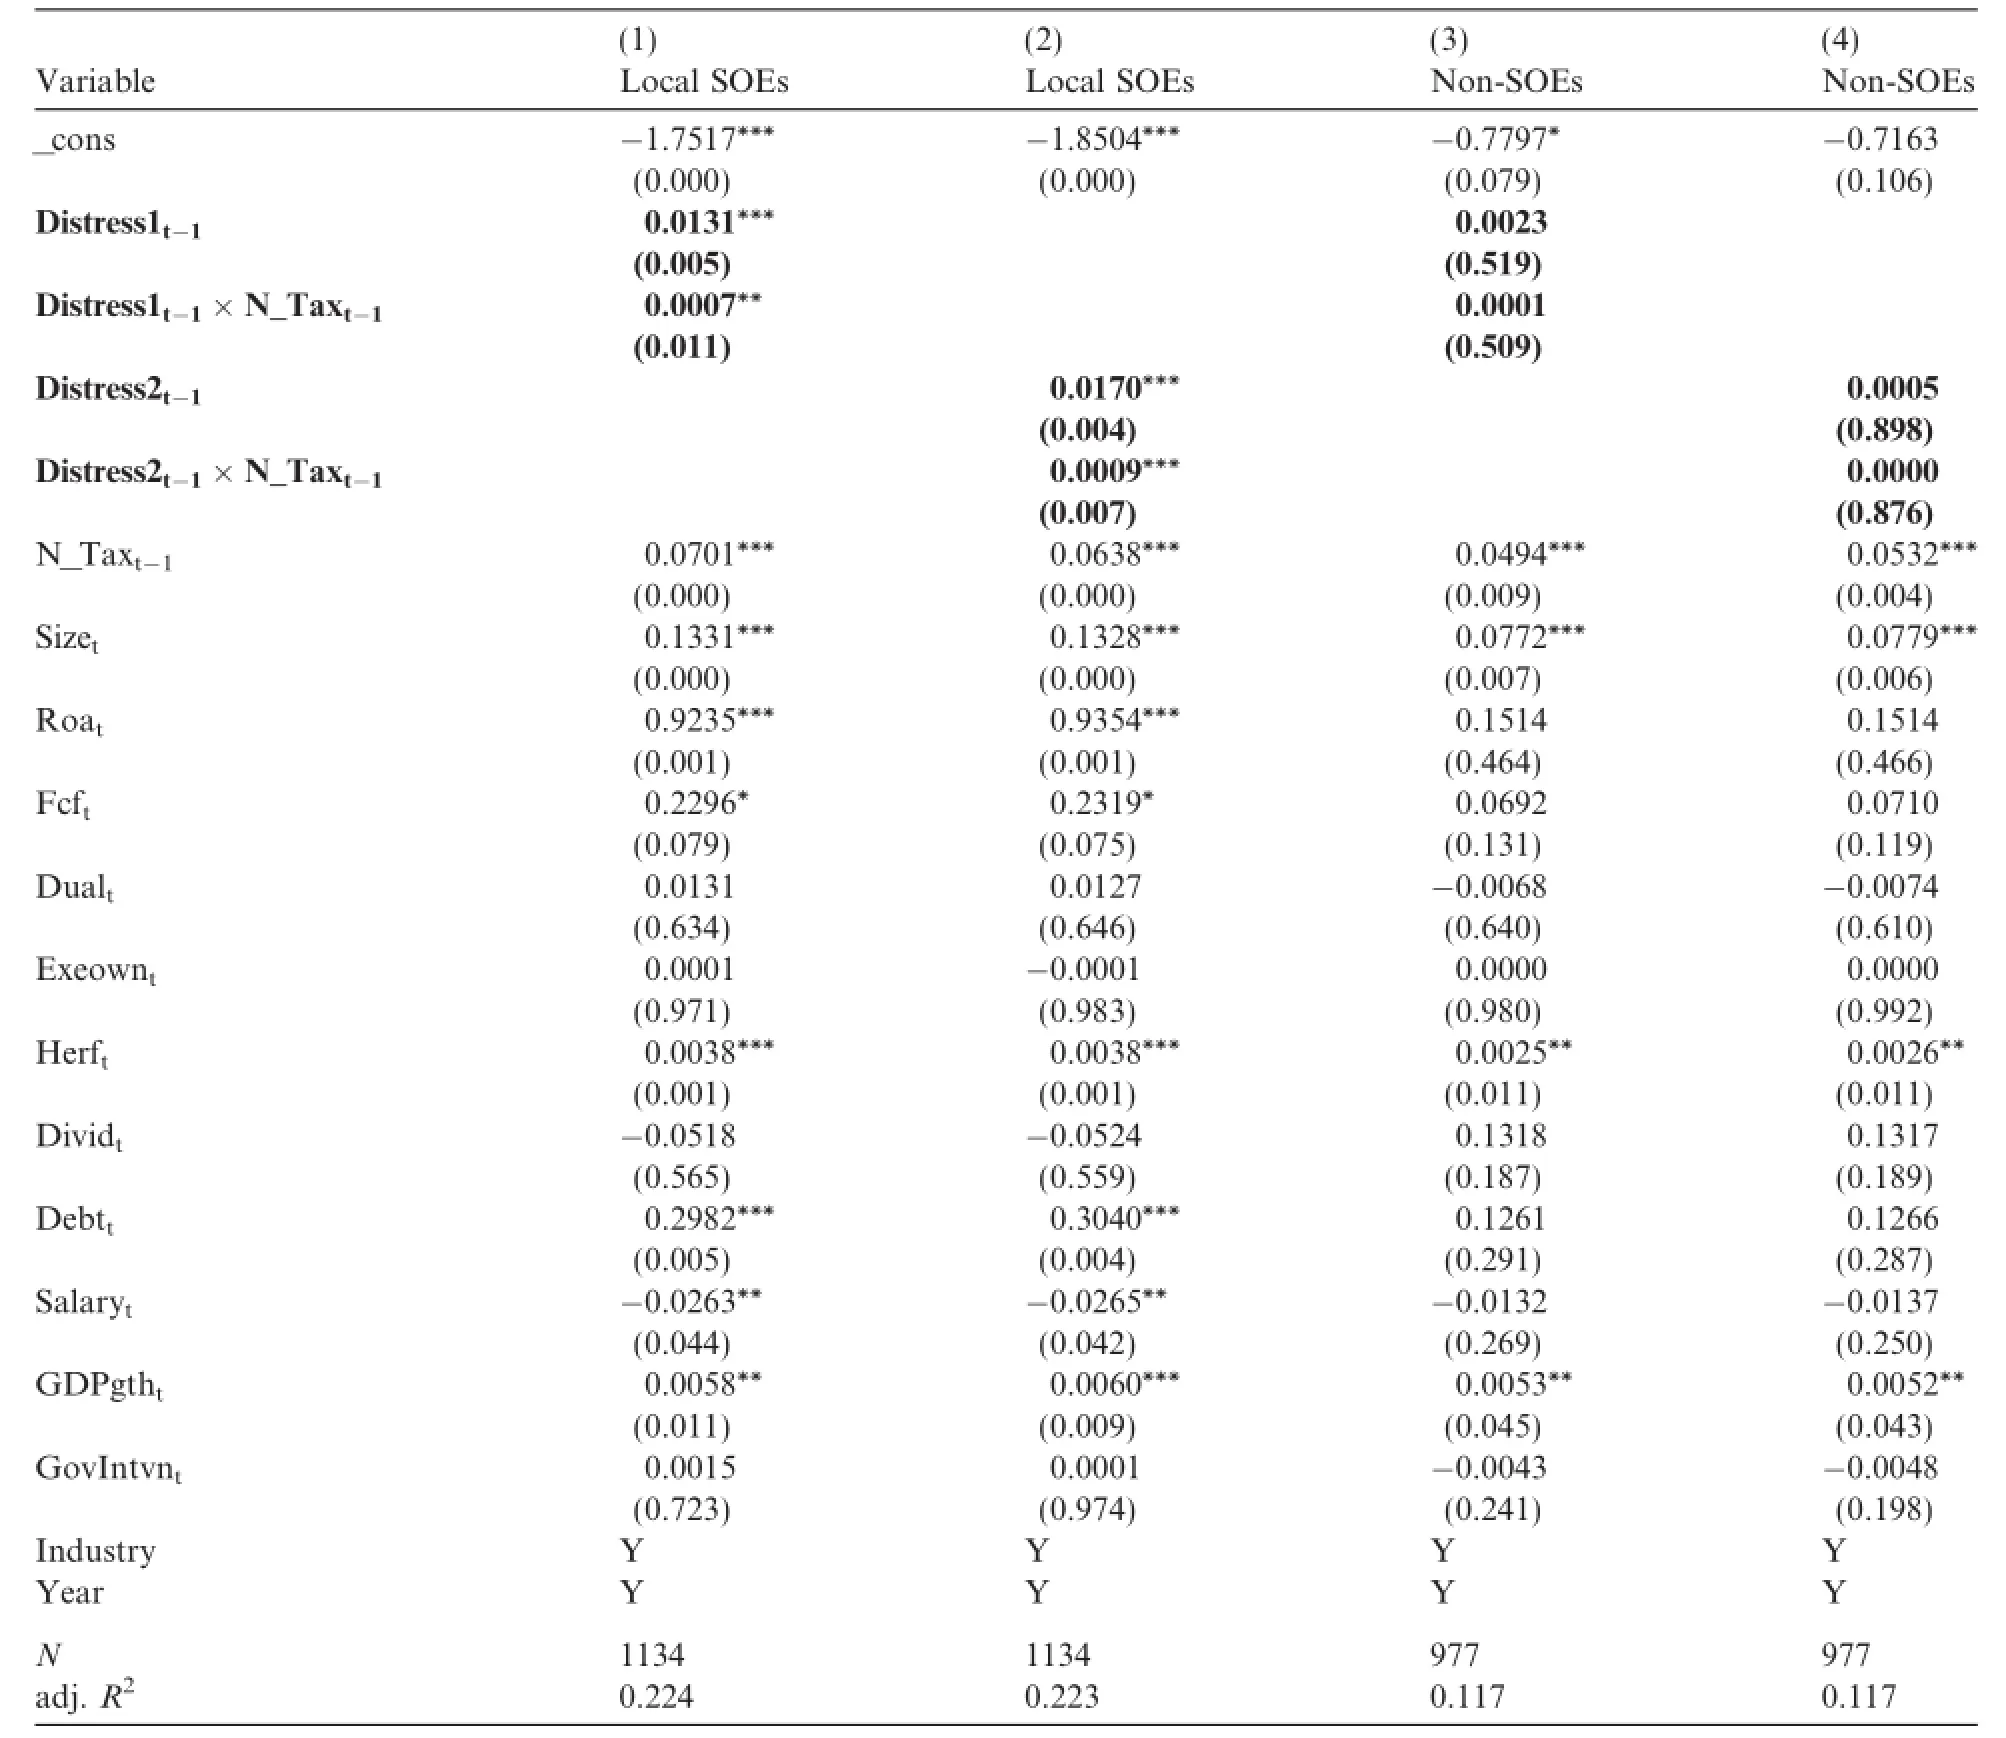
Table 9 E fect of corpo rate taxes paid on local f scal distress and corporate overinvestm ent.
We construct a set of nested models(M odel(4))and perform F-tests to exam inewhether there isa significant d iference between the ef ects o f actual and norm al corporate investm ent levels on the taxes paid to the government.Theef ecto f the normal investment levelon corporate taxes paid is signif cantly greater than that o f the actual level if the coef cientα2is signif cantly larger thanα1in M odel(4.1).Sim ilarly,M odel(5)isconstructed to determ inewhether there isa signif cant diferencebetween theef ectso f actualand normal corporate investment levels on corporate performance.W e construct threemeasurements o f taxes in M odel(4). One is for total taxes paid Tax_total,which is identical to that in M odel(3),and the other two are for the levelso f turnover Tax_turnover and income Tax_income taxes,w ith Business Tax and Surcharges and Income Tax Expense on the income statement as the proxies,respectively.Corporate performance in M odel(5)has two proxies:return on assets(Roa)and operating p rof tmargin(Opr),respectively.

Table 10 Local Fiscal D istress,Corporate Underinvestm ent and the Efect of Corpo rate Taxes Paid.
The independent variables in the two sets of nested models are the level of actual corporate investment (Invact)and that o f norm al investm ent(Invnor)along w ith their sum(Invact+Invnor),in which the no rm al investment level is calculated w ith the overinvestment model,namely M odel(1).The control variables in the two sets of nested models are as follows:f rm size(Size),return on total assets(Roa),fnancial leverageratio(Lev),capital in tensity(ratio of f xed assets on total assets,Cap Int),inventory intensity(ratio of inventory on totalassets,InvInt),intangib le asset intensity(ratio of intangible assetson totalassets,IntInt),investm ent opportunities(ratio of corporatemarket valueon corporate book value,M B),ownership concentration (theshareholding of the f rstmajority shareho lder,Herf),CEO duality(Dual),corporategrow th opportunities (Growth),and free cash fow(Fcf).Our selection of the contro lvariab les follows Zimmerman(1983),Derashid and Zhang(2003),Porcano(1986)and Gup ta and Newberry(1997).Given the endogeneity prob lem between the control variab les,we use 1-year lagged values of f rm size,return on total assets and f nancial leverage ratios instead of current values.
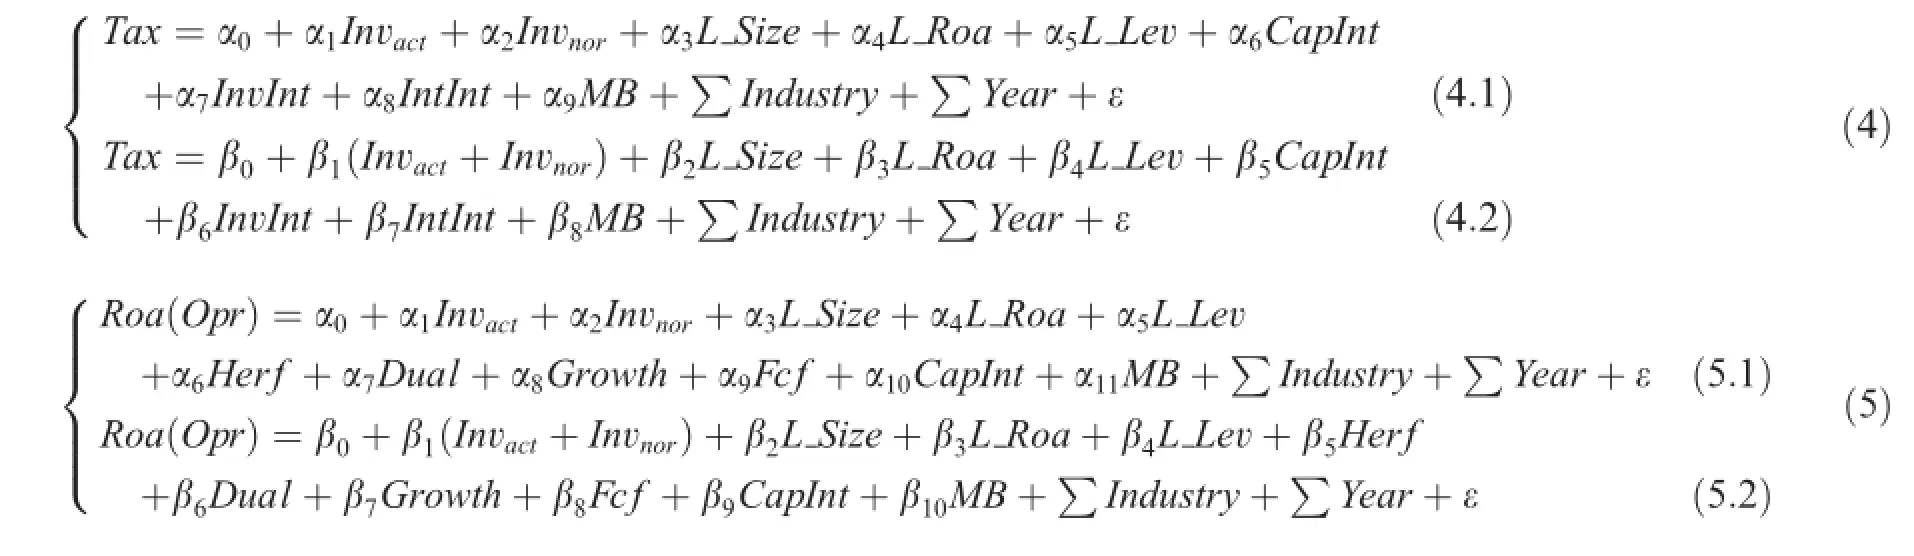
Table11 demonstrates thediference in the efecto f the levelo f actual investmentand thatof normalinvestm ent,as calcu lated w ith the overinvestmentmodel(M odel(1)),on corporate taxes paid.Due to this paper’s length constraints,Table 11 on ly shows the empirical results of M odel(4.1).
Table11 reveals the follow ing details.The coef cientsof Invactin thewholesampleand two subsamplesare all signif cantly positive,indicating that an increase in actual investment does lead to an increase in both income and turnover taxes paid by the f rm.For the turnover taxes(Tax_turnover)in each sample,none o f the coef cients for Invnorare statistically signif cant,while those for Invactareallsignif cantly larger than those fo r Invnor,w ith F-values of 8.74,4.24,and 5.08,respectively,and p-values of 0.0031,0.0395,and 0.0242, respectively.This suggests that tu rnover taxes paid by f rm s increase asactual co rporate investm en t increases, but are irrelevant in relation to corporate investment ef ciency.For income taxes(Tax_income)in thewhole sample and the underinvestment subsamp le,the coef cients for Invnorare all signif cantly larger than those for Invact,w ith F-values of 3.51 and 5.36,respectively,and p-values of 0.0612 and 0.0206,respectively.The coef cients for Invnorand Invactin the overinvestment subsamp learenot signif cantly diferent,w ith an F-value o f 0.04 and a p-value o f 0.8477,indicating that the income taxes paid by underinvested f rmsare signif cantly lower than those paid by their normally invested counterpartsw ith the same investment scale and that overinvested f rms do not paymore income taxes than their normally invested counterpartsw ith the same investm ent scale.
These em pirical resu lts suggest that a higher investm en t level generally helps increase both incom e and tu rnover taxes paid by f rm s,bu t investm en t ef ciency greatly in fuences corporate taxes paid.Specif cally, fo r total taxes and incom e taxes,overinvestm en t does no t induce m ore tax paid to the governm en t than the normal level,whereas underinvested f rms pay fewer income taxes than their normally invested counterparts w ith the same investment scale.Turnover taxes are positively related to the actual investment level but unrelated to the normal investment level,consistentwith the theoretical analysis that the turnover taxes generated by a f rm are irrelevant to its investment ef ciency,but positively related to the level of actual investment.
Table A 1 p resents the diferences in the efectsof actual and normal investment levelson corporate perform ance.Due to length restrictions,Tab le A 1 on ly shows the empirical results for M odel(5.1).
Table A 1 shows that the coef cientsof Invactand Invnorare all positive and statistically signif cant in each group,and the coef cien ts for each Invnorare all signif cantly larger than those for the corresponding Invact. The results suggest that although an increase in the levels of actual and norm al investm ent both lead to im p rovem ents in co rpo rate perfo rm ance,the perform ance im provem en ts in underinvested f rm s are signifcantly smaller than those observed in normal-level f rms w ith the same investment scale.The resu lts alsoindicate that the performances of overinvested and underinvested f rm s are worse than those of normally invested f rmsw ith the same investment scale.
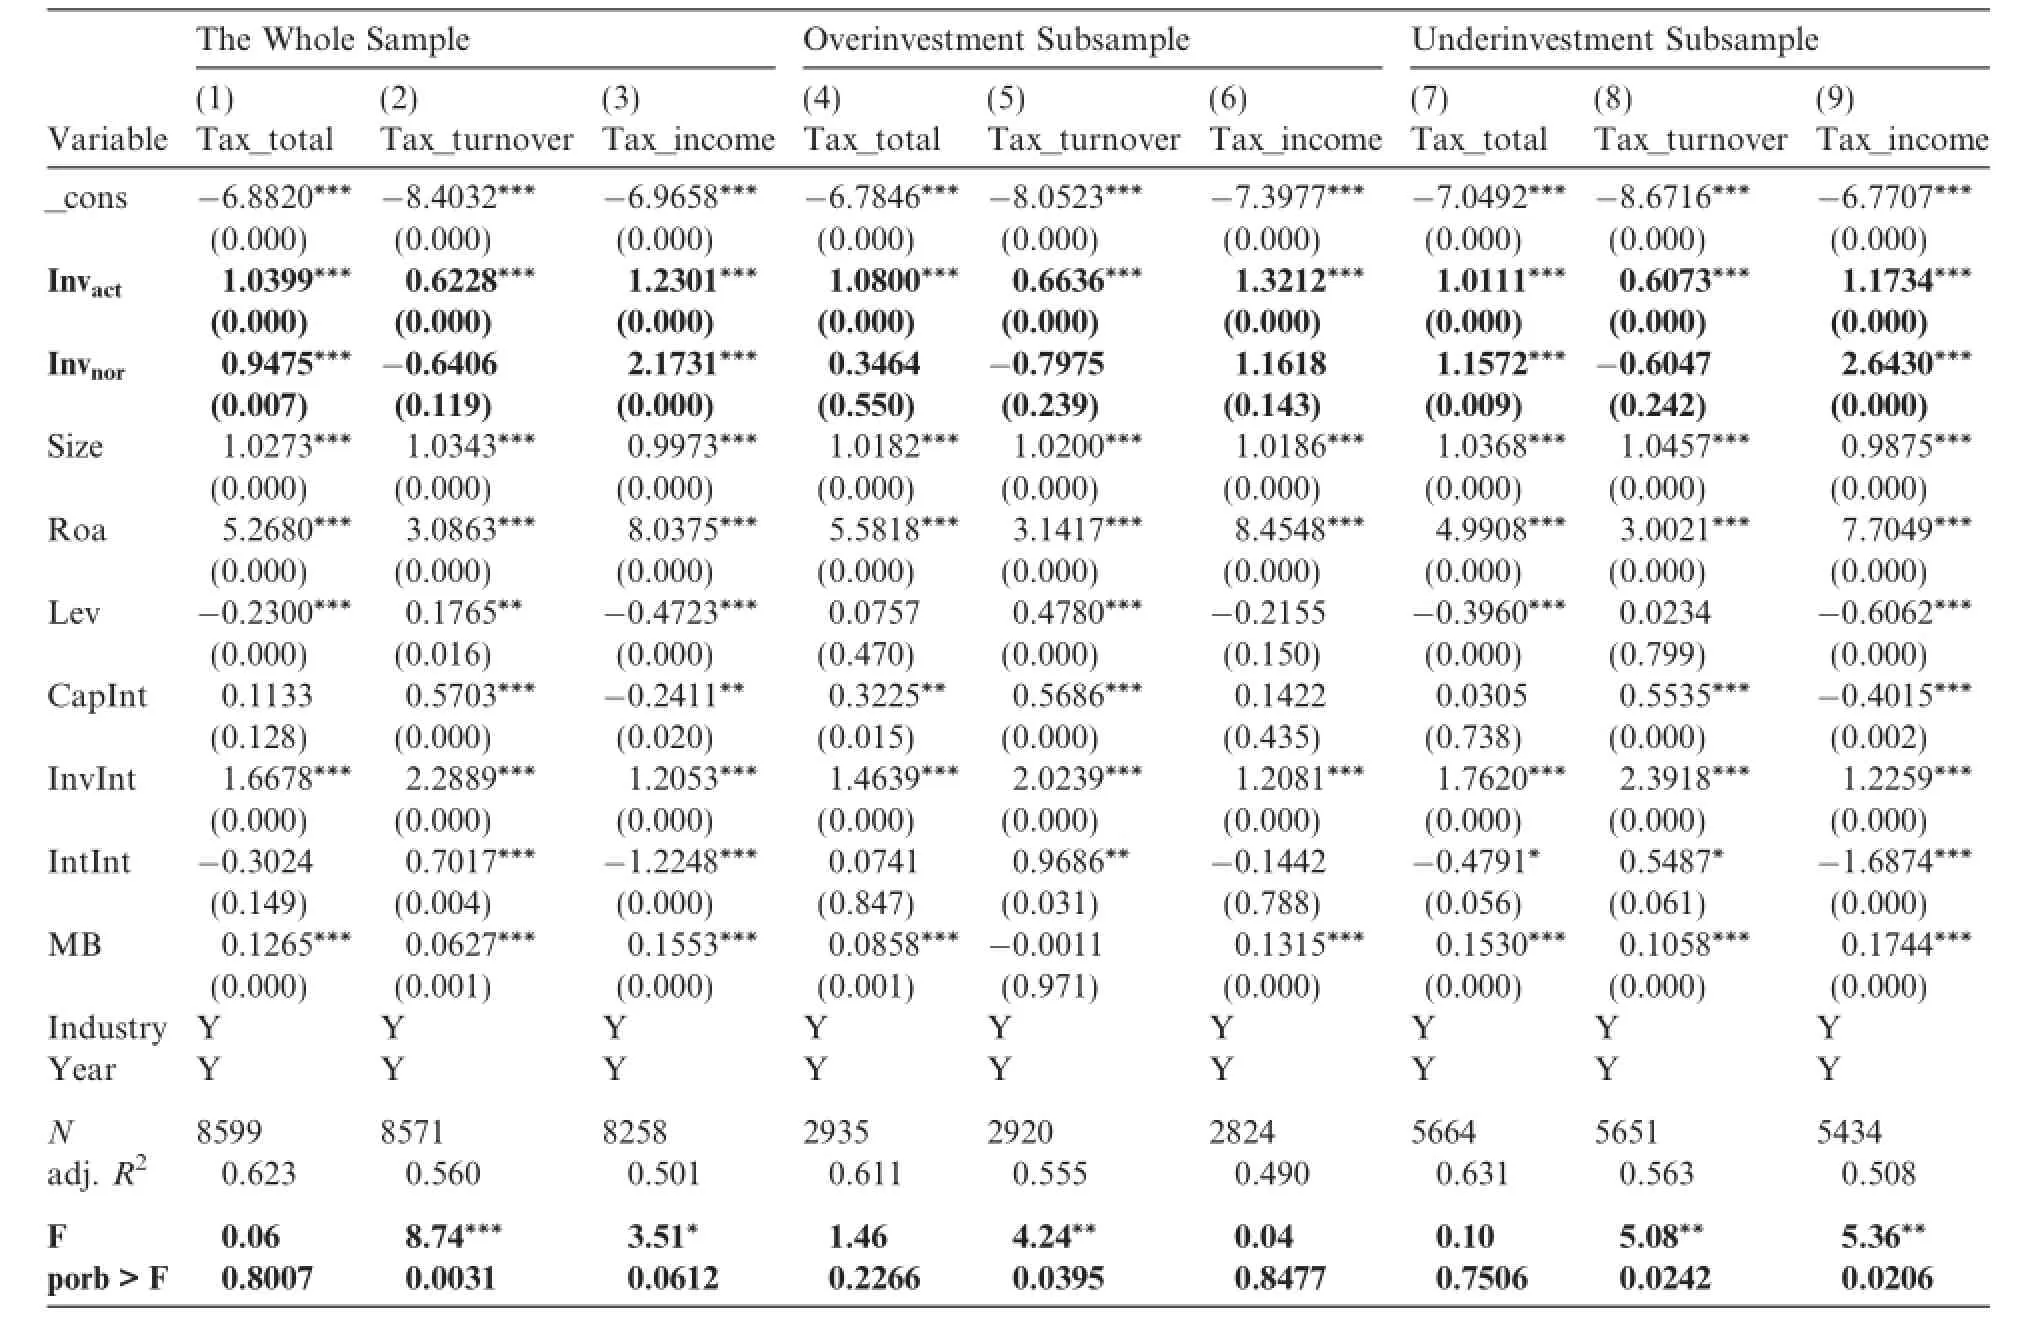
Table 11 D iferences in the Efects of A ctual and N orm al Investm ent Levels on Corporate Taxes Paid(M odel(4.1)).
Raising a f rm’s investment scale increases local f scal revenue by increasing the taxes paid by f rms,and it results in im p roved co rpo rate perform ance.Specif cally,turnover taxes are not af ected by co rpo rate investm ent ef ciency,whereas totaland incom e taxes are greatly af ected by corpo rate investm ent ef ciency.Underinvested f rm s pay m uch fewer incom e taxes than their norm al-level coun terparts,but there is no signif can t diference between the income taxes paid by overinvested f rms and those paid by normal-level invested f rms with the same investment scale.This suggests that local governments should increase their tax revenue by increasing the investment scales of underinvested f rms to normal levels and by helping overinvested f rms adjust their production,operation,and capitalstructures tomatch the present investm ent levelbefore expanding their investment scales.
4.4.Robustness checks
4.4.1.A lternative exp lanation of abundant investment opportunities
In add ition to the po litical in terven tion of localgovernm en ts and political p rom o tion tournam en ts(Zhou, 2004),overinvestm en t in local SOEsm ay also be driven by abundan t investm en t opportunitiesor o ther facto rs unrelated to such intervention o r prom otion.To ru le ou t this alternative exp lanation,we rerun the aboveem pirical tests using the central SOEs subsam p le and present the resu lts in Table A 2 in the Appendix.The results show that alm ost every coef cient o f Distress1,Distress2,Distress1×N_Tax,and Distress2×N_Tax is not statistically signif cant,in either the overinvestment or the underinvestment subsamp les,which is defnitely diferent from the results gained from the local SOEs subsample.
Central SOEsare con fronted w ith the same investment opportunitiesexperienced by local SOEsoperating w ithin the same p rovince,but the form er are alm ost free of local governmental intervention.Therefore,the results in Tab le A 2 ruleout thepossibility that theoverinvestment of local SOEs is driven by abundant investm entopportunitiesor other factorsunrelated to government intervention or po liticalpromotion tournam ents, indirectly enhancing support for theperspective that localgovernmentshave an incentive to boost tax revenue by fo rcing local SOEs to raise their investm ent scalesand to exert greater p ressure on f rm s that contribute less to local f scal revenue.
4.4.2.The probability of reverse causality between dependent and independent variables
Based on thegrabbing hand theory,weassert that localgovernm entshavean incentive to boost tax revenue by forcing the local SOEsunder their control to raise their investment scalesand to exert greater pressure on f rms that contribute less to local f scal revenue.Our assertionsaresupported by the aforementioned empirical results.W e also determ ine from the empirical f ndings in the Further Analysissection(Section 4.3)that a larger investment scale could help to increase fscal revenue by increasing both the incom e and turnover taxes paid by the f rm,which efectively rulesout the potential reverse causality of theoverinvestmentof local SOEs leading to local f scal distress.Finally,we perform Hausm an testson the dependent and two independent variables and getχ2values of 0.00 and 0.05,respectively,and a p-value of 1.0000 fo r each,suggesting that on ly OLS is theoretically needed in this paper.However,in the interestso f robustness,we perform 2SLS robustness checks of the aforem entioned empirical tests.
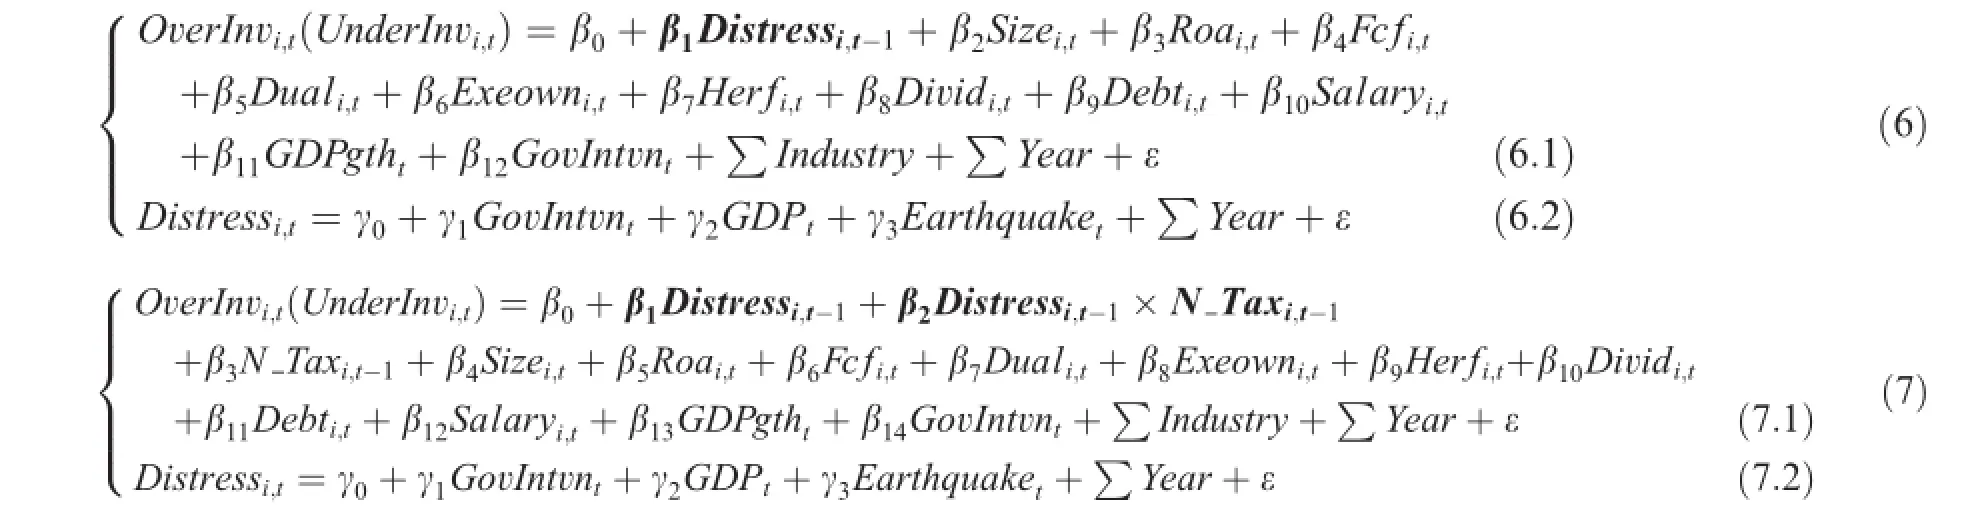
M odels(6)and(7)are the 2SLSmodels.M odels(6.1)and(7.1)are the same as M odels(2)and(3)in Section 3,respectively,and the instrument variab les(IVs)in M odels(6.2)and(7.2)are three provincial-level variab les:the index o f reducing governm en t in terven tion to enterp rises in the Fan Gang m arketization index, the logarithm of the local GDP,and the num ber o f earthquakes in the cu rrent year.W e chose these th ree variab lesas IVs because the localgovernm en tsw ith f scal distress are likely to be thosew ith poor governance and severe intervention into enterp rises;because localgovernmental fnance isgenerally highly correlated w ith localGDP,as the better developed regionsusually have suf cient fscal revenue,w ith low probability of being immersed in f scal distress,and because earthquakes are strongly destructive,infrequent,and unp redictable natural disasters that signif cantly in fuence local fnance.We perform a Pearson correlation analysis on the p roxies o f local fscal distress and the IVs and p resent the results in Tab le 12.
As Table 12 reveals,the two proxieso f local fscaldistress and the three IVsare all signif cantly correlated at the 0.01 level,which satisf es the basic assump tions for IVs.The resu lts of 2SLS for local SOEs are p resented in Table 13.
Table 13 show s that excep t fo r D istress1t-1×N_Taxt-1,the results of 2SLS fo r local SOEs do not d if er greatly from those using OLS(Tables 8–10),suggesting the robustness o f the resu lts.M oreover,the 2SLS results rule out the poten tial reverse causality of the dependen t and independent variables,supporting the grabbing hand theory.Due to length constraints,the 2SLS results for non-SOEs and central SOEs are
p rovided in Tables A 3 and A 4,which are also nonsignif cantly diferen t from those using OLS(Tab les 8–10 and A 2).

Table 12 Correlations o f proxies for local f scal distress and the IVs.

Table 13 Results of 2SLS for local SOEs.
4.4.3.The alternative approach of tax enforcement
Our H 2 argues that governments generate their f scal revenue through taxes and that the incentive to extract from enterprises is stronger in the f rm s that m ake fewer con tributions to local fnance,fo llow ing the grabbing hand theo ry,such that lower taxes paid by local SOEs enhances the positive relationship described by H 1 between local f scal d istress and the overinvestm en t of local SOEs.However,in add ition to the investmentapp roach,localgovernmentscou ld achieve their fnancegoalby enhancing their tax enforcem ent or directly consu lting w ith the enterprises under control.Theoretically,f rms that pay fewer taxes are p robab ly more aggressivewhen it comes to tax avoidance,so enhancing the tax enforcement o f aggressive tax-avoiding f rmsmay be a m ore efective way to generate local f scal revenue than extracting from local SOEs.
Two frequently used proxies for the aggressiveness o f tax avoidance are the Book-Tax dif erence(BTD) (M ills,1998;Desai,2003;W ilson,2009)and the Ef ective Tax Rate(ETR)(Zimmerman,1983;Gupta and Newberry,1997;W ilson,2009).However,tax preferences in China vary,which makes themeasurement comp lex.Som e tax preferences in China are linked to the tax basis,by reducing or exem p ting taxes on f rm s’operating resu lts.For exam p le,R&D expenditures could be additionally deducted o r am o rtized at the 50%level,6See details in The tax law of the People’s Republic of China and Accounting Standards for Business Enterprises.and the production of high-tech enterp rises is exemp t from income taxes in the initial 2 years and must on ly pay half in the initial 8 years.7See details in The tax law of the People’s Republic of China and Accounting Standards for Business Enterprises.Other tax p references are based on tax rates,such as the income tax rate for transitional f rms in special zones and the high-tech enterprise certif cate applicab le tax rate.8See details in The tax law of the People’s Republic of China and Accounting Standards for Business Enterprises.The amount o f tax reduction due to tax p references cannot be totally viewed as the result of tax avoidance because for f rms,the desire for self-development ismore intense than that for tax avoidance,so most tax p references are the side benef tso f business strategies.For example,themain purpose of R&D activities shou ld be innovation demands to increase f rms’p rof tability,not for the tax savings from the additional 50%deduction or amortization.M oreover,someearningsmanagementactivitiesbased on these accounting standardsalso serve the goal of tax deduction(Desai and Dharm apala,2009;Hanlon and Heitzm an,2010).
Based on the above analysis,we construct M odel(8),in which the residual(εi,t)represen ts the aggressiveness of co rpo rate tax avoidance,fo llow ing Desaiand Dharm apala(2006,2009).BTD in M odel(8)represen ts the Book-Tax diference scaled by the 1-year lagged value o f f rm size.TA rep resents total accruals,including the change in(1)Current Assets,(2)Current Liabilities,(3)Cash and Short-Term Investments,and(4)the Level in Depreciation and Amortization,scaled by the 1-year lagged value of f rm size fo llow ing Desaiand Dharmapala(2009).μi,trep resents f rm f xed efects.In addition,we incorporate the level o f R&D Expenditure,also scaled by the1-year lagged value of f rm size,based on China’s institutionalenvironment.Finally,the residual εi,tisdefned as theportion of the Book-Tax diference that cou ld notbe exp lained by corporateearningsmanagement or R&D activities,namely the aggressivenessof tax avoidance(Desaiand Dharmapala,2006,2009), represented by BTD1(see Tab le 14).
In considering robustness,we also m easu re the level of earningsm anagem entw ith the Jonesm odelo f discretionary accruals,deno ting BTD 11,BTD 12,BTD 21,and BTD 22 as the d iscretionary accrualsw ith operating pro f t under the Jonesm odel,net pro f t under the Jonesm odel,operating pro f t under them odifed Jones m odel,and net pro f t under them odifed Jonesm odel,respectively.Panel A in Tab le 14 shows the Pearson correlation matrix of corporate taxes paid and tax avoidance aggressiveness for the samp le between 2002 and 2010,in which Tax_total is calcu lated by the logarithm of corporate total taxes paid,including both income and turnover taxes,and Tax_income is calcu lated by the logarithm of income taxes.
Public f rms in China did not disclose detailed nom inal tax rate and tax preferences in the footnotes to f nancial statements o f their annual reports until 2007,so we calcu late the level of corporate tax avoidance in the 2007–2010 subsample in M odel(9),in which Tax_base is a dummy variable representing the tax p references linked to the tax basis,that takes the value one if there isan exemp tion or reduction in income taxesm entioned in the footnotes to fnancial statem en ts,and zero otherw ise.The other variables are identical to those in M odel(8),and the Pearson co rrelation m atrix of co rpo rate tax paid and tax avoidance aggressiveness is p resented in Panel B of Tab le 14.

Table 14 Pearson correlations of co rporate taxes paid w ith BTD and ETR.

M odels(10)and(11)use the ef ective tax rate(ETR)to measure the level o f tax avoidance.The theory is basically the same as that for M odels(8)and(9),w ith ETR represented by the item Ef ective Tax Rate disclosed in the operating capacity f le of fnancial reports.Speczone is a dummy variab le rep resenting special econom ic zones in China,equal to one if the corporation operates in the fvespecialzonesof Shenzhen,Zhuhai, Shantou,Xiam en,and Hainan,and zero otherw ise.H ightec isa dummy variab le that takes the value of one if the f rm is a high-tech f rm or if it app lies a transitional incom e tax rate o f 25%,and such is stated in the footnotes to fnancial statem ents,and zero otherw ise.Fo r the sam e reasons given fo r the m odels using BTD,we app ly the 2002–2010 and 2007–2010 sam p les to M odels(10)and(11),respectively,w ith the residuals εi,trepresenting the level o f corporate tax avoidance,denoted by ETR1 and ETR2,respectively.The Pearsoncorrelation m atrices of co rpo rate tax paid and tax avoidance aggressiveness are p resented in Panels C and D o f Table 14,respectively.
As Panels A and B o f Tab le 14 show,the BTD modifed by earningsmanagement and tax p references (BTD1 and BTD11–BTD22)or the unmodifed BTD(BTD)is positively related or unrelated to corporate total taxesor income taxespaid,indicating no statistical evidence supporting the pointo f view that f rms that pay fewer taxes exhibitmore aggressive tax avoidance.
In Panels C and D,neither the ETR modif ed by tax p references(ETR1 and ETR2)nor the unmodifed ETR(ETR)are correlated w ith corporate total taxes or income taxes paid,indicating no statistical evidence supporting the point o f view that f rms that pay fewer taxes exhibitmore aggressive tax avoidance.
The resu lts from Panels A–D provide no evidence to suppo rt the point o f view that f rm s that pay fewer taxes exhibit m ore aggressive tax avoidance,furthering the assertion that governm en ts increase tax revenue by enhancing their tax en forcem ent on the f rm s that pay fewer taxes,which indirectly supports H 2.
4.4.4.Themediation of free cash fow
Jensen(1986)argues that high free cash fow triggers agency problems that resu lt in overinvestment,but this p rob lem cou ld bem itigated by raising debt,which reduces f rms’free cash fow–an argument supported by Tang et al.(2007).W eiand Liu(2007)and Tang etal.(2007)indirectly determ ine the positive relationship between corporate free cash fow and overinvestment by exam ining how cash dividends restrain the level o f overinvestment.Therefore,to ru le out the potential exp lanation that f rms that pay fewer taxes are generally faced w ith the prob lem of overinvestm ent in response to their high free cash f ow p reserved in the f rm due to tax saving activities,we scale to tal taxes paid(the sum o f Income Tax Expense and Business Tax and Surcharges on the incom e statem ent)w ith to talassets,deno te co rpo rate tax intensity and rerun the em pirical tests in Table 9 w ith corporate tax intensity,rep resented by N_Tax I,instead of corporate taxes paid.The results p resented in Table A 5 show that none o f the coef cients for the interaction terms of Distress1×N_Tax I and Distress2×N_Tax I and for N_Tax I are statistically signif cant,suggesting that corporate tax intensity has no efect on f rms’overinvestment.Combined w ith the resu lts in Table 9,our f ndings suggest that the positive efect that low corporate taxespaid hason the relationship between local fscaldistressand corporate overinvestment is triggered by the po litical intervention of localgovernments,thus ru ling out the possibility o f a mediating efect through free cash fow.
4.4.5.An alternative explanation for H 2–the helping hand theory
W e have a po tential com peting theo ry fo r H 2–the help ing hand theory.Local governm en ts and local SOEs have innum erable links through funds and personnel issues,and local governm ents alw ays have a tendency to p rotect and support the local SOEs under their contro l,which is generally called paternalism(Hu, 2001).Localgovernmentsmay o fer a helping hand by serving asan invisible underw riter to help local SOEs lessen fnancing constraintswhen app lying for bank loans(Zhu and Li,2008)or by seeking investment projects for local SOEs to help them out o f dilemmas prompted by operational or fnancial problems,which results in overinvestm ent by local SOEs.The f rms w ith low operating and fnancial performance generally have low pro f tability,w ith both low turnover taxes based on corporate operations and low income taxes based on pro f ts,indicating their lim ited contribution to local fnance.
While such governm ental helping hands can decrease fnancing constraints in the loan application process o r discover investm ent pro jects fo r local SOEs,the latter(discovering investm ent p rojects for local SOEs)is d if cult to observe.However,both activities should exist sim ultaneously in cap italm arkets and satisfy a certain d istribu tion thatw illallow us to deduce the existence or even the intensity of governm ental helping hands by observing theactivitiesof the former(decreasing fnancing constraints in local SOEs’loan application process).Given theubiquitous so ftbudget constraintsof local SOEs,banks’requirements for accounting conservatism on SOEs aremuch lower than those for non-SOEs,which is clearly a refection o f the government’s helping hand.Another type of so ft budget constraint is for governments to serve as invisib le underw riters by helping SOEs to lessen their fnancing constraintswhen app lying for bank loans.Consequently,fo llow ing Basu(1997),we constructamodelof accounting conservatism to help ru leout the competitiveexplanation o f paternalism by investigating the ef ect of 1-year lagged valueso f corporate taxes paid on banks’requirements for accounting conservatism.
M odel(12)is them odelconstructed by Basu(1997),w ith EPSitasa f rm’searnings per share in year t,Pit-1as thestock closing p rice in year t-1,Retitas theannualstock returns in year tand Dritasa dummy variable, that takes the value of one if Retit<0,and zero otherw ise.The coef cient o f Retit×Drit,β3,determ ines the extent o f accounting conservatism.

M odels(13)–(15)m easu re the ef ects o f the interactions of other variablesw ith corporate accounting conservatism by incorpo rating in teraction term s into Basu’s(1997)basicm odel.M odel(13)adds the in teractions of corporate liability levels Ntand other variables in year t on the basis of M odel(12),representing the total debt-to-asset ratio Lev,the ratio of long-term debt on total assets Ldebt and the ratio of short-term debt on total assets Sdebt,respectively.Hence,the coef cient o f Rett×Drt×Nt,β7represents the ef ect o f corporate capital structure on accounting conservatism.
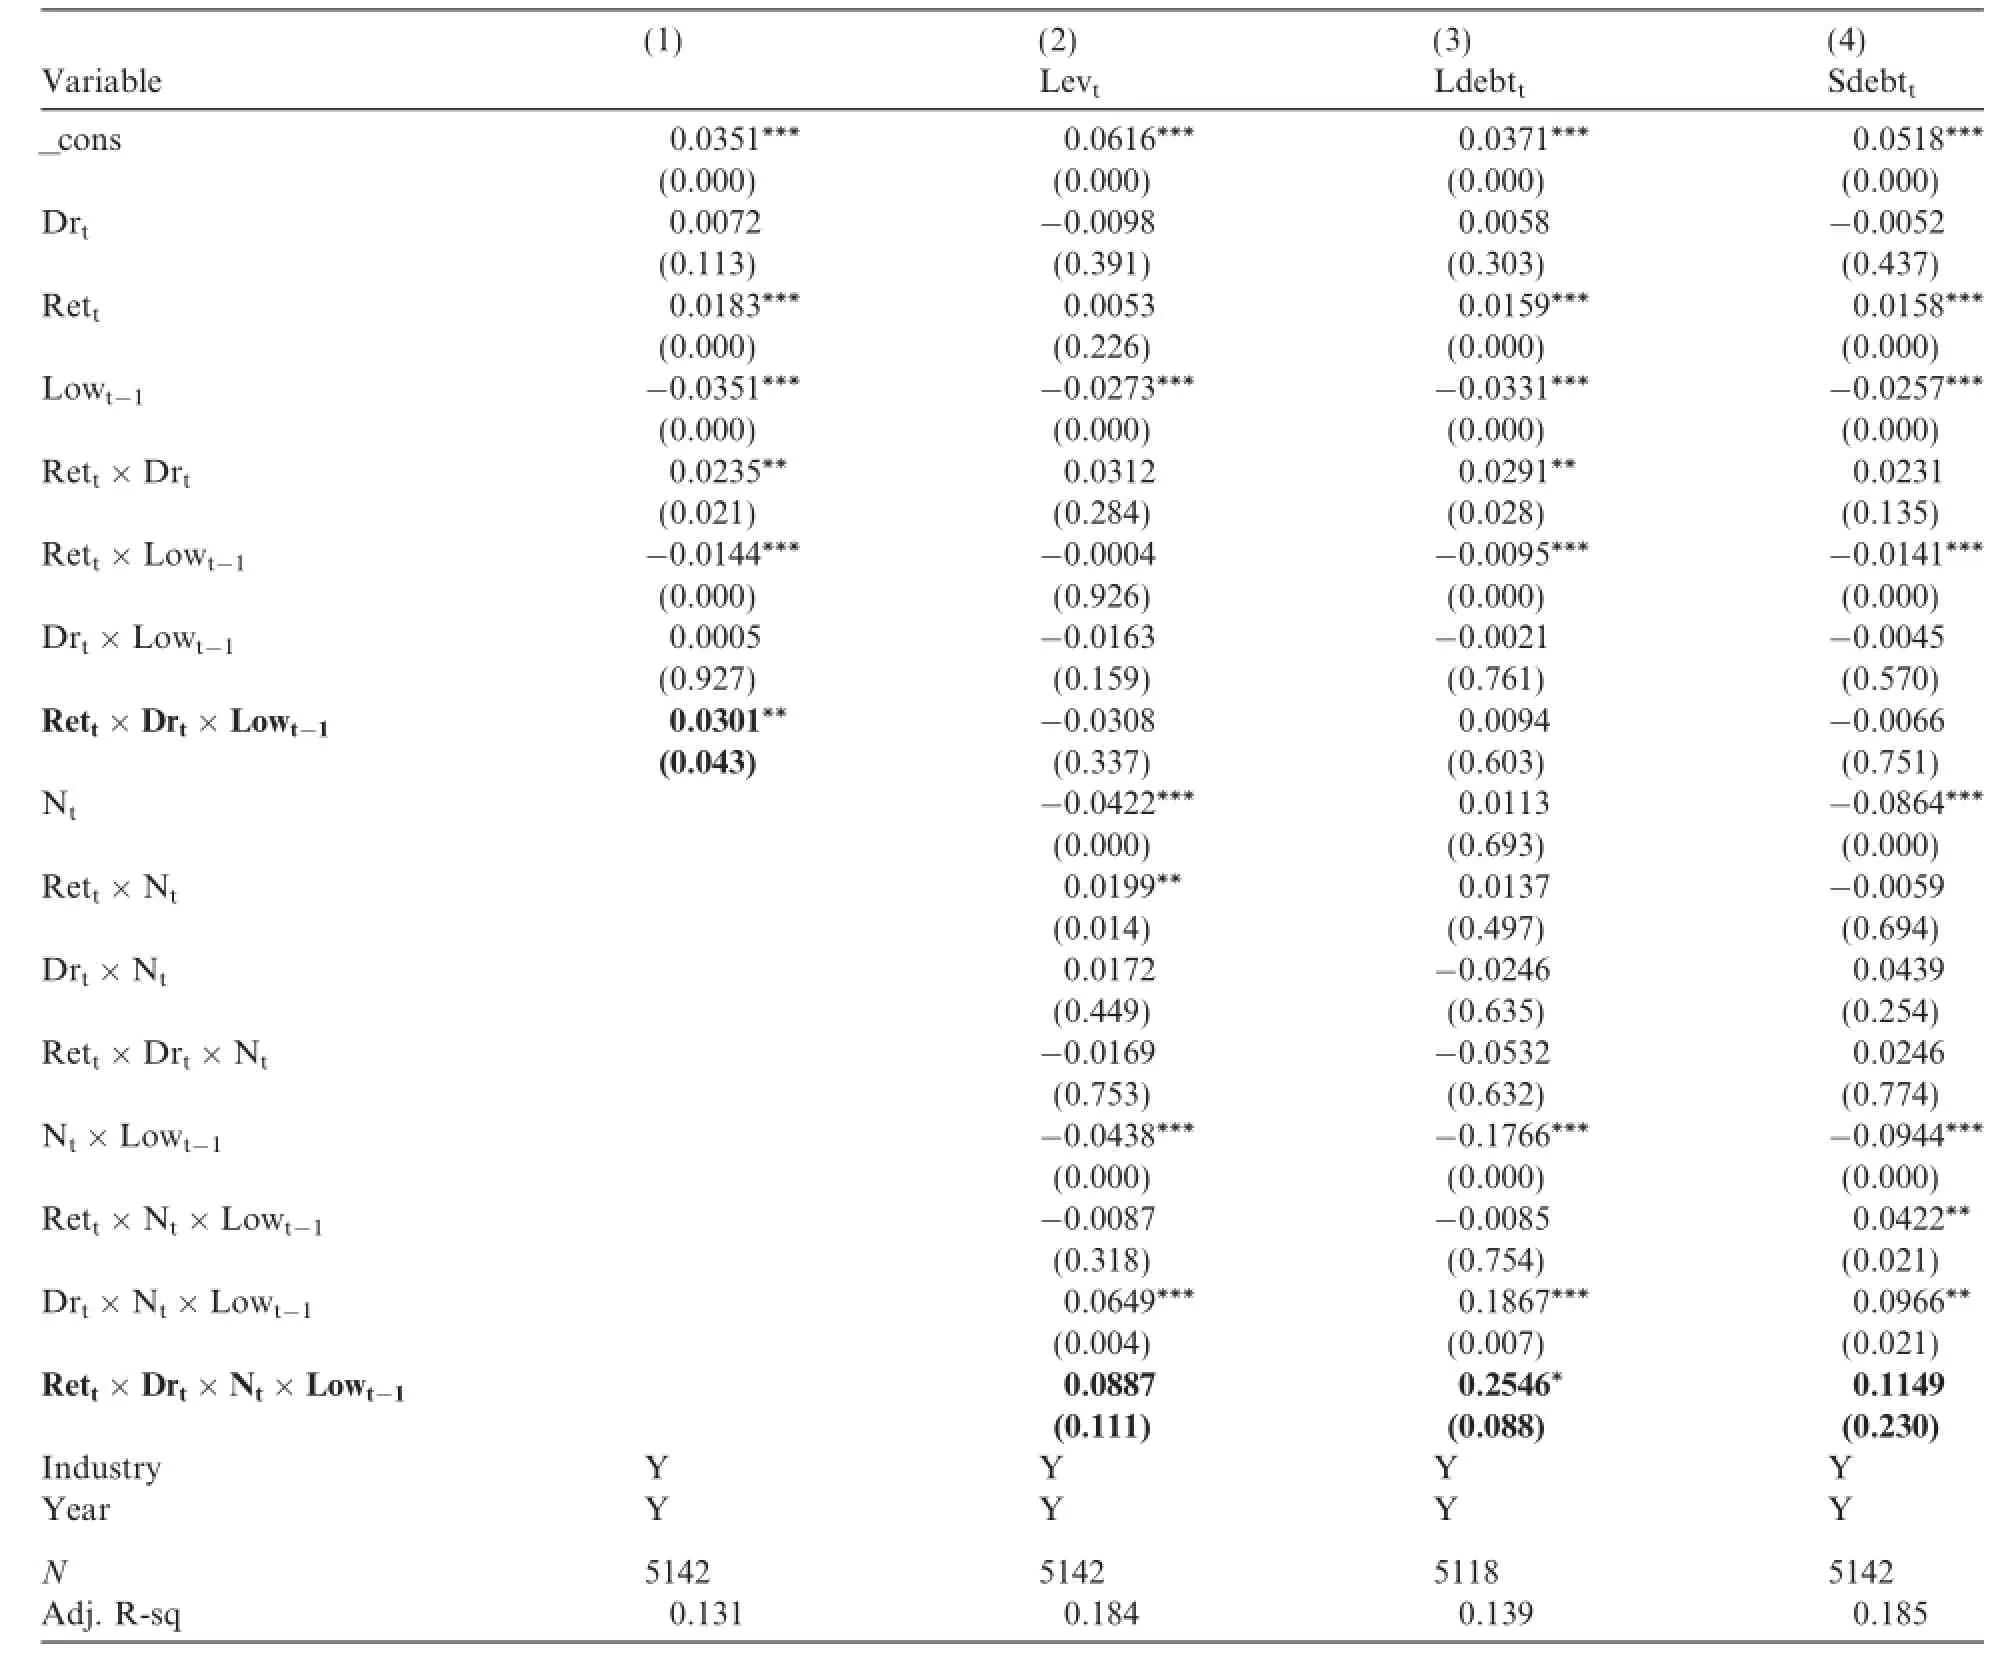
Table 15 Corporate tax paymen t,capital structure and accounting conservatism for local SOEs.

M odel(14)adds the interactionsof a low levelof co rpo rate taxes paid and o ther variab les to M odel(12),in which Lowt-1is a dumm y variable that takes the value o f one if the taxes paid by the f rm in year t-1 are lower than them ed ian value o f the to tal SOE subsam p le in the corresponding year,and zero o therw ise.Thus, the coef cient o f Rett×Drt×Lowt-1,β7rep resents the efect of low corporate taxes paid on accounting conservatism.
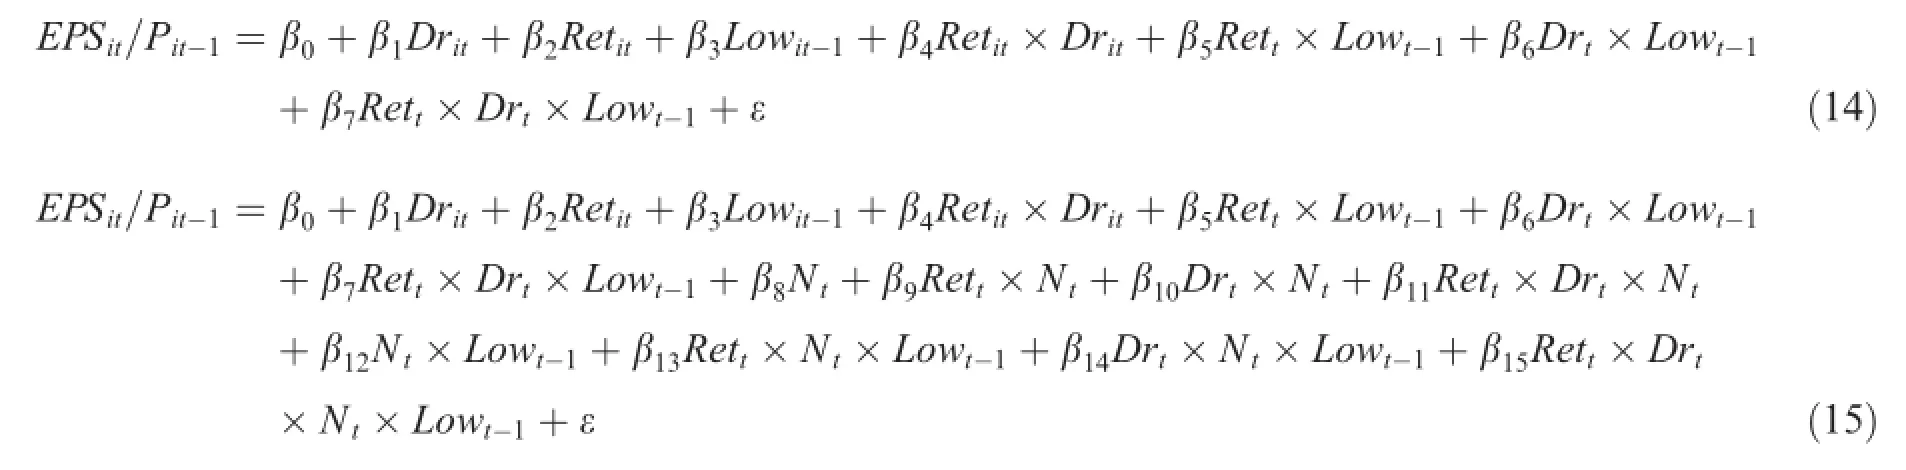
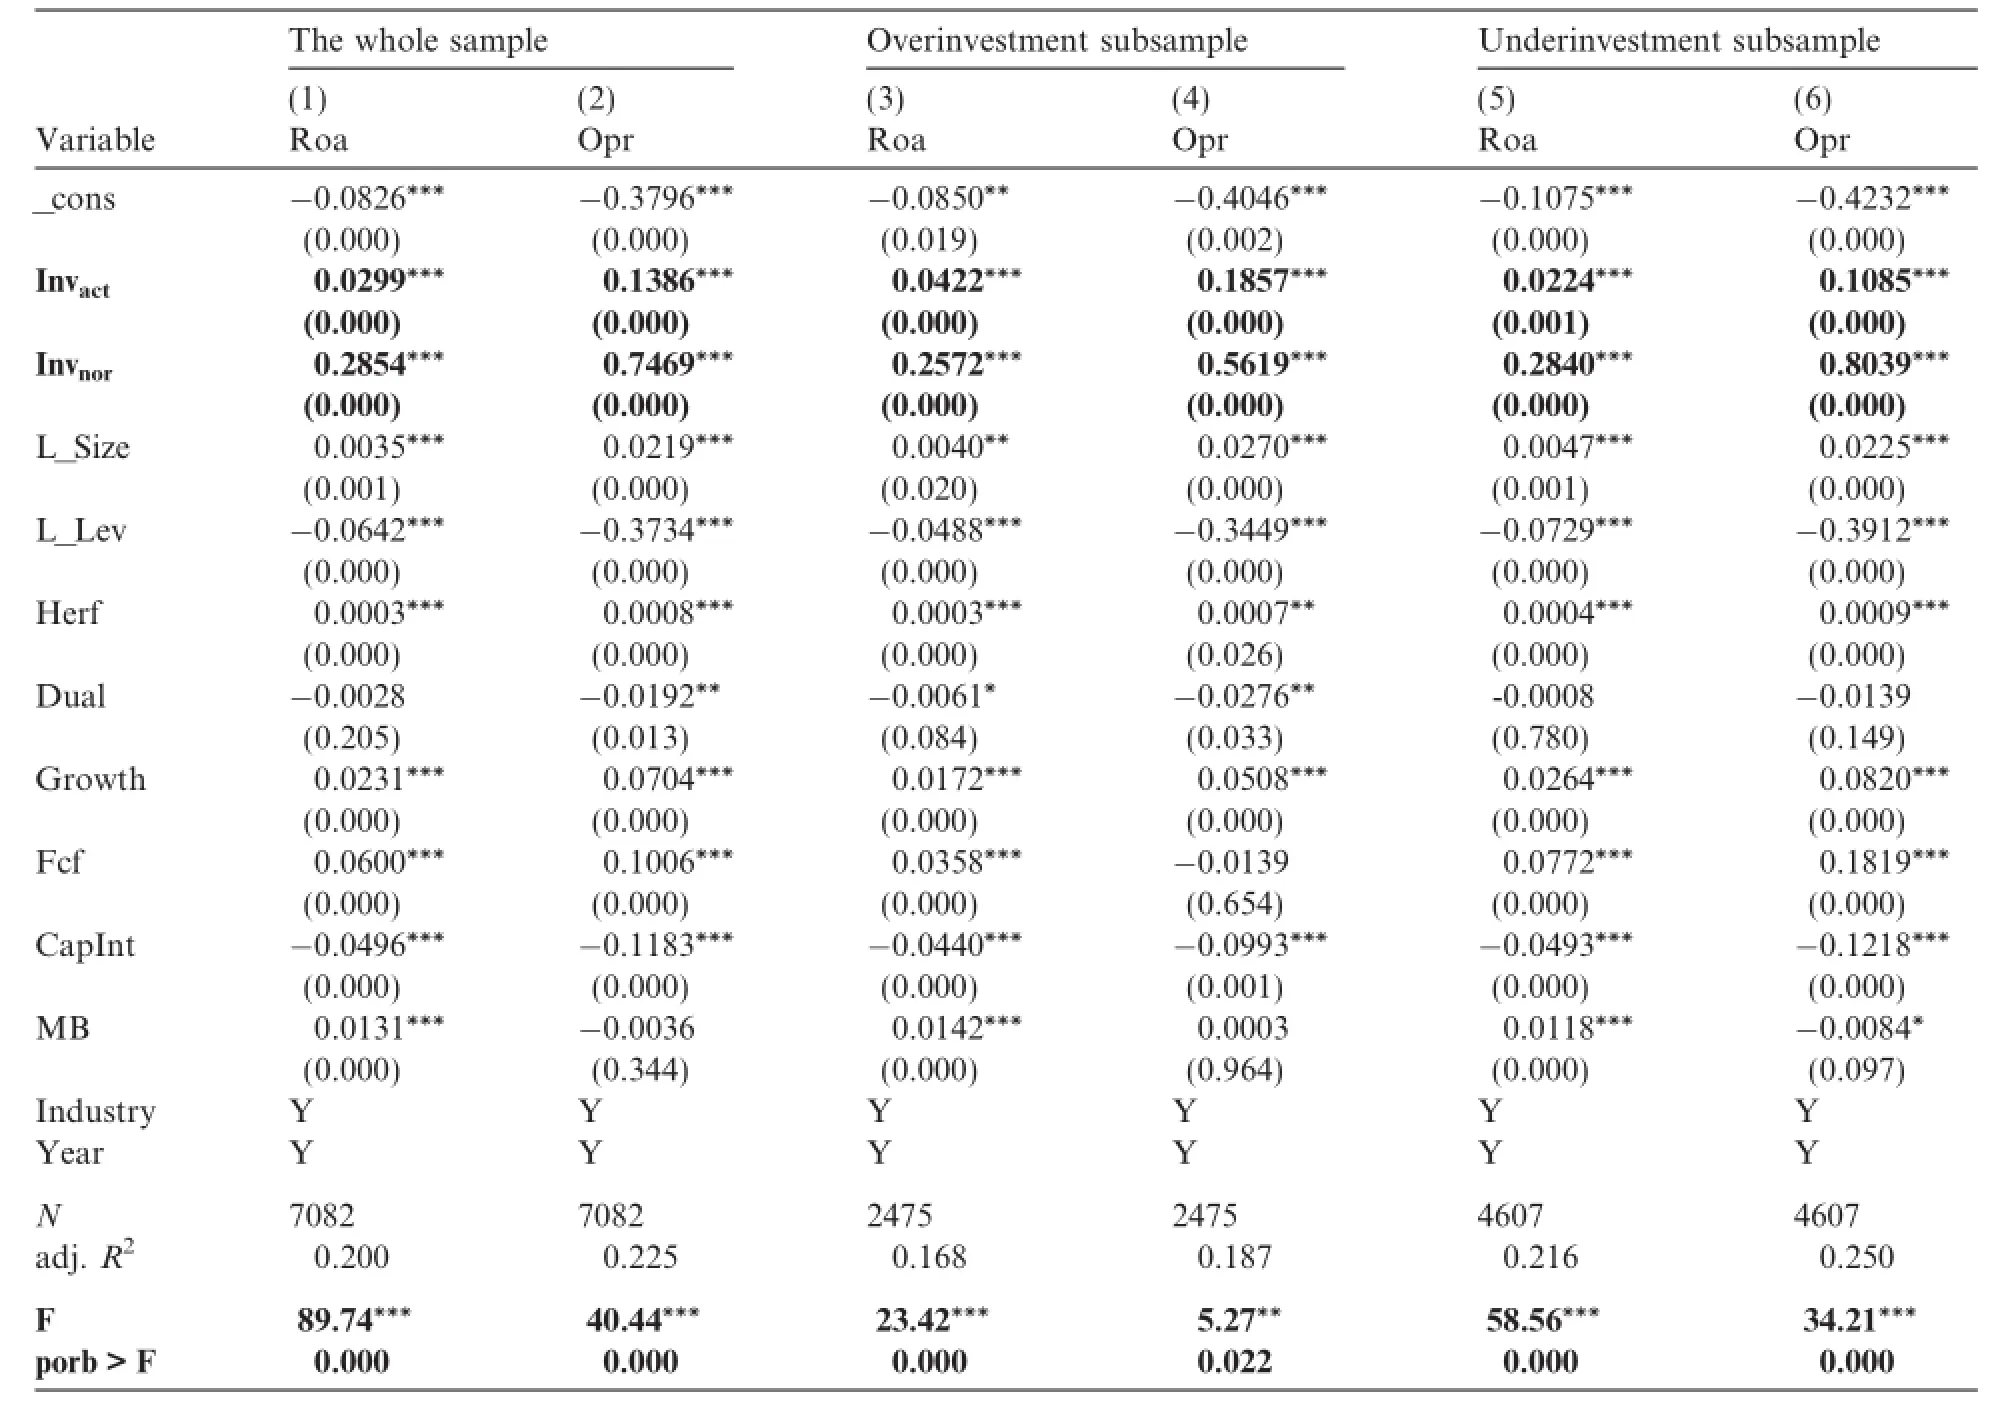
Table A 1 D iferences in the efects of actual and normal investmen t levels on corporate perform ance(M odel(5.1)).

Table A 2 Local f scal distress,corporate overinvestm ent and the efect of corporate taxes paid fo r central SOEs.
M odel(15)adds the in teractions o f Lowt-1and other variables to M odel(13),so the coef cient o f Rett×D rt×Nt×Lowt-1,β15rep resen ts the efect of low co rporate taxes paid on the relationship between corporate capital structure and accounting conservatism.
The resu lts for the efect of low corporate taxespaid on the relationship between corporate capitalstructure and accounting conservatism are p resented in Tab le 15 and reveal that the coef cient of Rett×Drt×Lowt-1in column(1)ispositiveand statistically signif cant,indicating thatbanks raise their requirements for accounting conservatism on those localSOEsw ith low operating and fnancialperformance.Ntin co lumns(2),(3)and (4),respectively,rep resents Levt,Ldebttand Sdebtt,in which the coef cients o f Rett×Drt×Nt×Lowt-1in columns(2)and(4)are positive,but statistically insignif cantwhile that in co lumn(3)issignif cantly positive, indicating that the low taxespaid by local SOEshaveno efect on the relationship between total liabilitiesand short-term deb t and accounting conservatism.They do,however,raise banks’requirem ents fo r the accountingconservatism o f local SOEson long-term debt.In summary,the results suggest that there isno evidence that banks lessen their requirem en ts fo r accounting conservatism on local SOEs w ith low operating and f nancial perform ance.Local governm ents never o fer a helping hand on this issue,thus ruling ou t the possibility that the paternalism o f localgovernm ents po litically in tervenes in the investm en t activities of local SOEs,resu lting in a greater extent of overinvestment for those SOEsw ith lower taxes paid.
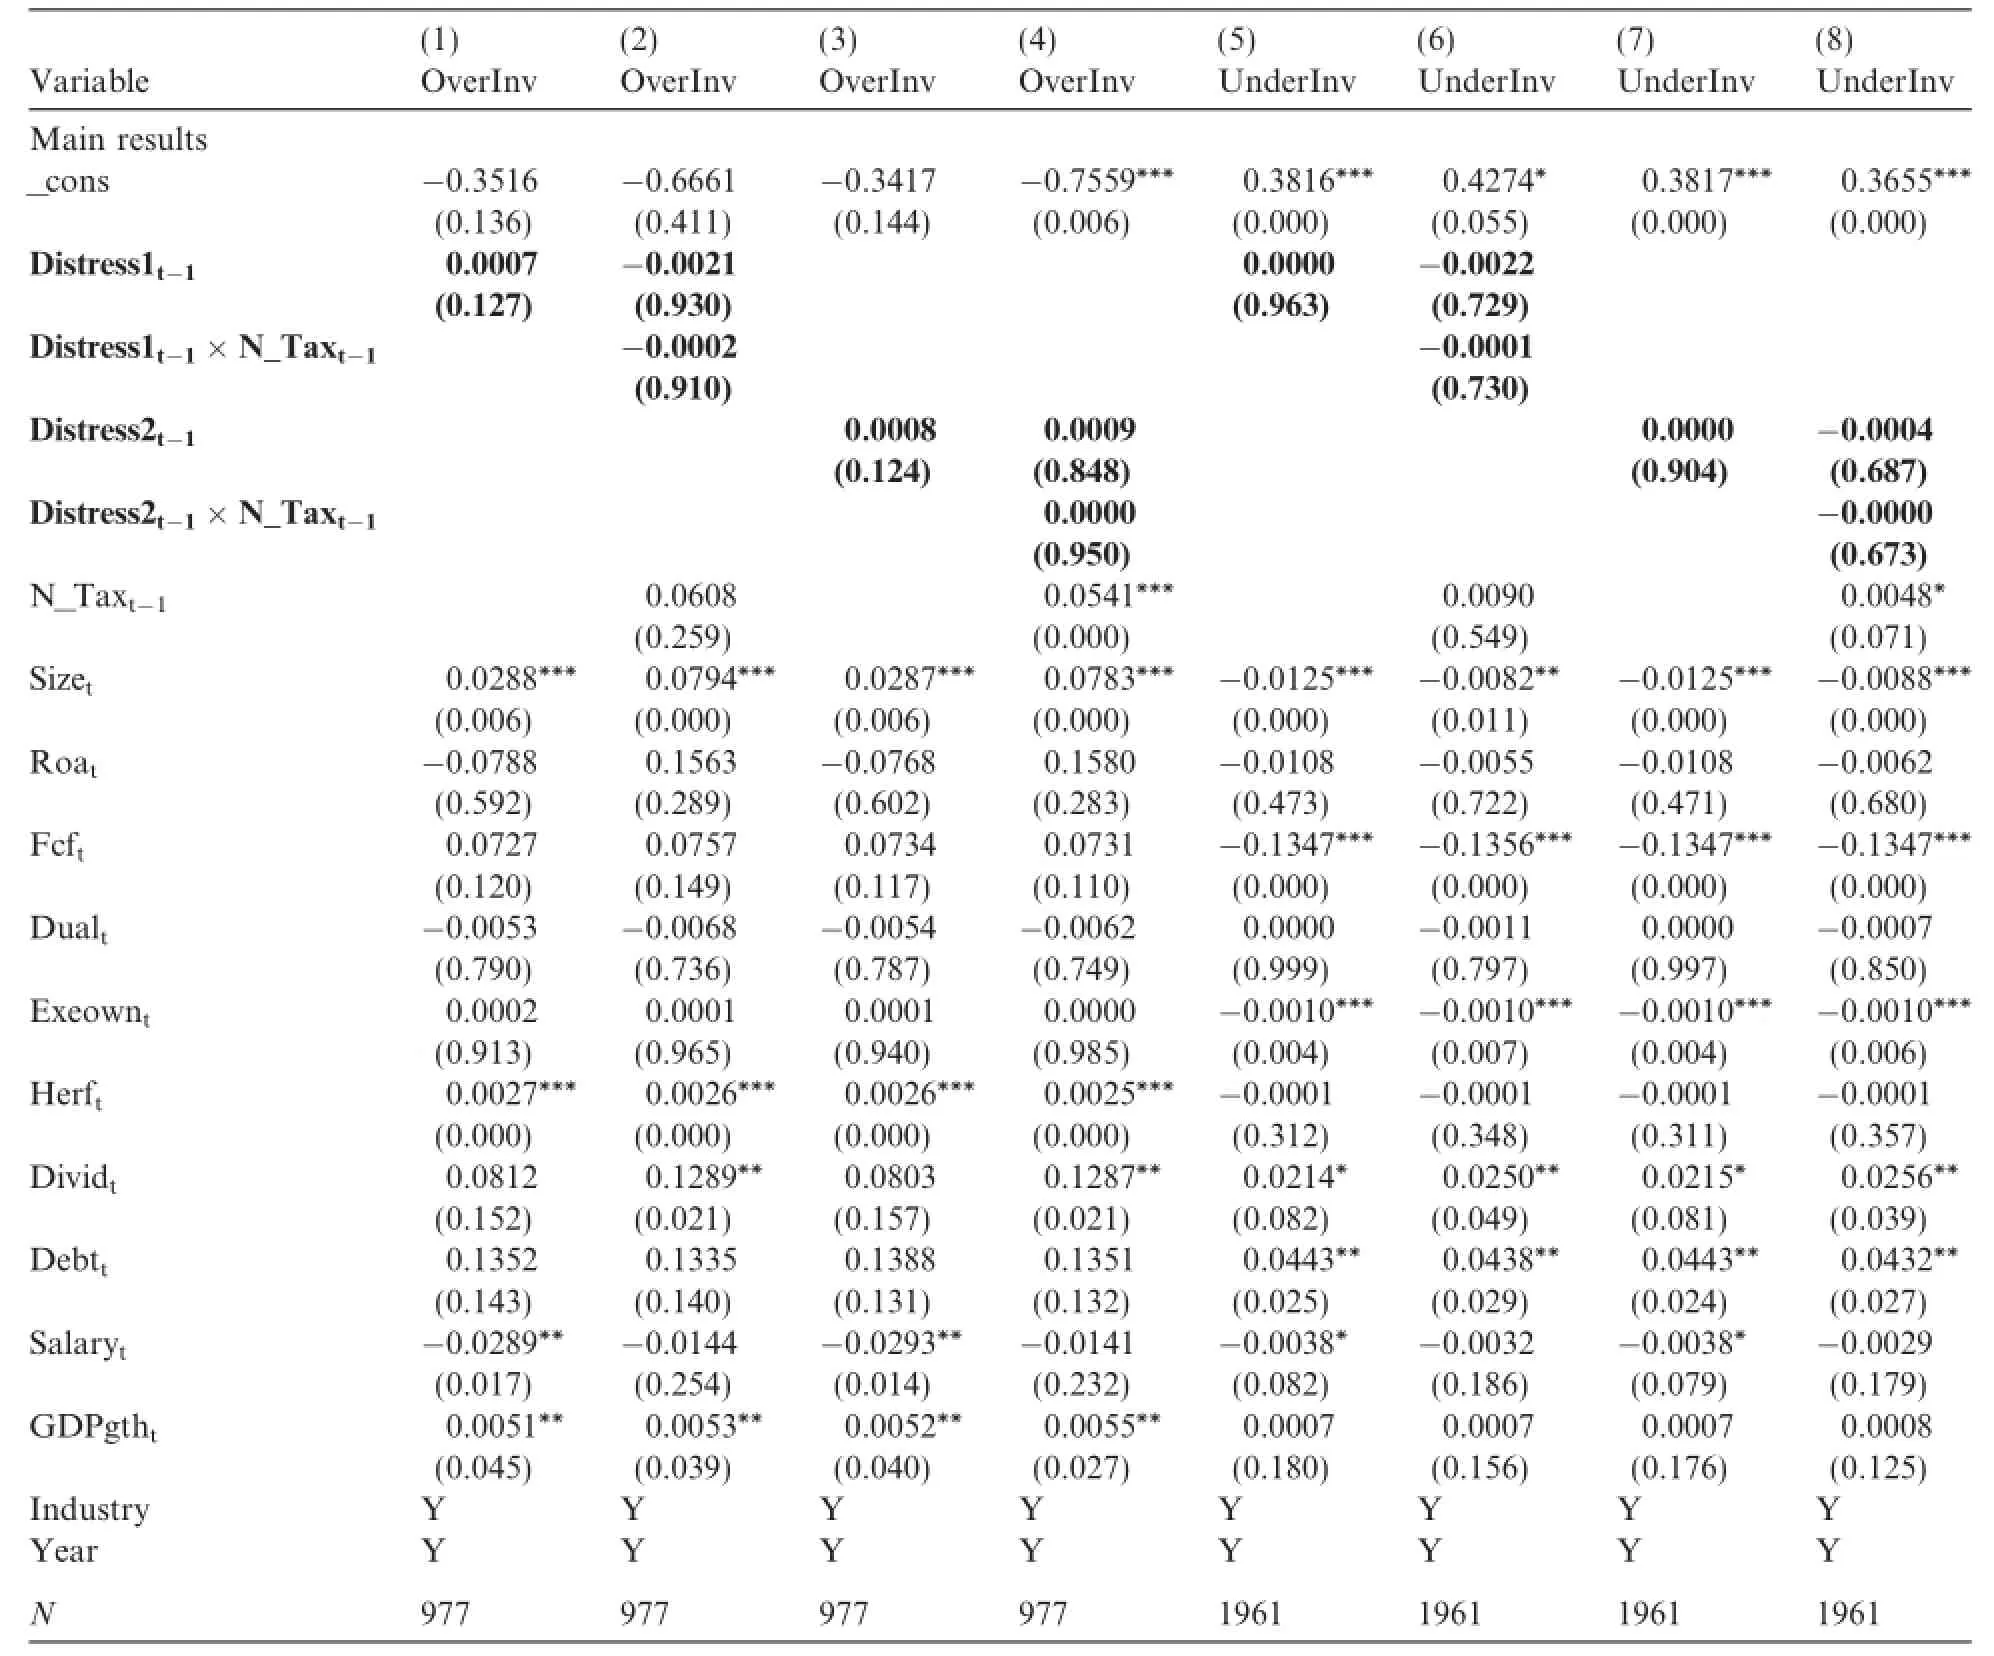
Table A 3 Results of 2SLS for non-SOEs.
4.4.6.Systematic errors of the overinvestmentmodel
Given the systematic errorsof theoverinvestmentmodel,theremust be a diferent p redicted value from the corresponding observed value,and no t all gaps between these two values are necessarily overinvestm en t o r underinvestm ent,so we select the observations that are larger than the ten th percen tile of OverInvi,t,and UnderInvi,tto be ou r research sam p le and obtain the above em p irical results.To determ ine the robustness o f ou r sam p le selection procedu re,we(1)expand the sam p le to include thewho le sam p lew ith no percentile selectionand(2)shrink it to include on ly observations that are larger than the twenty-f fth percentileo f OverInvi,t,and UnderInvi,t.W e rerun the p revious em p irical tests w ith these two sam p les and fnd that the resu lts are consistent w ith those in Tables 8–10,ru ling ou t the possibility o f bias induced by the sam p le selection p rocedure.
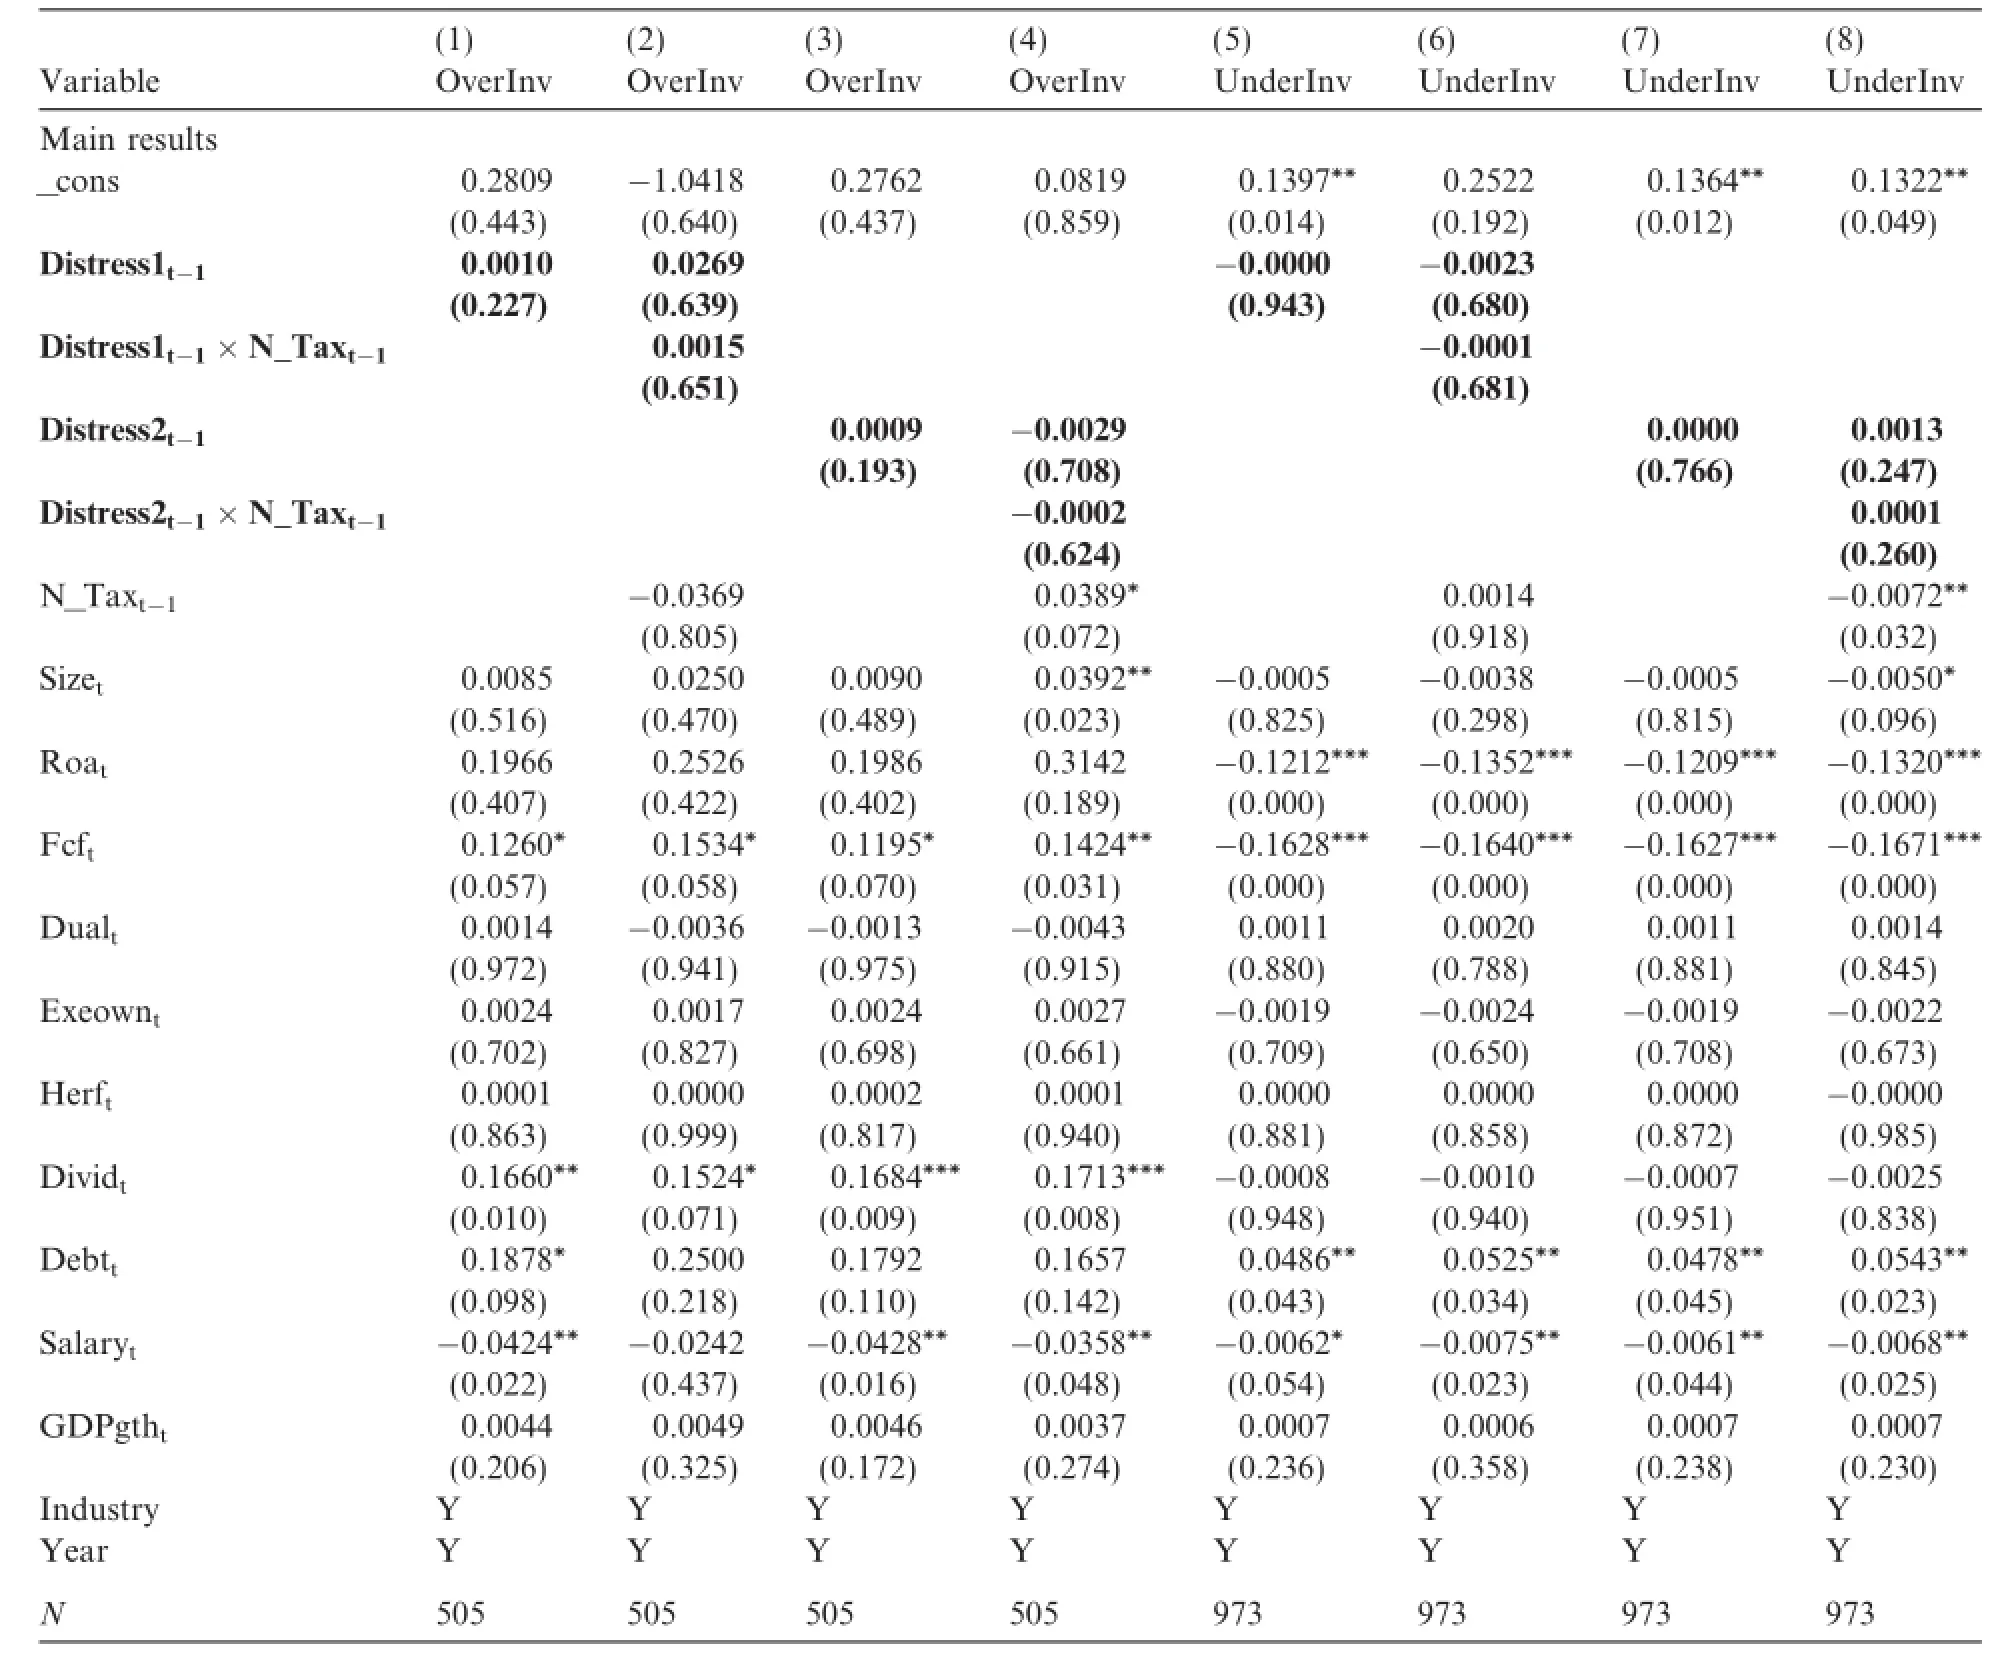
Table A 4 Results of 2SLS for cen tral SOEs.
5.Conclusion
Our empirical tests and robustness checks support the follow ing conclusions.The extent o f local SOEs overinvestment(underinvestment)is positively(negatively)related to the level o f local fscal distress,and the positive(negative)relationship isenhanced when fewer taxesare paid by local SOEs.There is no evidence that the investm en t behavio r of non-SOEs o r central SOEs is related to local fnance or co rporate taxes paid, w ith the resu lts fo r non-SOEs dem onstrating the existence of po litical in terven tion and the resu lts o f cen tral SOEs ruling ou t the possibility of abundant investm en t opportunities.Increasing f rm s’investm ent scalescould help to increase the total taxes paid,including both income and turnover taxes,further resulting in higher local f scal revenue.Turnover taxes paid by f rm s are no t af ected by co rporate investm ent ef ciency and the incom e taxes paid by underinvested f rm sarem uch lower than those paid by their no rm al-level counterparts.Local governm ents shou ld increase their tax revenue by increasing the investm ent scales of underinvested f rms tomeet the normal levelsand by helping overinvested f rms to adjust their production,operation and capital structures to match the present investment level before expanding their investment scale.The empirical results suggest that local governments could achieve the goal of raising fscal revenue by increasing the investment scaleso f local SOEs,which directly results in an increase in total taxespaid.Hausm an testsand 2SLSw ith IVsalso exclude the possibility that the overinvestment of local SOEs leads to local f scal distress. There isno evidence supporting the assertion that local governm ents increase their tax revenue by enhancing their tax enforcement on f rmswho pay fewer taxes,thus indirectly supporting the hypothesis that local governments increase their tax revenue by forcing f rms paying lower taxes to raise their investment scales.There
is no evidence that the tax intensity of local SOEs o r non-SOEs in fuences the relationship between corporate overinvestmentand local f nance,thus ru ling out thepossibility that overinvestment induced by a dif erence in the amount o f tax payment ismediated by changes in free cash f ow.There is no evidence that governmental helping hands play a ro le in helping SOEsw ith low operating and f nance performance,thus ruling out the possibility that local governments o fer a helping hand by serving as an invisible underw riter to help local SOEs lessen fnancing constraintswhen app lying for bank loans or by seeking investment pro jects for local SOEs.This also indirectly verifes that the intensifying efect of the lower contribution made by local SOEs to the positive relationship between local fscal distress and the overinvestment o f local SOEs is due to the political intervention of a local governmental grabbing hand.

Table A 5 E fect of corpo rate tax in tensity on local f scal distress and corporate overinvestment.
Above all,we conclude that local governm ents have an incen tive to increase f scal revenuewhen faced w ith fnancial d istress,by forcing the local SOEs under their con trol to raise their investm ent scales,resulting in either overinvestm en t or lowering the level o f underinvestm ent due to o ther reasons.Likew ise,the incen tive and efect o f such intervention appear to be stronger on f rms that contribute less to local f nance.
This study enriches the literature on government intervention and investment ef ciency,providing empirical evidence o f the grabbing hand theory through the perspectives o f local public fnance and enterp rise investment,in addition to a new research perspective to apply to the problems of f scal issues from the f rm-level view.In p ractice,we discover a relationship between local public f nance and the investmentbehavior o f local SOEs,and provide theoretical basesand references for theways in which local governm entsmake fscal policies and improve the supervisory roles they have over local SOEs.
AppendixA
See Tab les A 1–A 5.
Aggarwal,R.K.,Samw ick,A.A.,2006.Em pire-buildersand shirkers:investment,f rm performance,andmanagerial incentives.Journalof Corporate Finance 12,489–515.
Basu,S.,1997.The conservatism princip le and the asymm etric tim eliness of earnings.Journal of A ccounting and Econom ics 24,3–37.
Berle,A.A.,M eans,G.C.,1932.The M odern Corporation and Private Property.M acM illan,New York,NY.
Brennan,G.,Buchanan,J.M.,1980.The Power to Tax:Analytical Foundations of a Fiscal Constitution.Cambridge University Press, Cambridge.
Chen,D.H.,Shen,Y.J.,X in,F.,Zhang,T.Q.,2012.Overem p loym ent,executive pay-for-perform ance sensitivity and econom ic consequences:evidence from China.China Journal of Accounting Research 5(1),1–26.
Chen,S.,Sun,Z.,Tang,S.,Wu,D.,2011.Government intervention and investmentef ciency:evidence from China.Journalof Corporate Finance 17,259–271.
Cheng,Z.M.,X ia,X.P.,Yu,M.G.,2008.Governm ent intervention,pyram id structureand investmento f local SOEs.M anagementW orld 9,37–47.
Cheung,Y.L.,Rau,R.,Stouraitis,A.,2008.The Helping Hand,the Lazy Hand,or the Grabbing Hand?Centralvs.Local Government Shareholders in Pub licly Listed Firm s in China.W o rking Paper.City U niversity o f Hong K ong and Purdue Un iversity.
Dahiya,S.,Saunders,A.,Srin ivasan,A.,2003.Financial distress and bank lending relationships.The Journalof Finance58(1),375–399.
Derashid,C.,Zhang,H.,2003.Efective tax ratesand the“industrialpolicy”hypothesis:evidence from M alaysia.Journalof International Accounting,Auditing and Taxation 12,45–62.
Desai,M.A.,2003.The D ivergence between Book Income and Tax Incom e,Tax Policy and the Economy,vol.17.M IT press.
Desai,A.M.,Dharm apala,D.,2006.Corporate tax avoidance and high-powered incentives.Journalof Financial Econom ics 79,145–179.
Desai,M.,Dharmapala,D.,2009.Corporate tax avoidanceand f rm value.American Law&Econom icsAssociation AnnualM eetings,1–32.
Fazzari,S.M.,Hubbard,R.G.,Petersen,B.C.,1988.Financing constraints and corporate investment.Brookings Papers on Economic A ctivity 1,141–195.
Feltenstein,A.,Iwata,S.,2005.Decentralization and macroeconomic performance in China:regionalautonomy has its costs.Journalof Development Econom ics 76,481–501.
Frye,T.,Sh leifer,A.,1997.The invisible hand and the grabbing hand.American Economic Review 87,354–358.
Gupta,S.,N ewberry,K.,1997.D eterm inants of the variability in corporate efective tax rate:evidence from longitudinal data.Jou rnalof Accounting and Pub lic Policy 16,1–39.
Hanlon,M.,Heitzman,S.,2010.A review of tax research.Journal of Accounting and Econom ics 50,127–178.
Hu,S.D.,2001.TheRelationship between theCentraland LocalGovernment:Research on China’sFiscalSystem Change.ShanghaiJoint Publishing,Shanghai Peop le’s Pub lishing H ouse,Shanghai.
Jensen,M.C.,M eck ling,W.H.,1976.Theory of the f rm:m anagerialbehavior,agency costs,and ownership structure.Jou rnalof Financial Econom ics 3,305–360.
Jensen,M.C.,1986.Agency costs of free cash fow,corporate fnance,and takeovers.American Econom ic Review 76,323–329.
Jian,M.,Wong,T.J.,2010.Propping through related party transactions.Review of Accounting Studies 15,70–105.
Jiang,F.X.,Y i,Z.H.,Su,F.,H uang,L.,2009.Adm inistrators background characteristics and Enterprise over-investmen t behavior. M anagem entW o rld 1,130–139.
Jin,H.,Qian,Y.,W eingast,B.R.,2005.Regional decentralization and fscal incentives:federalism,Chinese style.Journal o f Public Econom ics 89,1719–1742.
La Porta,R.,Lopez de Silanes,F.,Shleifer,A.,1999.Corporate ownership around thewo rld.Journal of Finance 54,471–518.
Liao,G.M.,Chen,Y.,2007.Government ownership,co rporate characteristics and corpo rate perform ance in distress.A ccoun ting Research 3,33–41.
Li,H.,Zhou,L.,2005.Political turnover and econom ic performance:the incentive role o f personnel control in China.Journal of Public Econom ics 89,1743–1762.
M almend ler,U.,Tate,G.,2005.CEO overcon f dence and co rporate investm ent.The Journal of Finance 6,2661–2700.
M ills,L.F.,1998.Book-tax dif erences and internal revenue service ad justments.Journalo f Accounting Research 36(2),343–356.
M odigliani,F.,M iller,M.,1958.The costof capital,corporation fnance and the theory of investment.American Econom ic Review 48, 261–297.
M ontinola,G.,Qian,Y.,W eingast,B.,1995.Federalism,Chinese style:the political basis for econom ic success in China.W orld Politics 48,50–81.
M yers,S.,1977.Determ inants of corporate borrow ing.Journal of Financial Econom ics 5,147–175.
M yers,S.,M ajluf,N.S.,1984.Corporate fnancing and investment decisions when f rm s have information that investors do not have. Journal of Financial Econom ics 13,187–221.
Narayanan,M.,1988.Debt versus equity under asymmetric information.Journal of Financial and Quantitative Analysis 23,39–51.
Porcano,T.M.,1986.Corporate tax rates:progressive,proportionalor regressive.Journalof the American Taxation Association 7,17–31.
Richardson,S.,2006.Over-investment of free cash fow.Review of Accounting Studies 11,159–189.
Ro ll,R.,1986.The hubris hypothesis o f corporate takeovers.Journal of Business 59,197–216.
Stulz,R.,1990.M anagerialdiscretion and op timal f nancing policies.Financial Econom ics26,3–27.
Tang,X.S.,Zhou,X.S.,M a,R.J.,2007.Em pirical research on over-investment behavior and its restriction system s in China’s listed companies.Accounting Research 7,44–52.
Tang,X.S.,Zhou,X.S.,M a,R.J.,2010.Government intervention,GDP grow th and over-investm ent of local SOEs.Journalof Financial Research 8,33–48.
Wei,M.H.,Liu,J.H.,2007.SOE dividends,governance factors and over-investment.M anagementW orld 4,88–95.
W ilson,R.J.,2009.An exam ination o f corporate tax shelter participants.The Accounting Review 84(3),969–999.
W u,S.N.,Lu,X.Y.,2001.A study o fm odels fo r predicting fnancial distress in China’s listed com pan ies.Econom ic Research Journal6, 46–55.
Wu,W.,W u,C.,Zhou,C.,W u,J.,2011.Political connections,tax benef ts and f rm performance:evidence from China.Journal of Accounting and Pub lic Policy,1–24.
Xin,Q.Q.,Lin,B.,W ang,Y.C.,2007.Governmen t con tro l,execu tive com pensation and capital investment.Econom ic Research Journal 8,110–122.
Xue,Y.K.,Bai,Y.X.,2008.State ownership,redundant emp loyees and corporate performance.M anagementWorld 10,96–105.
Yang,H.J.,Hu,Y.M.,2007.Institutional environment and over investment of free cash fow.M anagementW orld 9,99–116.
Young,A.,2000.The razor’s edge:distortionsand increm ental reform in the Peop le’s Republic o f China.Quarterly Journalof Econom ics 115,1091–1135.
Zhang,H.H.,Wang,Z.J.,2010.Government intervention,governmentob jectand state-owned listed companies’overinvestment.Nankai Business Review 13,101–108.
Zhou,L.A.,2004.The incentive and cooperation of governm ent of cials in the po litical tournam ents:an interpretation o f the pro longed local protection ism and dup licative investmen ts in China.Econom ic Research Jou rnal 6,33–40.
Zhu,C.F.,Li,Z.W.,2008.State ownership and accounting conservatism.Accounting Research 5,38–45.
Zimmerman,J.L.,1983.Taxes and f rm size.Journal of Accounting and Econom ics 5,119–149.
❋Corresponding author.M obile:+86 186 6608 0107.
E-mail addresses:lxinx10086@gmail.com(X.Liao),sysu lyg@gmail.com(Y.Liu).1M obile:+86 159 2047 9605.
Produc tion and hos ting by E lsevie r
☆This Study was suppo rted by the M ajor Project of the National N atural Science Foundation of China(N o.71032006),the General Project of M inistry of the Education of Humanities and Social Science(No.11YJA 790094)and the General Project of the National Natural Science Foundation of China(No.71372150).
☆☆W e acknow ledge the help ful comm ents and suggestions p rovided by ProfessorW eiqiang Tang in H ong K ong Baptist Un iversity,the anonymous reviewers and the other participants of the Annual M eeting of China A cadem ic A ccoun ting Association in 2012 and the Sym posium of China Journal of Accounting Research in November,2012.
1755-3091/$-see frontmatter©2013 Production and hosting by Elsevier B.V.on behalf of China Journal of Accounting Research. Founded by Sun Yat-sen U niversity and City U niversity of H ong Kong.
h ttp://dx.doi.org/10.1016/j.cjar.2013.07.002
Fiscal distress
Local state-owned enterp rises Overinvestment