Correlation analysis and partial least square modeling to quantify typical minerals with Chang’E-3 visible and near-infrared imaging spectrometer’s ground validation data
2014-02-20LIUBinLIUJianzhongZHANGGuangliangLINGZongchengZHANGJiangHEZhipingYANGBenyongandZOUYongliao
LIU Bin, LIU Jianzhong, ZHANG Guangliang, LING Zongcheng, ZHANG Jiang, HE Zhiping, YANG Benyong, and ZOU Yongliao
1National Astronomical Observatories, Chinese Academy of Science, Beijing 100012, China
2Graduate University of Chinese Academy of Sciences, Beijing 100049, China
3School of Space Science and Physics, Shandong University, Weihai 264209, China
4Shanghai Institute of Technical Physics, Chinese Academy of Science, Shanghai 200083, China
5Anhui Institute of Optics and Fine Mechanics, Chinese Academy of Science, Anhui 230031, China
*Corresponding author, E-mail: liub@nao.cas.cn
Correlation analysis and partial least square modeling to quantify typical minerals with Chang’E-3 visible and near-infrared imaging spectrometer’s ground validation data
LIU Bin1,2*, LIU Jianzhong1, ZHANG Guangliang1, LING Zongcheng3, ZHANG Jiang3, HE Zhiping4, YANG Benyong5, and ZOU Yongliao1
1National Astronomical Observatories, Chinese Academy of Science, Beijing 100012, China
2Graduate University of Chinese Academy of Sciences, Beijing 100049, China
3School of Space Science and Physics, Shandong University, Weihai 264209, China
4Shanghai Institute of Technical Physics, Chinese Academy of Science, Shanghai 200083, China
5Anhui Institute of Optics and Fine Mechanics, Chinese Academy of Science, Anhui 230031, China
*Corresponding author, E-mail: liub@nao.cas.cn
Chin.J.Geochem.(2014)33:086-094
In 2013, Chang’E-3 program will develop lunar mineral resourcesin-situdetection. A Visible and Near-infrared Imaging Spectrometer (VNIS) has been selected as one payload of CE-3 lunar rover to achieve this goal. It is critical and urgent to evaluate VNIS’ spectrum data quality and validate quantification methods for mineral composition before its launch. Ground validation experiment of VNIS was carried out to complete the two goals, by simulating CE-3 lunar rover’s detection environment on lunar surface in the laboratory. Based on the hyperspectral reflectance data derived, Correlation Analysis and Partial Least Square (CA-PLS) algorithm is applied to predict abundance of four lunar typical minerals (pyroxene, plagioclase, ilmenite and olivine) in their mixture. We firstly selected a set of VNIS’ spectral parameters which highly correlated with minerals’ abundance by correlation analysis (CA), and then stepwise regression method was used to find out spectral parameters which make the largest contributions to the mineral contents. At last, functions were derived to link minerals’ abundance and spectral parameters by partial least square (PLS) algorithm. Not considering the effect of maturity, agglutinate and Fe0, we found that there are wonderful correlations between these four minerals and VNIS’ spectral parameters, e.g. the abundance of pyroxene correlates positively with the mixture’s absorption depth, the value of absorption depth added as the increasing of pyroxene’s abundance. But the abundance of plagioclase correlates negatively with the spectral parameters of band ratio, the value of band ratio would decrease when the abundance of plagioclase increased. Similar to plagioclase, the abundance of ilmenite and olivine has a negative correlation with the mixture’s reflectance data, if the abundance of ilmenite or olivine increase, the reflectance values of the mixture will decrease. Through model validation, better estimates of pyroxene, plagioclase and ilmenite’s abundances are given. It is concluded that VNIS has the capability to be applied on lunar minerals’ identification, and CA-PLS algorithm has the potential to be used on lunar surface’sin-situdetection for minerals’ abundance prediction.
Lunar surface; Chang’E-3; VNIS; partial least square (PLS)
1 Introduction
Mineral composition and distribution of lunar surface is critical for investigating the origin and geologic evolution of the Moon. e.g. the mineralogy information of craters’ ejecta can be used to investigate lunar crustal structure (Tompkins and Pieters, 1999; Joliff et al., 2000; Pieters, 1993; Williams et al., 1995; Cahill et al., 2009). Besides, the mineral distribution of lunar surface will help us improve the hypothesis of‘magma ocean’ (Wood, 1975; Solomon and Longhi, 1977; Elkins-Tanton et al., 2002). The second phase of Chang’E Program (Chang’E-3) is to land and performin-situdetection on lunar surface. And one of the scientific goals of Chang’E-3 is to develop lunar mineral resources survey and compositionin-situdetection(Ouyang Ziyuan, 2005). To achieve this goal, a VIS/NIR imaging spectrometer (VNIS) based on Acousto-Optic Tunable Filter (AOTF) technique has been selected as a payload of Chang’E-3 lunar rover (He Zhiping et al., 2011), main parameters of VNIS is listed in Table 1. Chang’E-3 would be the first mission to carry on hyperspectral imaging spectrometer for lunarin-situdetection, the detection mode and data processing methods will be different from that of ground-based telescopes and satellites.
VNIS has become an effective approach to character and predict abundance of lunar minerals and elements (Ling Zongcheng et al., 2010, 2011a, b; Yan Bokun et al., 2012; Lucey, 2004). Three kinds of prediction approach are commonly used. The first one is statistical model based on the links between spectral parameters and the mineral constitutes, such as multiple linear regression model (MLR) (Shkuratov et al., 2003, 2005a, b; 2007), principal component regression (PCR) (Pieters et al., 2002; Zhang Xiaoyu, 2008), and partial least square (PLS) regression (Li Lin, 2006, 2007, 2008, 2010; Li Shuai and Li Lin, 2011, 2012). The second approach is modified Gaussian model (MGM) (Sunshine et al., 1990, 1993, 1998; Nobel et al., 2000, 2005), which is a common method to fit mineral absorption features based on Gauss curves. The last one is radiative transfer models (Cahill et al., 2007, 2010; Denevi et al., 2008; Li Lin and Li Shuai, 2010; Lucay, 2004; Wilcox et al., 2006), which has taken physical factors (e.g. the particle size, the maturity and the porosity) into account. All methods referenced above have been applied to evaluate lunar soils’ composition, but there are limitations for each one. The disadvantage of radiative transfer model is that the model is too complex and it is difficult to obtain pure end-member spectra. MGM is timeconsuming and only effective to the minerals (e.g. pyroxene or olivine) whose absorption features are obvious.
Compared with the other two methods’ limitations, statistical analysis methods based on the links between spectral parameters and mineral composition are widely used for its convenience. In contrast to MLR and PCR (Shkuratov et al., 2003; Pieters et al., 2002, 2006), PLS algorithm (Li Lin, 2006) has the advantage of fewer components used and higher precision. Nevertheless, defects also exist in PLS model (Li Shuai et al., 2012). First of all, PLS algorithm makes all the bands participated in the model establishment, making effective removal of redundant spectral bands very hard. Then, nonlinear spectral mixing is not considered in the process. To solve these two problems, GA-PLS and PLS-BPNN algorithms are introduced (Li Lin and Li Shuai, 2010; Li Shuai et al., 2012), GA-PLS selects effectively a series of spectral features data which provide the largest contribution to mineral inversion, while neglect the nonlinear spectral mixing factors. After that, PLSBPNN algorithm is developed to overcome these two limitations and better results are derived. But it is noticeable that a sufficient number of training samples are needed for PLS-BPNN algorithm to achieve a stable estimation, which should also cover the full range of compositions and physical properties (Li Shuai et al., 2012). Based on previous works, the focus of the study is to establish a new PLS model combined with correlation analysis (CA-PLS), which is an effective way for selecting a set of effective spectral parameters data to predict mineral abundance. Using the ground validation experiment data of VNIS, a set of VNIS’spectral parameters highly correlated with minerals’abundance were found through correlation analysis, then the Stepwise Regression Analysis method was used to find out spectral parameters which makes the largest contributions to the mineral contents. At last, functions are derived to link minerals’ abundance and the selected spectral parameters by PLS.
2 Data description
2.1 Ground validation experiment of VNIS
Before the launch of CE-3 lunar rover, lots of ground validation experiments need to be done for VNIS and other payloads. The purpose of ground validation experiment is to understand the performance of the instruments, evaluate data quality and practice data processing methods. There are two objectives of VNIS ground validation experiment, one is to simulate VNIS’ working conditions on lunar rover and evaluate its image and spectrum data quality, another is to build up minerals’ prediction models according to the spectral data of seven mixtures composed of different minerals’ proportion. The experiment pipeline is shown in Fig. 1, and Fig. 2 demonstrates the devices and measurement principle. During the process of ground validation experiment, VNIS is compared with a standard spectrometer named ASD, and these two spectrometers were fixed on the simulated lunar rover at the same viewing geometry. The type of ASD we used is Field Spec 3, the performance and specification could be known from http://www.asdi.com. Calibration target was firstly detected by VNIS and ASD at the same time and the same geometry. After that, experiment samples were changed to be detected until all the samples finished detection. The working geometry is as follow: the incident angle of light sources was fixed at 60°, and the detection angle of VNIS and ASD was fixed at 45°, the azimuth angle between lunar rover and light sources is 180°.

Table 1 Main parameter of VNIS
2.2 Samples preparation
During VNIS ground validation experiment in the laboratory, we tried our best to simulate its working conditions on lunar surface. Nevertheless, it turned out to be very difficult to simulate lunar soils completely, especially the maturity and composition. Five kinds of mineral whose spectral features are obvious and close to lunar minerals were selected as raw experiment samples, namely, hyperthene, diopside, olivine, plagioclase and ilmenite. These minerals were firstly ground by the grinder and the median particle sizes were controlled at the range of 40-130 μm, simulating the median particle sizes on lunar surfaces. Major chemical analysis of the minerals is listed in Table 2 except ilmenite, the composition of which is mainly TiO2. The bidirectional-hemispheric reflectance data of the five minerals were measured in the laboratory by standard spectrophotometer (Fig. 3). Then hyperthene, olivine, plagioclase and ilmenite were selected to be stirred and mixed as the seven proportions provided by Table 4, and these seven mixtures are final samples used for ground validation experiment, which aims to evaluate VNIS spectral data quality and practice mineral quantification method. Hyperthene is selected other than diopside for the reason that the spectrum of hyperthene is similar to the pyroxene on lunar surface.
2.3 Data processing
This section contained VNIS and ASD data processing. The steps and pipeline of VNIS data processing are shown in Fig. 7, and dark current subtraction, radiance calibration and reflectance conversion are included. VNIS measured dark current data before and after sample detection, so the mean values of the dark current data could be subtracted when the detection finished. After dark current subtraction, radiance calibration is needed to change the raw data to radiance using coefficients, that were derived from the radiance calibration experiment of Shanghai Institute of Technical Physics, from pre-flight radiance calibration experiment. At last, reflectance conversion must be done because reflectance data reflects the characters of the minerals and is fundamental for mineral prediction models’ establishment. We could calculate VNIS bidirectional reflectance factor (BRF) data with the methods employed by Mars’ Pathfinder, Sprit and Opportunity (Reid et al., 1999; Bell et al., 2003, 2006).
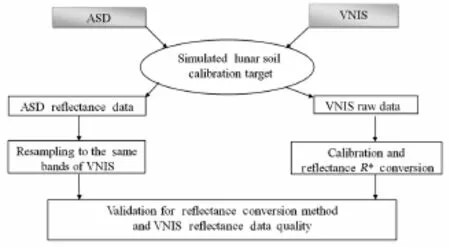
Fig. 1. VNIS’ ground validation experiment pipeline.

Fig. 2. Experiment devices and measurement principle.

Fig. 3. Bidirectional-hemispheric reflectance features of the five minerals in the laboratory.

Table 2 Chemical composition measured for the raw mineral

Table 3 Mineral proportion of seven mixture

Fig. 4. The final mixture samples prepared for the experiment (from left to right, mixture 1 to 7).

Fig. 5. VNIS’ ground data processing pipeline.
The steps of ASD data processing are similar to that of VNIS, which also contained three steps: dark current subtraction, radiance calibration and reflectance conversion. The reflectance spectrum of seven mixtures obtained by VNIS and ASD under the same conditions is plotted in Fig. 8. We can concluded that the shape and values of VNIS reflectance is close to that of ASD from Fig. 8 a and c, which demonstrate that the quality of VNIS spectral data is well and absorption features of minerals can be characterized effectively. But Fig. 8a also demonstrates that there is stronger spectral jitter in VNIS spectral range of 450-900 nm than other wavelengths. This is mainly caused by the reason that the intensity of light source in the laboratory is weaker than sunlight in the spectral range of 450-950 nm, and the bands’ integrating time parameters of VNIS’ detector (CCD) in this spectral range are set as the intensity of sunlight, which lead to the intensity every band received is weak, so VNIS signal to noise ratio (SNR) was brought down. To remove this spectral jitter, five-point linear smoothing algorithm was used to VNIS’ original reflectance data (Fig. 8b), and the data after smoothed was used to establish models for minerals’ prediction.
3 CA-PLS model description and application
Three steps are needed for CA-PLS to predict mineral abundance in the mixture, they are correlation analysis, stepwise regression analysis and PLS modeling.
3.1 Correlation analysis and stepwise regression
Correlation analysis (CA) is a simple and effective statistical approach which analysis the closeness between two correlated variables, which is expressed as correlation coefficient. There are three kinds of correlation coefficients, Pearson, Spearman and Kendall. Pearson correlation coefficientis can be calculated by the following formula:whereris Pearson correlation coefficient,Nis the number of samples data,xiandyirepresent the two variables, spectral parameter and mineral’s proportion in the mixture, respectively.

VNIS is a hyperspectral instrument which contained 400 bands. High correlation existed among these bands’ reflectance, so CA is firstly used to select a set of bands’ reflectance and spectral parameters data as the independent variables show high correlation with the dependent ones of mineral contents in the mixture. Then, Stepwise Regression Analysis is applied to find out five bands’ reflectance or spectral parameters which make the largest contributions to the mineral contents. The five bands’ reflectance or spectral parameters data selected will be involved in the PLS model establishment.

Fig. 6. Reflectance features comparison of VNIS and ASD for the seven mixtures. (a) Reflectance data obtained by VNIS; (b) reflectance data obtained by VNIS smoothed by five-point linear smoothing algorithm; (c) reflectance data obtained by ASD (There is a conjunction between ASD two detectors near 1000 nm, so there is a spectral at some wavelengths near 1000 nm).
The spectral parameters included bands’ reflectance, band ratio (or color index), absorption depth and bend data. Band ratio is the ratio of two bands’reflectance, absorption depth is the distance between the lower point of the wave trough to the normalized envelope (Fig. 7), and the parameter of bend to character the absorption feature near 1000 nm is defined by Pieters et al.(2006).

Fig. 7. The definition of absorption depth.

The spectral absorption features of the seven mixtures are mainly existed near 1000 and 2000 nm. As the absorption depth defined in Figure 7, when calculating the above spectral parameters, we need to specify the beginning band, the trough band and the end band of the seven mixtures’ absorption. So the bands of beginning, trough and end of the absorption near 1000 nm are λ1=705 nm, λm=905 nm, λ2=1105 nm, and for the absorption of 2000nm, bands of the beginning, trough and end of the absorption are λ1=1555 nm, λm=1955 nm, λ2=2350 nm.
3.2 PLS modeling
Partial Least Square (PLS) is a powerful regression method which helps to set up relationships between mineral composition and spectral parameters. The details of the algorithm have been described by Li Lin (2006). The advantages of PLS are as follow:
(1) Regression modeling can be made under the condition of the independent variables’ multiple correlation.
(2) Regression modeling is allowed under the condition that the number of sample data is less than number of independent variables.
(3) The final regression model will contain all of the original variables.
Due to the limitation of sample’s amount, the number of the dependent variables (only seven abundance data for every mineral) is far less than the independent variables (400 bands reflectance data and other spectral parameters), so PLS algorithm was selected and used to establish relationship between dependent variables (the mineral abundance in the mixture) and independent variables (spectral parameter data). The final model formula is as follow:

whereMineral_abunis one kind of mineral abundance,Spec_p1,Spec_p2,Spec_p3, …,Spec_pnare spectral parameters, andc0,c1,c2,c3,cnare regression coefficient.
Root mean square error (RMSE) is used to demonstrate the model accuracy, and the relative prediction error (δ) is calculated to indicate which minerals can be predicted better.
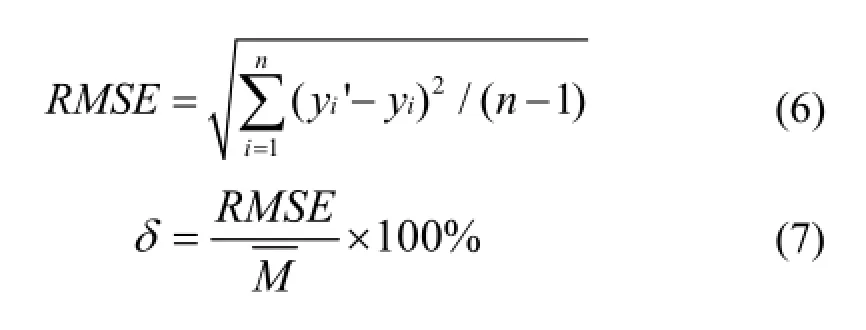
wherenis the number of samples, heren=7,iis the index of the sample,yiis mineral prediction value,yiis the actual mineral relative abundance in the mixture, andMis mean mineral abundance value of all the seven samples.
4 Results and discussion
The prediction results of the four minerals are acquired, every mineral’s five final spectral parameters are selected after correlation analysis and stepwise regression, and the prediction coefficients are derived by PLS modeling. During the process of the four minerals’ modeling, we selected five of the seven mixture’s spectral and composition data as training data, the other two mixtures’ spectral and composition data were validation data. The four minerals’ model equations are as follow.
4.1 Pyroxene model
The pyroxene abundance of five training data has significant correlation with many spectral parameters. For example, the correlation coefficients between pyroxene contents and absorption_depth_1000, 2000, band ratio 900/750 nm, bend_1000, 2000 nm are higher than 92%. As the proportion of pyroxene raised, the absorption depth of 1000 and 2000 nm would increase. The five spectral parameters were selected as independent variables. And the PLS model quantifying pyroxene content in the mixture is as follow:

4.2 Plagioclase model
Plagioclase abundance data correlated highly with the spectral parameters of band ratios. As the proportion of plagioclase increased, the values of band ratios would decrease. We selected five band ratio parameters as independent variables, and set up a PLS model to quantify plagioclase contents in the mixture.

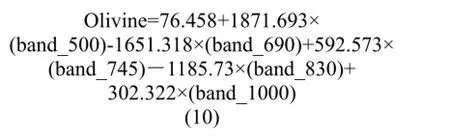
4.3 Olivine model
Olivine abundance correlated highly with some band reflectance data. As the proportion of olivine grew, the values of band reflectance would decrease. We selected five bands reflectance by correlation analysis and stepwise regression as independent variables, and established the PLS model to quantify olivine contents in the mixture.
4.4 Ilmenite model
Ilmenite composition correlated highly with band reflectance data. As the proportion of ilmenite went up, the values of band reflectance would decrease. We selected five band reflectance data as independent variables, and set up a PLS model to quantify ilmenite contents in the mixture.
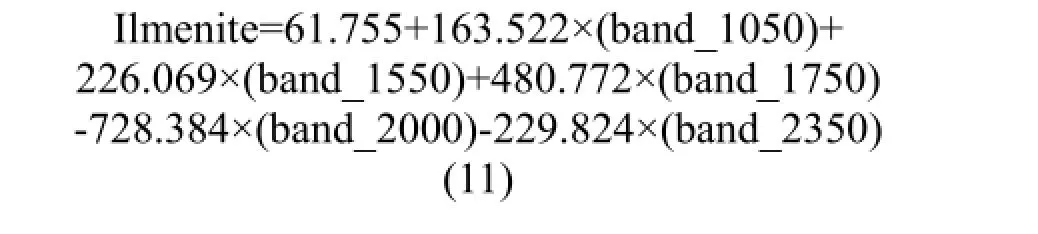

Fig. 8. Comparison of the four minerals abundance with those predicted from CA-PLS model. (a) Pyroxene model: mixture 3 and 5 were validation data, and the other five are training data; (b) plagioclase model: mixture 2 and 6 were validation data, and the other five are training data; (c) olivine model: mixture 1 and 4 were validation data, and the other five are training data; (d) ilmenite model: mixture 2 and 4 were validation data, and the other five are training data.
Comparison of the four minerals abundance with those predicted from CA-PLS model are shown in Fig. 8. The training samples are represented by open circles, while the validation sample are characterized by the solid dots. The sold line is 1:1 correlation line.

Table 4 The RMSE and relative errors calculated in the prediction of the four mineral abundance
The RMSE and relative prediction errors are listed in Table 4. Generally speaking, the prediction results of hyperthene and plagioclase are satisfactory with the low level of RMSE (0.04 and 0.03), and the relative prediction errors are small for the values of 13.79% and 8.33%. The prediction result of ilmenite is passable, with the values of RMSE and relative error are 0.03% and 17.5%. But the prediction result of olivine is undesirable, with the highest relative error value of 75.87%.
The undesirable result of olivine prediction is mainly caused by the following reasons: (1) correlation between olivine abundance and spectral parameters is not so significant as that of other minerals, which makes the olivine’s prediction model is not precise; (2) The number of training data for statistical analysis is only five groups, the estimation results of which may be stable but they are unlikely optimal, the additional samples which extend the abundance range of training data may improve the prediction results. In this experiment, the amount of our sample is limited and the size of our sample must cover VNIS field of view, so we have to make seven mixtures. (3) the models still not consider non-linear spectrum effect between the spectral parameters and the abundance data.
5 Conclusions
Take advantage of seven mixtures’ spectral data and mineral composition data, correlation analysis and partial least square algorithm were used to set up four minerals abundance prediction models. The root mean square errors and relative prediction errors were calculated to evaluate the accuracy. Results demonstrate that the models can well predict pyroxene, plagioclase and ilmenite’s abundance, while the results of olivine are not desirable, which was further discussed.
More work is still needed to evaluate VNIS’ capability and improve the algorithm under study. Non-linear spectrum effect will be considered in thefuture. The main purpose of this paper is to evaluate the spectral data quality of VNIS and validate the CA-PLS prediction algorithm. The landing site of CE-3 lunar rover has been selected in the district of Sinus Iridum, which is an impact basin filled with basalt. Considering the difference between our ground validation sample and lunar real soils, CA-PLS algorithm will be used to set up lunar minerals’ prediction models which are suitable for VNIS’ bands based on the lunar highland and mare soils’ reflectance and composition data characterized by the Lunar Soil Characterizations Consortium (LSCC). In conclusion, VNIS is not only can be used to distinguish the lunar main minerals, CA-PLS algorithm also has the potential to predict lunar minerals’ abundance.
AcknowledgementsThis study was financially supported by the Chang’E program of China (NO.TY3Q20110029), Knowledge Innovation Program of the Chinese Academy of Sciences (Grant No.KGCX2-EW-402) and National Natural Science Foundation of China (Nos.11003012 and U1231103).
Bell III J.F., Squyres S.W., Herkenhoff K.E., Maki J.N., Arneson H.M, Brown D., Collins S.A., Dingizian A., Elliot S.T., Hagerott E.C., Hayes A.G., Johnson M.J., Johnson J.R., Joseph J., Kinch K., Lemmon M.T., Morris R.V., Scherr L., Schwochert M., Shepard M.K., Smith G.H., Sohl-Dickstein J.N., Sullivan R.J., Sullivan W.T., and Wadsworth M. (2003) Mars exploration rover athena panoramic camera (pancam) investigation [J].Journal of Geophysical Research-Atmospheres. 108, 8063.
Bell III J.F., Joseph J., Sohl-Dickstein J.N., Arneson H.M., Johnson M.J., Lemmon M.T., and Savransky D. (2006) In-flight calibration and performance of the Mars Exploration Rover Panoramic Camera (Pancam) instruments [J].Journal of Geophysical Research-Atmospheres. 111.
Cahill J.T., and Lucey P.G. (2007) Radiative transfer modeling of lunarhighlands spectral classes and relationship to lunar samples [J].Journal of Geophysical Research-Atmospheres. 112.
Cahill J.T., Lucey P.G., and Wieczorek M.A. (2009) Compositional variations of the lunar crust: Results from radiative transfer modeling of central peak spectra [J].Journal of Geophysical Research-Atmospheres. 114.
Cahill J.T.S., Lucey P.G., Stockstill-Cahill K.R., and Hawke B.R. (2010) Radiative transfer modeling of near-infrared reflectance of lunarhighland and mare soils [J].Journal of Geophysical Research-Atmospheres. 115.
Denevi B.W., Lucey P.G., and Sherman S.B. (2008) Radiative transfer modeling of near-infrared spectra of lunar mare soils: Theory and measurement [J].Journal of Geophysical Research-Atmospheres. 113.
Elkins Tanton L.T., Van Orman J.A., Hager B.H., and Grove T.L. (2002) Re-examination of the lunar magma ocean cumulate overturn hypothesis: Melting or mixing is required [J].Earth and Planetary Sci-ence Letters.196, 239-249.
He Zhiping, Shu Rong, and Wang Jianyu (2011)Imaging Spectrometer Based on Aotf and its Prospects in Deep-Space Exploration Application[Z]. Proceeding of SPIE. 8196.
Joliff B.L., Gillis J.J., Haskin L.A., korotev R.L., and Wieczorek M.A. (2000) Major lunar crustal terranes: Surface expressions and crustmantle origins [J].Journal of Geophysical Research-Atmospheres. 1015, 4197-4216.
Li Lin (2006) Partial least squares modeling to quantify lunar soil composition with hyperspectral reflectance measurements [J].Journal of Geophysical Research-Atmospheres. 111, 1-13.
Li Lin (2007) Quantifying lunar soil composition with partial least squares modeling of reflectance [J].Advances in Space Research.42, 267-274.
Li Lin (2008) Partial least square methods for spectrally estimating lunar soil FeO abundance: A stratified approach to revealing nonlinear effect and qualitative interpretation [J].Journal of Geophysical Research-Atmospheres. 113, E12013.
Li Lin and Li Shuai (2010)Deriving Lunar Mineral Abundance Maps from Clementine Multispectral Imagery[C]. Proceedings of 41stLunar Planetary Institute Science Conference. pp.2189 (abstract).
Li Shuai (2011) Quantifying TiO2abundance of lunar soils: Partial least squares and stepwise multiple regression analysis for determining causal effect [J].Journal of Earth Science. 22, 549-565.
Li Shuai, Li Lin, Milliken R., and Song Kaishan (2012) Hybridization of partial least squares and neural network models for quantifying lunar surface minerals [J].Icarus. 221, 208-225.
Ling Zongcheng, Zhang Jiang, Liu Jianzhong, Zhang Wenxi, Bian Wei, Ren Xin, Mu Lingli, Liu Jianjun, and Li Chunlai (2011) Preliminary results of FeO mapping using Imaging Interferometer data from Chang’E-1 [J].Chinese Science Bulletin. 56, 376-379.
Ling Zongcheng, Zhang Jiang, Liu Jianzhong, Zhang Wenxi, Zhang Guangliang, Liu Bin, Ren Xin, Mu Lingli, Liu Jianjun, and Li Chunlai (2011) Preliminary results of TiO2mapping using Imaging Interferometer data from Chang’E-1 [J].Chinese Science Bulletin. 56, 2082-2087.
Ling Zongcheng, Zhang Jiang, Liu Jianzhong, Zhang Wenxi, Zhang Guangliang, Liu Bin, Ren Xin, Mu Lingli, Liu Jianjun, and Li Chunlai (2011)Mapping MgO and Mg-number with Chang'E-1 IIM data[C]. EPSC-DPS joint meeting, 936.
Lucay, P.G. (2004) Mineral maps of the Moon [J].Geophysical Research Letters.31, L08701.
Noble S.K., Pieters C.M., Hiroi T., Taylor L.A., Morris R.V., McKay L.P., Keller D.S., and Wentworth S. (2000)Initial Results of MGM Analysison Apollo 17 Soil Suite[C]. Proceedings of 31stLunar Planetary Institute Science Conference. pp.1880 (abstract).
Noble S.K., Pieters C.M., and Hirori T. (2005)Extracting Quantitativedata from Lunar Soil Spectra[C]. Proceedings of 36thLunar Planetary Institute Science Conference. pp.1255 (abstract).
Ouyang Ziyuan (2005)Introduction to Lunar Science[M]. pp.312-313. Chinese Astronautic Publishing House, Beijing (in Chinese).
Pieters C.M., Head J.W., Sunshine J.M., Fischer E.M., Murchie S.L., Belton M., McEwen A., Gaddis L., Greeley R., Neukum G., Jaumann R., and Hoffmann H. (1993) Crustal diversity of the Moon: Compositional analysis of Galileo SSI data [J].Journal of Geophysical Research-Atmospheres. 98, 17127-17148.
Pieters C.M., Stankevich D.G., Shkuratov Y.G., and Taylor L.A. (2002) Statistical analysis of the links among lunar mare soil mineralogy, chemistry and reflectance spectra [J].Icarus. 155, 285-298.
Pieters C.M., Shkuratov Y.G., Kaydash V., Stankevich D., and Yaylor L. (2006) Lunar soil characterization consortium analysis: Pyroxene and maturity estimates derived from Clementine image data [J].Icarus. 184, 83-101.
Reid R.J., Smith P.H., Lemmon M., Tanner R., Burkland M., Wegryn E., Weinberg J., Marcialis R., Britt D.T., Thomas N. Kramm R., Dummel A., Crowe D., Bos B.J., Bell III J.F., Rueffer P., Gliem F., Johnson J.R., Maki J.N., Herkenhoff K.E., and Singer R.B. (1999) Imager for Mars Pathfinder (IMP) image calibration [J].Journal of Geophysical Research-Atmospheres. 104, 8907-8925.
Shkuratov Y.G., Stankevich D.G., Kaydash V.G., Vitaliy V., Omelchenko1, Pieters C.M., Pinet P.C., Chevrel S.D., Daydou Y.H., Foing B.H., Sodnik Z., Josset J.L., Taylor L.A., and Shevchenko V.V. (2003) Composition of the lunar surface as will be seen from SMART-1: A simulation using Clementine data [J].Journal of Geophysical Research-Atmospheres. 108, 5020.
Shkuratov Y.G., Kaydash V.G., and Pieters C.M. (2005a) Lunar clinopyroxene and plagioclase: Surface distribution and composition [J].Solar System Research.39, 255-266.
Shkuratov Y.G., Kaydash V., Stankevich D.G., Starukhina L.V., Pinet P.C., Chevrel S.D., and Daydou Y.H. (2005b) Derivation of elemental abundance maps at intermediate resolution from optical interpolation of Lunar Prospector Gamma-Ray spectrometer data [J].Planetary and Space Science.53, 1287-1301.
Shkuratov Y.G., Kaydash V.G., Starukhina L.V., and Pieters C.M. (2007) Lunar surface agglutinates: Mapping composition anomalies [J].Solar System Research.41, 177-185.
Solomon S.C. and Longhi J. (1977)Magma Oceanography: 1. ThermalEvolution[C]. Proceedings of 8thLunar Planetary Institute Science Conference, 583-599.
Sunshine J.M., Pieters C.M., and Pratt S. (1990) Deconvolution of mineral absorption bands: An improved approach [J].Journal of Geophysical Research-Atmospheres.95, 6955- 6966.
Sunshine J.M. and Pieters C.M. (1993) Estimating model abundances from the spectral of natural and laboratory pyroxene mixture using the modified Gaussian model [J].Journal of Geophysical Research-Atmospheres.98, 9075-9087.
Sunshine J.M. and Pieters C.M. (1998) Determining the composition of olivine from reflectance spectroscopy [J].Journal of Geophysical Research-Atmospheres.103, 675-688.
Tompkins S. and Pieters C.M. (1999) Mineralogy of the lunar crust: Results from Clementine [J].Meteoritics & Planetary Sciences.34, 25-41.
Wilcox B.B., Lucey P.G., and Hawke B.R. (2006) Radiative transfer modeling of compositions of lunar pyroclastic deposits [J].Journal of Geophysical Research-Atmospheres.111, E09001.
Williams D.A., Greeley R., Neukum G., Wagner R., and Kadel S.D. (1995) Multispectral studies of western limb and farside maria from Galileo Earth-Moon encounter 1 [J].Journal of Geophysical Research-Atmospheres.100, 23291-23299.
Wood J.A. (1975)Lunar Petrogenesis in a Well-stirred Magma Ocean[C]. Proceedings of 6thLunar Planetary Institute Science Conference, 1087-1102.
Yan Bokun, Xiong Shengqing, Wu Yunzhao, Wang Zhenchao, Dong Lina, Gan Fuping, Yang Suming, and Wang Runsheng (2012) Mapping lunar global chemical composition from Chang’E-1 IIM data [J].Planetary and Space Science. 119-129.
Zhang Xiaoyu, Li Chunlai, and Lü Chang (2009) Quantification of the chemical composition of lunar soil in terms of its reflectance spectra by PCA and SVM [J].Chinese Journal of Geochemistry. 28, 204-211.
10.1007/s11631-014-0662-6
Received July 20, 2013; accepted October 12, 2013
© Science Press and Institute of Geochemistry, CAS and Springer-Verlag Berlin Heidelberg 2014
杂志排行

Acta Geochimica的其它文章
- Zircon U-Pb age and Hf isotopic characteristics of the Huangtuliang monzonitic granite, North Hebei Province, China
- Petrography and geochemistry of Jumara Dome sediments, Kachchh Basin: Implications for provenance, tectonic setting and weathering intensity
- Scientific data and their release of Chang’E-1 and Chang’E-2
- Efficiency of a re-usable Carius tube for determination of platinum group elements in ultramafic rocks
- Geochemistry of rare-earth elements in shallow groundwater, northeastern Guangdong Province, China
- Fluid inclusion, siliceous rock geochemistry of Shewushan lateritic gold deposit, Hubei Province, eastern China: Implication for the genesis of primary orebody