Scientific data and their release of Chang’E-1 and Chang’E-2
2014-02-20ZUOWeiLIChunlaiandZHANGZhoubin
ZUO Wei, LI Chunlai, and ZHANG Zhoubin
The Science and Application Center for Moon and Deepspace Exploration, National Astronomical Observatories, Chinese Academy of Sciences, Beijing 100012, China
*Corresponding author, E-mail: licl@nao.cas.cn
Scientific data and their release of Chang’E-1 and Chang’E-2
ZUO Wei, LI Chunlai*, and ZHANG Zhoubin
The Science and Application Center for Moon and Deepspace Exploration, National Astronomical Observatories, Chinese Academy of Sciences, Beijing 100012, China
*Corresponding author, E-mail: licl@nao.cas.cn
The Chang’E-1 and Chang’E-2 missions have successfully obtained a huge amount of lunar scientific data, through the seven onboard instruments including a CCD stereo camera, a laser altimeter, an interference imaging spectrometer, an X-ray spectrometer, a microwave radiometer, a high-energy particle detector and a solar-wind ion detector. Most of the Chang’E data are now publicly available to the science community, and this article serves as an official guide on how these data are classified and organized, and how they can be retrieved from http://159.226.88.59:7779/CE1OutENGWeb/. This article also presents the detailed specifications of various instruments and gives examples of research progress made based on these instruments.
Chang’E-1; Chang’E-2; Chang’E data; data management; data release; Chang’E program
1 Introduction
The first Chinese lunar spacecraft, Chang’E-1 (CE-1), was successfully launched from the Xichang Satellite Launch Center on October 24, 2007. On November 20, the Ground and Research Application System (GRAS) of China’s Lunar Exploration Program (CLEP) received the first lunar image from CE-1. By October 24, 2008, CE-1 had completed the main scientific objectives within its one-year expected life time. On March 1, 2009, CE-1 landed at (coordinate) on the lunar surface within the region of Mare Foecunditatis. Following its precursor, a second lunar spacecraft, Chang’E-2 (CE-2), was launched on October 1, 2010, with similar but improved instrument configurations. One of the major goals of the CE-2 primary mission phase is to obtain high-resolution images of several selected regions including the north and south poles as well as the Sinus Iridum, those images were officially issued on February 6, 2012. Performing the verification task to probe the space environment and conducting technological tests such as long-distance monitoring and communication, the CE-2 satellite on June 1, 2012 departed point L2 toward the asteroid is expected next year will be with the asteroid at close range intersection.
By September 15, 2011, GRAS had acquired~4.8 TB data and generated data products at various levels optimized for different research purposes. In order to effectively manage the CE data and facilitate the acquisition and use of these data, the GRAS has developed a specific data-archiving system and a corresponding data storage and release platform. In this study, we provide here an official guide on the functionality of such a platform.
2 Classification and definition of the data
2.1 Instrumentation and data classification
CE-1 carried 8 sets of instruments: a CCD stereo camera (CCD), an interference imaging spectrometer (IIM), a laser altimeter (LAM), a gamma-ray spectrometer (GRS), an X-ray spectrometer (XRS), a microwave radiometer (MRM), a high-energy particle detector (HPD) and a solar wind ion detector (SWID). CE-2 carried the same instruments except IIM as CE-1 with improved performances. The details of these instruments are listed in Table 1, which also includes the corresponding scientific objectives for each set of instruments.
The lunar data obtained by CE-1 and CE-2 can be divided into three major categories: scientific, engineering, and ancillary data. The scientific data are further classified, based on the source instruments, as CCD, IIM, LAM, MRM, GRS, XRS, HPD and SWID,respectively. The engineering data contain telemetry information, ephemeris information, the engineering parameters for data transmission, etc. Finally, the ancillary data include information on the spacecraft orbit and orientation, instrument calibration, data quality, report files and description files.
2.2 Definition of data levels
Scientific data are stored in high-capacity onboard memory in the form of data source packages, received by the GRAS in either playback or real-time mode, and then pre-processed to generate data products in various formats. Depending on how they are acquired and pre-processed, the Chang’E data are categorized into five levels including the raw data and levels 0, 1, 2 and 3 data, as detailed in Table 2. The raw data include both bit stream and framing data. The level 0 data are further divided into levels 0A and 0B. The definitions for the levels 0A, 0B and 1 data are common to all instruments, but those for the levels 2 and 3 data may vary among the different instruments involved.
The CCD level 2 data are divided into levels 2A, 2B, and 2C. As compared to the level 1 data, the level 2A data have been corrected for dark current, relative radiometric calibration and normalization. The level 2B data are obtained through geometric positioning mainly based on the orbit and orientation information at the time when the imaging data are acquired, as well as the geometric and installation parameters for the CCD camera. The level 2C data are generated with photometric calibration. The level 3 data do not contain any sub-level and refer to the imaging data for a specific region on the lunar surface constructed from the level 2C data from individual orbits, through resampling, projection, geometric registration, global mosaic, subdivision and cropping.

Table 1 Summary of exploration instruments and functions

Table 2 Definition of the data levels
The LAM level 2 data are divided into levels 2A and 2B. The level 2A altimetric data have been calibrated with the modification coefficients obtained through ground-based verification tests. The level 2B data have been further geometrically corrected, and they contain the solutions to the geodetic coordinates and elevations for each footprint point. The level 3 data are not further divided and are referred to as the digital elevation model (DEM) data on a global regular grid obtained from the filtering and interpolation of the level 2B data.
The IIM level 2 data are divided into 2A, 2B, and 2C levels. The level 2A data are obtained by correcting level 1 data with a spectral radiance method. Briefly, with the appropriate calibration coefficients based on the level 1 data, the dimensionless spectral data are converted into absolute spectral irradiances. The level 2B data are derived from level 2A data after correction for geometric distortion due to the orbit, orientation and the instruments themselves. The level 2C data are the results of further photometric calibration based on the level 2B data. The Level 3 data refer to the final multi-spectral imaging products with further geometric correction, global mosaic and framing based on the level 2C data.
The GRS Level 2 data are also divided into levels 2A, 2B, and 2C. The level 2A data are constructed from the level 1 X-ray spectra with energy calibration, as well as gain-and-dead-time correction. The level 2B data are the results of further processing of spatial information and provide the geographic coordinates of the observing point and relevant geometric information such as the instrument configuration. The level 2C data are obtained by calibrating the level 2B data to a common spacecraft altitude, with the spectral data normalized to the lunar surface. The level 3 data are not further divided, and they result from the level 2 data after normalizing the incident cosmic ray fluxes and integrating the energy spectra.
The XRS level 2 data are divided into levels 2A, 2B and 2C. Three types of the level 2A data are involved, including the energy-integrated count rate measured every 1 s, the differential spectral data measured every 10 s, both obtained with the X-ray solar monitor, as well as the spectral data obtained with the X-ray lunar spectrometer. All types of the level 2A data have been corrected for dead time, and the spectral data (from both the solar monitor and lunar monitor) have been further processed with energy calibration. The level 2B data are the products with geometric correction to determine the solar incidence angle for the solar monitor data and the geographic coordinates of the observing points (as well as other geometric information) for the lunar monitor. The level 2C data have been calibrated to zero solar incidence angle. The level 3 data are not divided, and refer to the lunar X-ray spectra with normalized solar incidence flux.
The MRM level 2 data are divided into levels 2A, 2B, and 2C. The level 2A data include the test of the data validity and the calculation of the antenna temperature. The level 2B data include additional geometric information from the observing point, based on the corresponding satellite attitude and orbit, the lunar geometric parameters, as well as the antenna pointing information. The level 2C data are brightness temperature converted from the antenna temperature. The level 3 data are not further divided, and refer to the spliced and interpolated results of the MRM observations made within one month. The level 3 data contain both the dayside and nightside brightness temperatures covering the entire lunar surface.
The HPD level 2 data include sub-levels 2A, 2B and 2C. The level 2A data carry out the system calibration, count rate conversion and geometric factor conversion for data products of level 1. The level 2B data perform geometric positioning and add geocentric sun-ecliptic coordinate information and moonfixed coordinate system information for data products of the level 2A. Data products of level 2C carry out the incidence angle correction for data products of level 2B when the anisotropy of detected particles is remarkable. According to the time range recorded, data products of level 03 generate two product files: the average of 10 seconds and the average of 2 minutes, representing one orbit observation data and one day observation data, respectively.
The SWID level 2 data include the data of levels 2A and 2B. The level 2A data contain the results from various corrections of the level 1 data, such as systematic correction, count rate conversion and geometric factor energy conversion. To get the level 2B data, the level 2A data are further processed with geometric correction and addition of Geocentric Solar Ecliptic (GSE) coordinates and the Selenocentric Geographic (SCG) coordinates of the observing points. The level 3 data are divided into levels 3A and 3B, both giving the calculated values of the velocity, temperature and ion count density of the solar wind (SW) ions. The difference between the 3A and 3B data is that the former is averaged over 10 seconds and the latter is averaged over 2 minutes.
2.3 Data sources and application results
2.3.1 CCD stereo camera
The CCD stereo camera of CE-1 is a large array push-broom camera with 1024×1024 resolution. It can read rows 11, 512 and 1013 perpendicular to the di-rection of flight as the image array of the forward view, backward view and nadir view, respectively. The pixel number of linear array of each row is 512 columns, and the view angular difference among the views is 16.7 (Li Chunlai et al., 2010a). The CE-2 mission requires that the CCD stereo camera should have a resolution higher than 10 m (100 km above the lunar surface) and higher than 1.5 m (1.5 km above the lunar surface); meanwhile, stereo reconstruction requires a two-dimensional image with at least two view angles. The CCD stereo camera carried by CE-2 is designed to be an instant imaging system with a field angle of 42°, with the time-delay integral device TDI-CCD used. The camera has front and back views, with the angle between the two visual axes being 25.2°, which meets the stereo image reconstruction requirements for the base-height ratio higher than or equal to 0.45. When the sun altitude angle is larger than or equal to 5°, its stereo imaging capability still works (Wu Weiren et al., 2010). Their basic performance indices are listed in Table 3.
The CCD stereo camera of CE-1 obtained images within 70 degrees north latitude and 70 degrees south latitude of 508 orbits and polar region of 589 orbits and achieved 100% coverage of the lunar surface. The ground application system made the most complete image of the moon surface in terms of the image data of CE-1 (Ouyang Ziyuan et al., 2010; Li Chunlai et al., 2010a). The CCD camera of CE-2 completed all exploration missions by imaging with high resolution the entire moon with 7 m resolution on 100 km orbit, and the alternative landing area of CE-3 mission at the orbit height of 100×15 km (Fig. 1). During the lifetime of CE-2 between October 1, 2010 and May 20, 2011, the CCD camera obtained image data of 607 orbits. The 7 m resolution image of the entire moon made by the ground application system using the image data of CE-2 is the highest resolution image of the entire moon issued in the world up to now (see Fig. 2, and more detailed pictures in Li Chunlai et al., 2012), which provides more detailed scientific exploration data for scientific research on the moon and space.
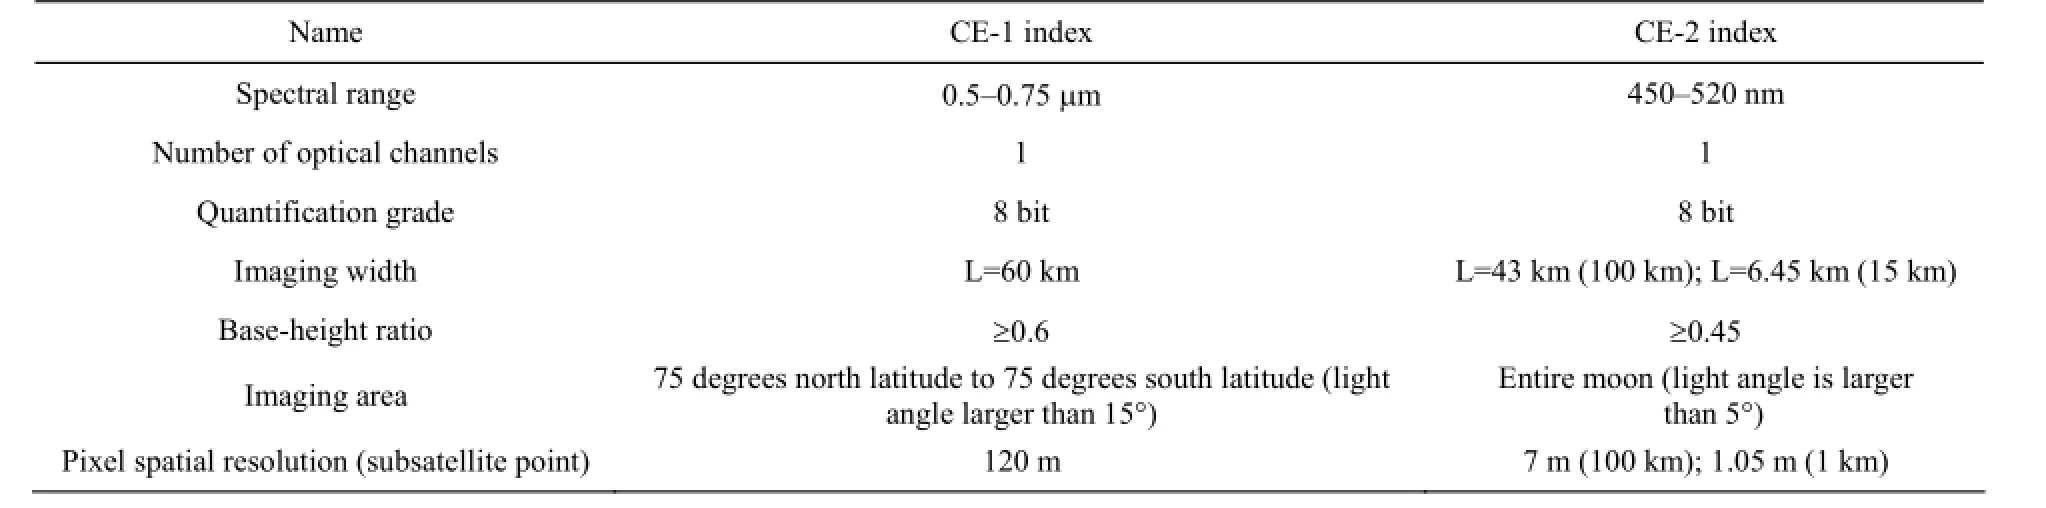
Table 3 Basic performance indices of the CCD stereo camera carried by CE-1 and CE-2
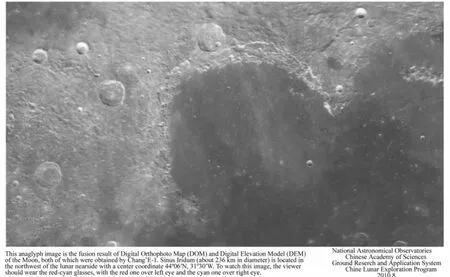
Fig. 1. Anaglyph image of Sinus Iridum.

Fig. 2. High resolution image of the entire moon from Chang’E-2.
2.3.2 Laser altimeter
The core of the laser altimeter is the laser ranging. It emits a high-energy short-pulse laser beam and receives the reflected laser signals from the lunar surface. It then calculates the distance from the satellite to the lunar surface by measuring the round-trip time. The total synchronizing pulse cycle of the laser altimeter carried by the CE-1 mission is 1 second, which means that one laser ranging data is provided per second. In order to improve the spatial resolution of the elevation measurement of the lunar surface, the CE-2 mission improves the laser altimeter by extending the maximum repetition frequency from 1 to 5 Hz, as shown in Table 4.
The laser altimeter of CE-1 collected approximately 9.12 million altimetry data of lunar surface, the most altimeter sampling data in the world at present (Li Chunlai et al., 2010b). The obtained 3-km resolution digital elevation model (DEM) is most accurate and has the highest resolution at present (see Fig. 3). The lunar gravity field and topographic features are analyzed and studied by using laser altimeter data of CE-1 (e.g. Yan Jianguo et al., 2008; Liang Qing et al., 2009). The laser altimeter of CE-2 only obtained a small amount of scientific exploration data due to the instrument failure.
2.3.3 Interference imaging spectrometer
The interference imaging spectrometer carried by CE-1 used the program of Sagnac interference imaging spectrometer of the push broom type based on the planar array. It is the first time that the interference spectral imaging technology was used in deep space exploration in the world. The Sagnac-type spatial modulation interference imaging spectrometer is a two-step imaging system. Briefly, a slit is located on both the front lens focal plane and object focal plane of the Fourier lens. The Fourier lens emits a parallel light that is focused in one direction by a cylindrical optical system. Compared with the conventional dispersive imaging spectrometer, the interference imaging spectrometer has the advantages of high energy efficiency, super continuous sampling, small volume of data, high spatial stability and spectra not influenced by the satellite attitude. The basic indices of CE-1 are listed in Table 5. The CE-2 mission did not carry this load.
The interference imaging spectrometer of CE-1 obtained valid exploration data of 706 orbits, covering the lunar surface area between 70ºN-70ºS of the moon (equivalent to 79% of the entire moon). The imaging spectroscopic data have a spatial resolution of 200 m and a spectral resolution from 7.6 to 29 nm within the spectral range of 480-960 nm. The spectral distribution graph of 32 spectral bands of the lunar surface coverage was obtained; the number of spectral bands of imaging spectral data of CE-1 is larger than that of the Clementine UVVIS spectrometer (5 spectral bands) and the spectral resolution is higher (Ouyang Ziyuan et al., 2010; Zhao Baochang et al., 2010). The data of the interference imaging spectrometer of CE-1 are used to investigate the composition of lunar surface elements and minerals (Figs. 4-6) (Ling Zongcheng et al., 2011a, b).
2.3.4 Gamma-ray spectrometer
The gamma-ray spectrometer is used to deter-mine the type and content of elements by detecting the energy and flux of gamma-ray, and to analyze the enriched region and distribution characteristics of various elements and materials. In the CE-1 mission, the main crystal used in the detector of the gamma-ray spectrometer is CsI crystal. In order to improve the exploration accuracy of the lunar surface elements, the main crystal in the gamma-ray spectrometer carried by CE-2 is replaced with the more highly efficient LaBr3. The basic indices are listed in Table 6.

Table 4 Basic performance indices of laser altimeter carried by CE-1 and CE-2
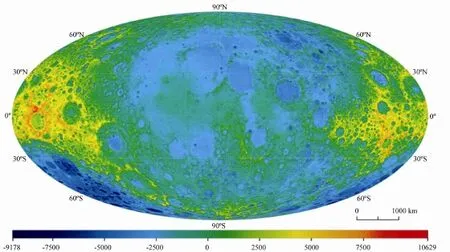
Fig. 3. DEM made by using altimetry data from the laser altimeter of CE-1.

Fig. 4. Distribution map of TiO2in the lunar Mare Crisium region.

Fig. 5. Distribution map of pyroxene in the lunar Mare Crisium region.

Fig. 6. Distribution map of FeO in the lunar Mare Crisium region.

Table 6 Basic performance indices of the gamma-ray spectrometer carried by CE-1 and CE-2
The gamma-ray spectrometer of CE-1 obtained the exploration data of 1103 orbits within an accumulated time of about 2105 hours revolving around the moon. Due to the limit of signal integration time, only the distribution and content of U, Th and K on the entire moon was extracted (Figs. 7—9); for Mg, Al, Si and Fe, Ti and other elements, only the regional content and distribution data could be extracted (Zhang Liyan et al., 2011; Zou Yongliao et al., 2011). The gamma-ray spectrometer of CE-2 obtained the exploration data of 2414 orbits, within a valid revolving duration of about 4682 hours. At present, the valid exploration data of 4682 hours are being analyzed and interpreted.
2.3.5 X-ray spectrometer
The scientific target of the X-ray spectrometer is to detect the fluorescence X-ray produced by Mg, Al or Si on the lunar surface due to the excitation of solar X-ray or cosmic ray. The contents and distributions of these elements on the lunar surface can then be obtained through data processing (Wang Huanyu et al., 2008). The performance and reliability of the X-ray spectrometer of CE-2 are improved from CE-1 by adding tens of grams of on-orbit calibration source. The detector on CE-2 uses semiconductor detectiontechnology with low-power consumption and highresolution features. Their basic performance indices are listed in Table 7.
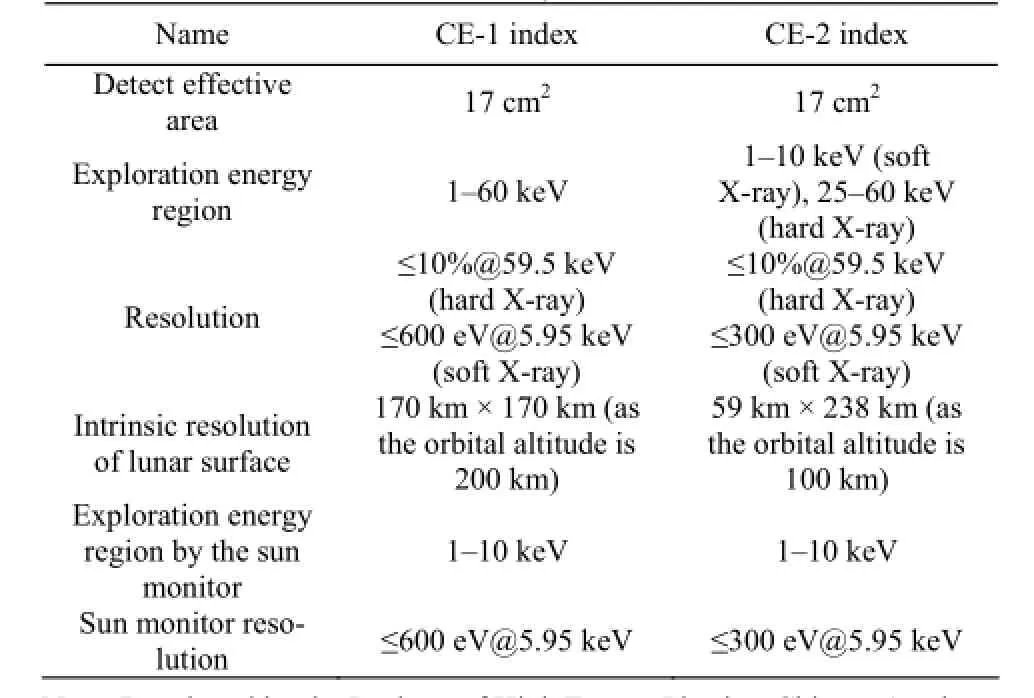
Table 7 Basic performance indices of the X-ray spectrometers carried by CE-1 and CE-2
The X-ray spectrometer of CE-1 obtained valid exploration data of 1761 hours. Due to the quiet solar activity during exploration, the collected data could only be used to make the partial content and distribution map of Mg, Al and Si. The X-ray spectrometer of CE-2 obtained the valid exploration data of 4682 hours revolving around the moon. Throughout that period, the time with solar X-ray flux larger than or equal to level B1 was about 134 days, accounting for 69% of the power-on time. Since there was no sunshine in the polar regions and the instrument did not start in part of the region, and observation for Mg, Al and Si only covers about 65% of the entire lunar surface. Observation for Ca, Fe and Ti will covers part of the region. At present, the valid exploration data of 4682 hours are being analyzed and interpreted.
2.3.6 Microwave radiometer (MRM)
The microwave radiometer (MRM) is mainly used for measuring the lunar regolith microwave black-body temperature (TBB) at different depths. Four frequency bands were set: 3.0, 7.8, 19.35 and 37 GHz. MRM used by the CE-2 mission fully inherits the technical setup of the CE-1 mission, but the decrease in orbit altitude of the CE-2 mission enables MRM to improve the exploration accuracy, accumulate data, and increase the lunar regolith exploration depth. MRM is the first technology in the world to adopt passive microwave remote sensing technology to measure the microwave radiation of the entire moon. Their basic performance indices are listed in Table 8.

Table 8 Basic performance indices of MRM carried by CE-1 and CE-2

Fig. 7. Potassium content distribution map of the Chinese first lunar exploration program.
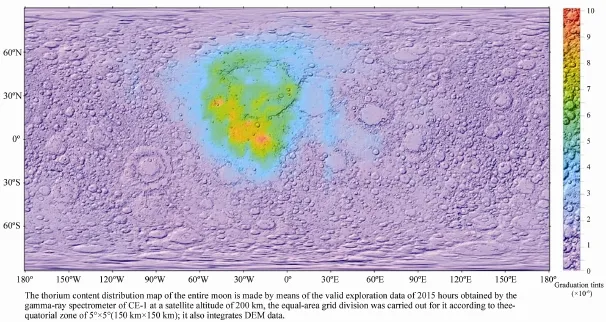
Fig. 8. Thorium content distribution map of the Chinese first lunar exploration program.

Fig. 9. Uranium content distribution map of the Chinese first lunar exploration program.
MRM of CE-1 obtained the exploration data of 1690 orbits. The data accumulating time was about 2642 hours. The data covered the entire surface of the moon many times (see Fig. 10). A large number of research results about the content, distribution and resources of3He and other gases on the lunar surface, as well as the thickness exploration of lunar regolith were obtained by using the data obtained from CE-1 (e.g. Wang Zhenzhan et al., 2009a, b; Chan K.L. et al., 2010; Zhang Dehai et al., 2009; Zheng Y.C. et al., 2012). MRM of CE-2 obtained the exploration data of 2401 orbits. The data accumulating time was about 4664 hours. The data covered the whole surface of the moon up to 8 times. At present, the valid exploration data are being analyzed and interpreted.
2.3.7 HPD
The main exploration objects of HPD are the charged particles in different forms from the sun, such as solar cosmic rays and solar particle events. Through the analysis of charged particle flux obtained at different times and in different spaces, the spatial distribution of particles and their motion characteristics in space can be obtained. HPD of the CE-2 mission fully inherits the CE-1 mission and is used to make up for the missed earth-moon space environment exploration data of CE-1, and further enrich the exploration data of the space environment near the moon. Their basic performance indices are listed in Table 9.

Table 9 Basic performance indices of HPD carried by CE-1 and CE-2
HPD carried by CE-1 obtained the valid exploration data of 1846 orbits with the accumulated time of 2868.5 hours. Preliminary analysis and comparative research of these data have discovered some unique physical phenomena resulting from their interaction with the Earth’s magnetic field and the charged particles of lunar surface, which has special significance for studying the solar radiation and its interaction with the Earth’s magnetic field and the planet (the moon). HPD carried by CE-2 has obtained the data of 2589 orbits.
2.3.8 SWID
The Solar Wind Ion Probe (SWID) was mounted on both the CE-1 and CE-2 spacecrafts and was designed to obtain the energy-time (E-t) spectrogram data of solar wind (SW) protons/ions in the vicinity of the Moon. The SWID instrument is composed of two identical electrostatic analyzers (ESAs) (hereafter SWID-A and SWID-B). The field-of-view (FOV) is~4.7°×182° for SWID-A and ~5.1°×183° for SWIDB, each of which is divided into 12 consecutive sectors. The geometrical factors for different sectors are roughly identical, ~8×10⁻⁵Sr cm2for CE-1 and~7×10⁻⁵Sr cm2 for CE-2. During the forward-flying phase, the FOV of SWID-A is vertical to that of SWID-B parallel with the spacecraft velocity. During the side-flying phase, the FOVs of the two units switch. Each of the two SWID units is divided into 48 channels logarithmically distributed between ~0.04 and ~20 keV per charge, with a sampling time of ~2.9 sec. for a full energy scan. The details of the SWID instrumentation have been presented in Wang X.D. et al. (2010, 2011). Their basic performance indices are listed in Table 10.
The traditional picture of the SW interactions with the lunar surface is characterized by the passive absorption of SW particles at the sub-solar side and the creation of a lunar wake at the anti-solar side. Detailed features include the thermal expansion of SW electrons into the lunar wake at the edge of the optical shadow and the subsequent build-up of the ambipolar electric field that drags the SW protons/ions into the cavities (e.g. Wang X.Q. et al., 2011). With the launch of several recent lunar satellites including CE-1 and CE-2, such traditional picture has been revolutionized and new features have been discovered (see Figs. 11-13).

Table 10 Basic performance indices of SWID carried by CE-1 and CE-2 satellites
3 Description and organization of the data
We used the NASA planetary data system (PDS) archiving standard to store our data. The image data stored in binary format and the tabular data stored in ASCII format are defined and described in terms of logical structure so that the user can use the data easily without knowing their specific information (Hughes J.S. and Li Y.P., 1993; McMahon S.K., 1996).
3.1 Data product structure
The raw data, level 0A data and level 0B data from the instruments of CE-1 and CE-2 are of binary format; data products of levels 1, 2 and 3 are of PDS format. Each data file consists of the data label describing the data and data objects. The data label and objects form data products through ODL language encapsulation. The data label describes the content and format of the associated data products. The information of the label is used to catalog various data products so that it can be searched directly and uniquely from its storage address or as a part of the search condition. The data labels use ODL language. The data objects can be divided into two major categories: scientific data and ancillary data. The scientific data refer to the raw data obtained by means of scientific observation or measuring instrument and data processing after calibrating and sampling, typically including tables, images, series, spectrum, etc. The ancillary data refer to the supporting data used for understanding and using scientific data, such as calibration file, geometric information and corresponding algorithm, which commonly use histogram, color palette and title head to indicate. For a data product, it has only one data label, written in front of the data object in the form of file header and forms a file with the data object together. The data element PRODUCT_ID in the label is the identity of this data product different from other data products, and its value is unique, as shown in Fig. 14.

Fig. 10. Daytime brightness temperature map of the moon from China’s first lunar probe Chang’E-1 (37 GHz).

Fig. 11. Acceleration of scattered solar wind protons at the polar terminator of the Moon observed by Chang’E-1/SWIDs.

Fig. 12. Observation of parallel curve events in Chang’E-2 orbit 0326.
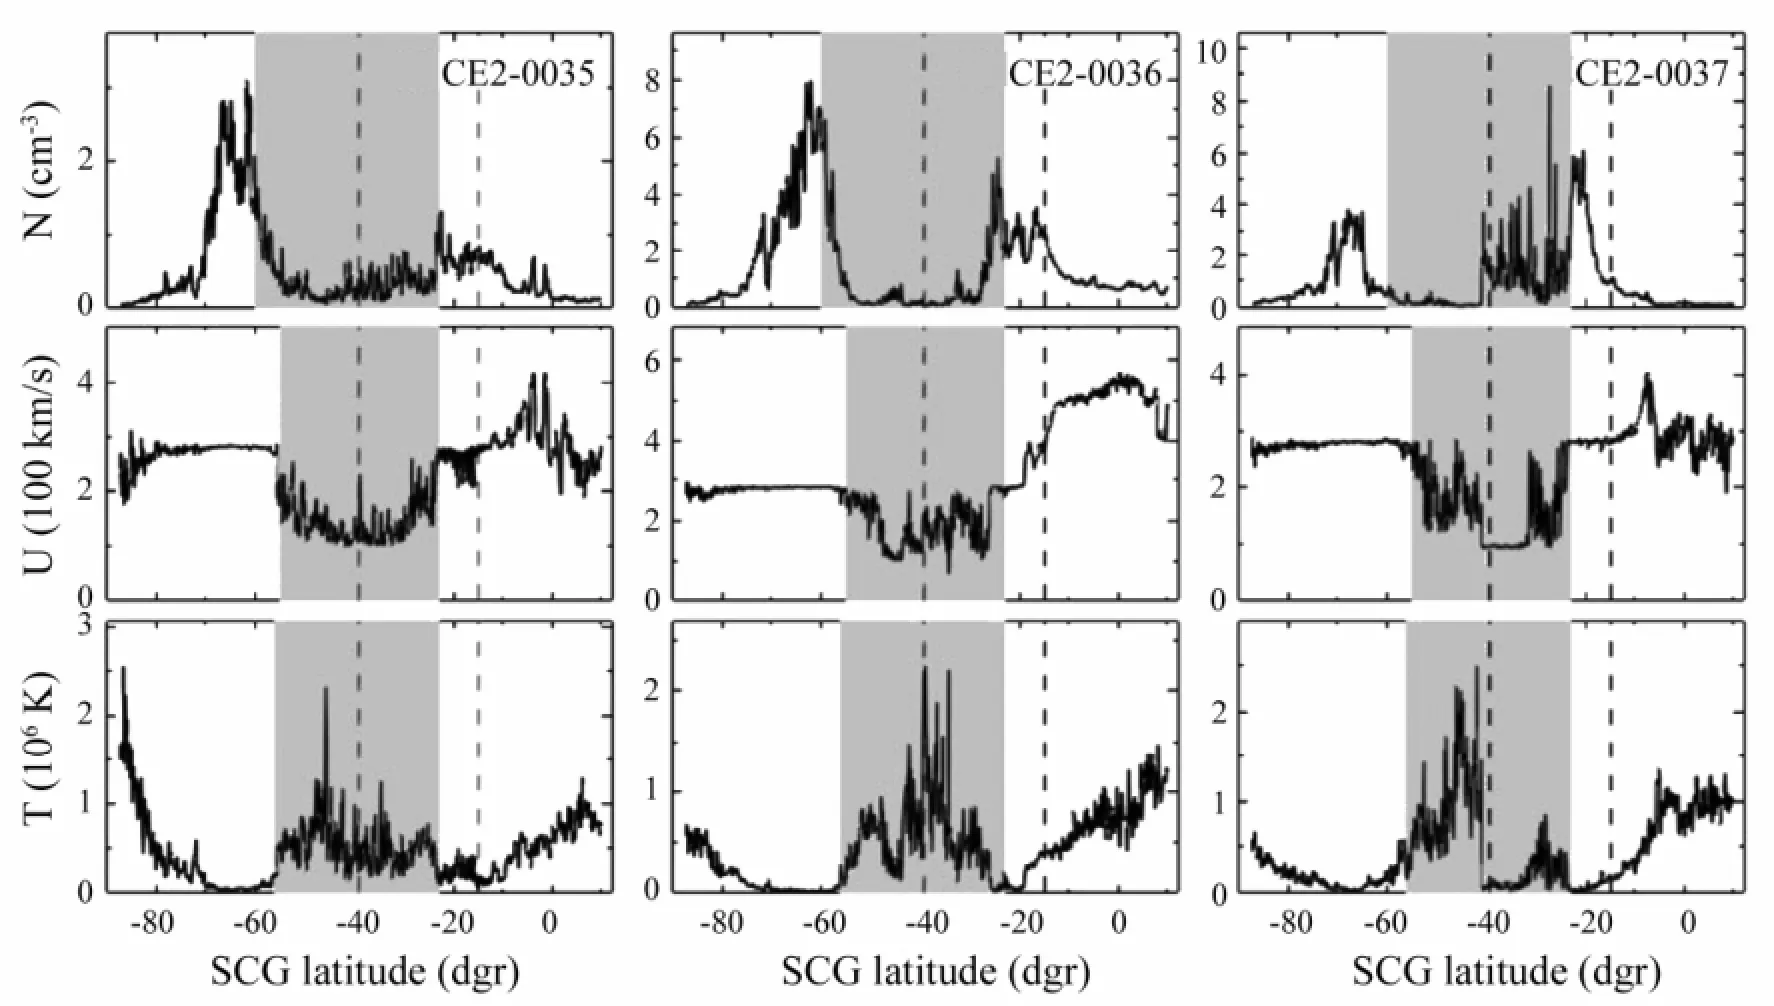
Fig. 13. The profiles of proton density, flow speed and temperature as a function of SCG latitude obtained from several Chang’E-2 lunar orbits near the proton cavities.
The content of a data label is divided into seven parts logically according to the sequence, including label standards identifier, file characteristic data elements, data object pointers, identification data elements, descriptive data elements, data object definitions and end statement, as shown in Fig. 15.
Data object definitions of the scientific data of CE program includes table, image, image_prefix, image_map_projection, image_map_location, column, etc. These data object definitions do not necessarily appear in a PDS label at the same time (jet propulsion laboratory, 2009, 2010a, b).
The file naming rules of data products of various levels are standardized, with the format as follows: CEx_st_yyyymmddhhmiss_ob.ext. The format of the data products of levels 0-2 is represented as: CEx_st_pl_ty_dc_yyyymmddhhmiss_YYYYMMDD HHMISS_ob_ver.lvRwhere CEx indicates the missionID, such as CE-1 and CE-2; st indicates the serial number of receiving station, such as BMGS (Beijing Miyun Station), YKGS (Yunnan Kunming Station), BMYK (after optimization of both stations); pl indicates the load source package names, such as CCD, LAM, GRS-A, GRS-B, etc; ty indicates the data product types, such as SCI (science data products), ENG (Engineering source package data), etc.; dc is the data time characteristics, such as R (D-channel real-time data), P (A1 channel playback data), N (mixed data); yyyymmddhhmiss indicates the time of the first group of data (UTC); YYYYMMDDHHMISS indicates the time of the last group of data (UTC); ob indicates the number of circles of orbits corresponding to the time of the first group of data; ver indicates the version of the product, from A (first version) to Z (final version); lv indicates the product level; lvR indicates whether it is the description file. The names of all lunar exploration data products use capital letters and adopt the universal time. Naming of the data products of level 3 may vary according to different loads.

Fig. 14. Data product structure.

Fig. 15. Logical division of the data labels.
3.2 Data set and data volume
Each instrument generates data products at various levels according to the orbits. The data products are stored and organized in the form of data subset and the data subset is stored and released in the form of volume.
The data throughout the life cycle of an instrument is defined as a data collection; the data of a level of an instrument and the auxiliary data products describing and using these data are defined as a data set, which is divided into several subsets according to the month of exploration. Each data set has a unique DATA_SET_ID and DATA_SET_NAME; the various data products of the same data set share DATA_ SET_ID and DATA_SET_NAME.
The concept of data volume is related to the capacity of physical storage media; if the capacity of the physical storage media is larger, such as tape, then the tape storing several data sets can be called a data volume, as shown in Fig. 16. If the capacity of the physical storage media is smaller, such as CD, then storing of a data set may need several CDs. Now this CD is also called a data volume.
A data subset can be composed of one or more volumes and several volumes constitute a volume set, as shown in Fig. 17.
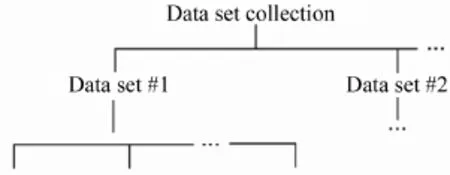
Fig. 16. Example of the data volume.
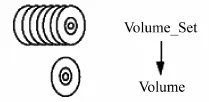
Fig. 17. Example of the data volume set.
3.3 Description of data examples
The PDS scientific data products above level 1 (including level 1) of each instrument of CE-1 and CE-2 are divided into two major categories: image data and tabular data. The data obtained by instruments of CCD camera and IIM are image data; the data obtained by several other loads are tabular data. The image data are stored in binary format, the logical structure of which block is defined by using TABLE, IMAGE, IMAGE_PREFIX, IMAGE_MAP_PROJECTION and other data elements in the data label 1. The tabular data are the list data in ASCII format, with the table structure defined with TABLE data elements. The value of each item is recorded in the form of a table. Due to limited space in this article, the scientificdata products of two instruments of CCD camera and GRS are selected as examples for the description of data in image and table, respectively.
3.3.1 CE-1 CCD Data
The data products released by the CCD camera of CE-1 include the data products of levels 01, 2 A, 2B, 2C and 03. A data file set is established for the data of each level with its directory structure shown in Fig. 18.
The data of levels 01, 2A, 2B and 2C of the CCD stereo camera have the same data label structure and component. All of them use IMAGE and IMAGE_PREFIX objects to define the pixel array of the actual image data and other ancillary data in prefix form (such as engineering data, check code, time label, etc.). IMAGE object defines the scope of the image data and the pixel number of each row of data. IMAGE_PREFIX object is a TABLE object in essence, which defines the range of its image prefix and the specific meaning of the physical parameters in each column of the prefixes. Because the auxiliary data contained in the image prefix of the data of various levels are different, the content of IMAGE_PREFIX object is different. In the label of the level 3 data, in addition to the description of the actual image data by the IMAGE object, the IMAGE_MAP_ PROJECTION object is also used to mark the key map projection information such as coordinate system, central longitude and latitude and so on.
The data products of levels 01, 2A, 2B, and 2C are generated based on orbits and the data of each orbit at various levels are divided into three data files: front, middle and back view, with the file names being indicated by CCD-F, CCD-N and CCD-B, respectively. The data products of level 03 are generated by geographical subdivision, mainly including 188 standard subdivision image data products of 120-m resolution (Hughes J.S. and McMahon S.K., 1998).
Based on the requirements on data resolution and map view, the global 50 m resolution image of the moon was divided into 188 subdivisions according to the longitude and latitude. The polar regions between latitudes 84°-90° north and south are represented by two separate images. The area within 84°N-84°S is divided into 12 projected sub-zones at 14° interval. In each sub-zone, from high latitudes to the equator, the longitudes of 45°, 30°, 24°, 20° and 18° are chosen as each longitudinal extent of each separated image, separating the area between 84°N and 84°S into 186 subdivisions. Thus, the lunar surface is divided into 188 subdivisions in total (see Fig. 19). The global 7 m resolution image of the moon was divided into 746 subdivisions, with each standard division being further divided into four equivalent subdivisions.

Fig. 18. CCD directory structure diagram.

Fig. 19. Subdivision diagram of the lunar global image.
To ensure the distortion in each subdivision is sufficiently small, the global image of the moon is divided into three zones: the equator-low latitude zone between 14°S-14°N, the middle latitude zones between 84°S-14°S and 14°N-84°N, and the polar region zone between 84°-90° north and south, adoptting Mercator projection, Lambert projection and Azimuthal projection, respectively. The images in the equator-low latitude zone adopt the normal Mercator projection with a secant of 7°, and the central meridian lies in the center of the image. Images in the middle latitude zone adopt the Lambert conformal conic projection; for each image, the central meridian is the mean value of the longitude range, and the secant is the mean value of the latitude range (refer to the following table for the projection parameters). In the polar region, the polar azimuthal projection is adopted, and the central meridian is 0°. The coding of the images is done in the direction from north to south and from west to east. The code for each subdivision contains four characters: the first indicates the altitude direction from the north pole to the south pole by using 14 letters from A to N; the second to the fourth characters indicate the meridian direction, starting from West Longitude 180° and breaking up according to the longitudinal extent scope listed in Table 11, coded according to the natural number serials of 001, 002, 003, etc.
3.3.2 CE-2 CCD data
The data products obtained from the CCD camera of CE-2 include the data products of level 01, 2C and 03. As the camera used 8-fold compression, the amount of data rose dramatically after decompression. In order to save storage space, the level 2 data only archived the data products of level 2C; the data products of levels 2A and 2B are not provided. The structure and description of the data of level 01 don’t have a big difference from those of CE-1; only the amount of attribute information of IMAGE_PREFIX object has increased from XXX to 10 columns of attribute information: Time, Image_Type, Gamera_View_ Direction, Orbit_Type, Frame_Counts, Hp, Grade, Gain, Dark_Pixel and Quality_State. The data of level 2C include a group of scientific data files (SCI) and grid files (GEO) corresponding to each other. SCI file contains the actual image data, and GEO file provides grid information on the corresponding SCI file. PDS label in the GEO file mainly includes the basic information on data files and TABLE object definition. Among them, the basic information on the data files mainly contains the basic background information on the file; table object definition mainly records 9 columns of physical properties: Time, Row, Column, Longitude, Latitude, Sun Incident angle, Sun Azimuth Angle, Instrument Incident Angle and Instrument Azimuth Angle. Specific examples are shown in Table 12. The row number and column number in each record refer to those of the corresponding image data, so the determined row and column numbers correspond to a specific pixel. The significance of each record refers to the pixel time, latitude and longitude, incident angle, phase angle and other specific values represented by the specified row and column numbers in the image data.
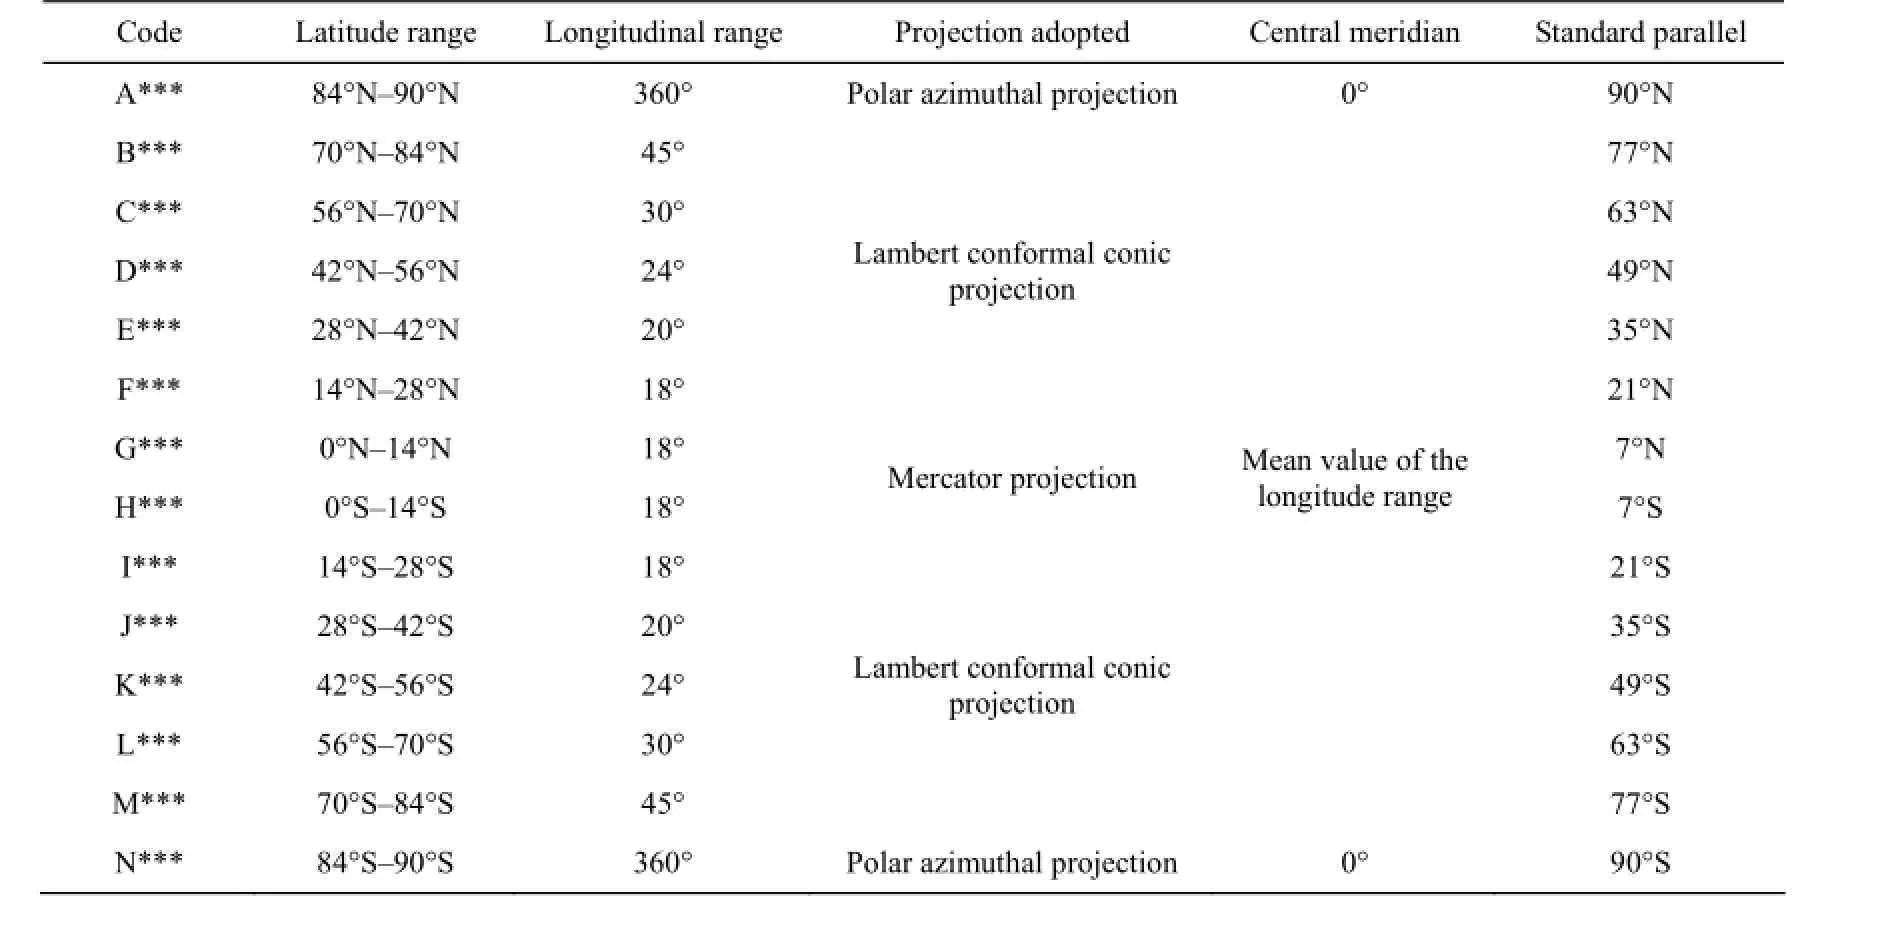
Table 11 Subdivision scope and coding of the lunar global images

Table 12 Example of TABLE object definition in the 2C-level data grid file of CE-2 CCD
The 2C-level data grid file is actually partially extracted from the Image_prefix of the 2C-level data of the CE-1 CCD camera and partially from a separate file. The main reason is that there is little value change in latitude and longitude, incident angle and phase angle between adjacent pixels, thus recording all relevant values of pixels does not make any sense. When positioning accuracy is ensured, one can select some values with certain intervals, so that not only the effective geometric positioning information can be provided, but also the file size is reduced greatly. Therefore, the selected part of data is separated from CE-2 to form the GEO file. It can be seen from the example of grid file that the recorded row and column numbers are not continuous.
The level 3 data products of the CCD stereo camera of CE-2 mainly include 188 standard subdivision image data products at 50 m×50 m resolution and 746 standard subdivision image data products at 7 m resolution. Except for file 03, each level 3 data product at 7 and 50 m resolution is also supported with two files with extension name of TFW and LBL. The LBL file gives the attribute information on the PDS header file of the level 3 data product extracted separately, for the convenience of readers; the TFW file is a text file about the image coordinate information, which defines the affine relation between the pixel coordinate and the actual geographical coordinate.
3.3.3 GRS science data
The data products released by GRS from CE-1 and CE-2 include those of levels 01, 2 A, 2B, 2C, etc. The data of level 01 include those of GRS-A instrument and GRS-B instrument. From level 2, only the GRS-A data are included. The GRS scientific data are tabular data, whose specific structure is defined by TABLE object in PDS label. Due to the difference in processing procedures of various data, the content of the data table structure of GRS products of different levels is different. The data products of level 01 include 9 columns of attribute information: Time, High_voltage_ Level, Sampling Time, AntiConsilient Switch, Self-Check State, Spectrum (energy channel from 1 to 456), Spectrum (energy channel from 457 to 512), Gamma-ray Spectrometer Temperature, Quality State. The 2A-level data products include 6 columns of attribute information: Time, High_voltage_ Level, Sampling Time, AntiConsilient Switch, Spectrum (512 energy channels) and Quality State; The 2B-level data products include 11 columns of attribute information: Time, High_Voltage_Level, Sampling Time, AntiConsilient Switch, Longitude, Latitude, Orbit Height, Instrument Incident Angle, Instrument Azimuth Angle, Spectrum (512 channels), Quality State; the 2C-level data products include 10 columns of attribute information: Time, High_Voltage_Level, Sampling Time, AntiConsilient Switch, Longitude, Latitude, Instrument Incident Angle, Instrument Azimuth Angle, Spectrum (512 channels) and Quality State; the data products of level 03 include 8 columns of attribute information: Record NO., Minimum Latitude, Maximum Latitude, Minimum Longitude, Maximum Longitude, Number of Accumulative Spectrum, Total Accumulative Time and 512 channels spectra. Description of the GRS data products of CE-1 and CE-2 is consistent with the organizational format. The following is an example of the 2B-level data, with the details shown in Table 13.
3.3.4 Other instrument data
In terms of the data structure, other instruments generally follow the same rules as CCD and GRS. The IIM instrument data are image data and use “Image”data object to describe. The data recorded by LAM, XRS, MRM, HPD, SWID and other instruments are tabular data and use “TABLE” object to describe, the same as the GRS data. For each instrument, “TABLE”object attributes of some instruments of the same level may vary between CE-2 and CE-1. For example, the level 01 data of XRS are stored as the source package data in CE-1, namely 122 unpartitioned case data in storage source package; however, what CE-2 stored are the 2B-level data of individual case data after 122 case data are partitioned in the source package; some geometric positional parameters are added for the XRS 2B-level data of CE-2 instead of CE-1.
In terms of data types, each instrument has its own characteristics. XRS includes three types of ex-ploration data: solar monitor rate meter data (XRS-SC), solar monitor spectrum data (XRS-SE) and lunar case data (XRS-L). MRM includes four types of exploration data: geometric positioning auxiliary file (MRM-A), calibration (MRM-C), moon observation (MRM-L) and temperature data (MRM-T). SWID includes two types of data: solar wind ion detector, instrument A (SWIDA), and solar wind ion detector, instrument B (SWIDB).
4 Data release
The Chang’E data are released to the general public according to the regulation Release and Management Methods of the Scientific Data from Moon Exploration Projects established by the Commission of Science, Technology and Industry for National Defense (CSTIND). The data release involves three stages: in-orbit test, the proprietary period and the public release period. During the period for in-orbit test and the proprietary period, the users must submit to the engineering center a user application form for lunar science data. Upon approval, the application for data retrieval will then be sent to the GRAS, who is expected to provide the appropriate data within 10 working days.
4.1 Data statistics
The CE-1 spacecraft has experienced an expected life-time of one year and an extended life-time of four months. During the entire life time, the GRAS has received raw data of ~1.5 TB, and the processing of these data leads to the data products of ~3.2 TB at various levels of various instruments. The statistics of the CE-1 data is shown in Table 14. For CE-2, from June 9, 2011 when it left the moon to July 5, 2012, (six-month planned life-time and a two-month extended life-time) the GRAS has received about 3.5 TB data, and the processing of these data leads to the data products of ~13 TB at various levels of various instruments. Up to now, the CCD data of levels 1-3 have been generated. For other instruments, the data of levels 2-3 are under processing. The statistics of the CE-2 data is shown in Table 15.
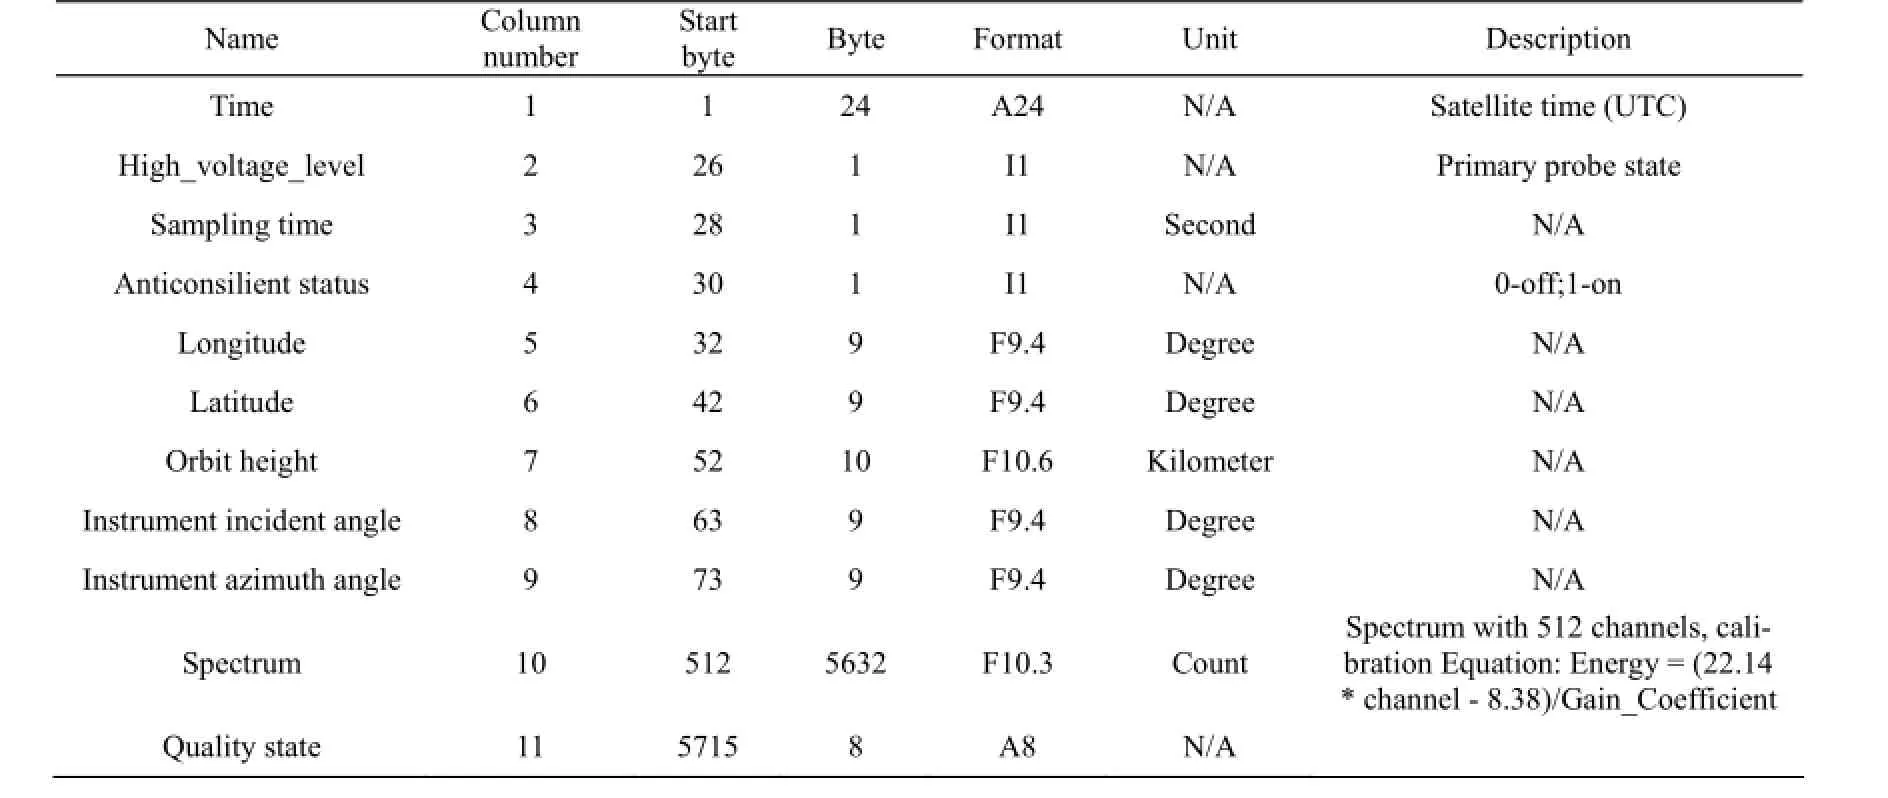
Table 13 Main definitions of 11 columns of attributes in Table object of GRS 2B-level data products

Table 14 Statistics for the scientific data of CE-1 (November 20, 2007-March 1, 2009)

Table 15 Scientific data statistics of CE-2 (October 1, 2010—July 5, 2012)
4.2 Data query and acquisition
The users should login to the GRAS website to obtain the CE-1 and CE-2 data (see Fig. 20). Both Chinese and English versions of the website are available. With a simple registration, the users are able to search and purchase the appropriate levels 2 and 3 data using the spacecraft name (CE-1 or CE-2), the instrument name, the starting time, the ending time, and/or the orbit number. Notification messages will be sent to the user’s email at various stages during the processing of the required data. Once the preparation of the data is completed and available for download, the users are able to obtain the data at the FTP site provided in the notification message. For some specific data or exceedingly large data, the users may also apply to obtaining the data by direct on-site copy.
Using the data results of CE-1, we have developed a lunar electronic map to provide intuitive visualization of lunar morphology for public users. One can query all moon name database information issued by IAU. With the entire moon image data of 50 m resolution of CE-2, we have developed the CE-2 data display system to show the entire moon morphology in the two-dimension and three- dimension forms to the public (see Figs. 21-22).Other functions of the system are still being improved.
4.3 Data release
The CE-1 data are currently in the public release period. The levels 2-3 data for all instruments are available for download by any interested user. Specifically, the CE-1 1:2.5 million DEM and DOM imaging data can be freely downloaded without the requirement of registration and submission of on-line application. In addition to the data in standard PDS format, advanced data products in other formats (jp2, tif, jpg) are also provided, such as the CE-1 laser DEM and DOM of the entire lunar surface (i.e., the lunar base map of Chang’E-1).
The CE-2 data are currently in the proprietary period. The instrument developing institutes may apply for the data at all levels closely related to the specific instrument, whereas general users may apply for data at levels 2 and 3. The release of the level 3 CCD data started on February 6, 2012, including 188 standard imaging frames at 50 m resolution, 746 standard imaging frames at 7 m resolution and the entire lunar image at 50 m resolution.
According to the regulations of data release and management as well as data application statistics, the GRAS had received 328 applications for the CE-1 data by June 2011, and has released data products of~8.2 TB for all the 8 CE-1 instruments to a total number of 52 institutes from the mainland of China, 4 from Hong Kong, Macao and/or Taiwan, and 12 from abroad. Till July 2012, the GRAS had received 135 applications for the CE-2 data, and has released data products of ~42.8 TB for all the 7 instruments, to 36 institutes from the mainland of China, and two from Hong Kong, Macao and/or Taiwan. In addition, by July 5, 2012, 2115 registered users had downloaded the data by logging into the lunar exploration data release system.
5 Conclusions
Based on the classification and level definition of the scientific data of CE-1 and CE-2, this article described the technical specifications of the instruments related to scientific exploration by CE-1 and CE-2, and introduced the research progress and results based on various data.
In the aspect of data management, this article described the concepts and definitions of scientific data product structure, data sets and data volume of CE-1 and CE-2, and explained the description and organization of data by using the CCD camera and GRS data as examples. The information provided in this article helps data users clearly understand relevant information of the data, thereby using them effectively.

Fig. 20. The Login interface of the lunar exploration data release system.

Fig. 21. The two-dimensional display system interface of Chang’E-2 data.

Fig. 22. The three-dimensional display system interface of Chang’E-2 data.
In the aspect of data release, this article summarized the statistics of the storage and the characteristics of the scientific data of various instruments, described the release system of the scientific data of Chang’E Program, introduced the query and access methods of data, and announced the release of all scientific data. Those types of information can help data users understand the overall release of Chang’E exploration program data, and provide users with effective ways and methods to facilitate access to scientific exploration data of Chang’E Program, and improve data utilization.
The management and release of the scientific data of Chang’E Program are being improved gradually. The focus of future work is described as follows: (1) as the instruments carried by various exploration missions and the data processing methods are different, further improvement and enrichment of lunar exploration and deep-space data and product standard system are necessary to promote exchanging and sharing of the data and maximize the utilization of the scientific data; (2) optimize the coordination system and methods for data integration, verification, approval and release to ensure the practicability and uniformity of the data release system; (3) enhance visualization methods for releasing lunar exploration data and enforce the power of results demonstration , so as to solve the problem of a massiveness of moon data and WAN distribution of multi-dimensional information, and to improve the visualization and characterization of information; (4) further develop control policies for secure access in order to meet needs of different businesses, different types of information and different users, and to establish a three-dimensional, multi-layer, multi-granularity security defense system.
AcknowledgementsThe Chang’E missions are the results of the joint efforts of the launch vehicle system, the satellite system, the measurement and control system, the launch site system as well as GRAS. The authors wish to express their grateful thanks to all the system members of the Chang’E missions, and Profs. Zhu Jianming, Cui Jun, Wang Xiangli, and Meng Lei for valuable suggestions during discussion and improving English writing. This research project is supported jointly by the National Science and Technology Major Project of the Ministry of Science and Technology of China and China Lunar Exploration Project and National High-tech R&D Program of China.
Chan K.L., Tsang K.T., Kong B., and Zheng Y.C. (2010) Lunar regolith thermal behavior revealed by Chang’E-1 microwave brightness temperature data [J].Earth and Planetary Letters.295, 287-291.
Hughes J.S. and Li Y.P. (1993)The Planetary Data System Data Model[C]. Twelfth IEEE Symposium on Mass Storage Systems.4, 183-189.
Hughes J.S. and McMahon S.K. (1998)The Planetary Data System—A Case Study in the Development and Management of Meta-Data for a Scientific Digital Library[C]. Lecture Notes in Computer Science. 1513, 335-350.
Liang Qing, Chen Chao, Huang Qian, Chen Bo, and Ping Jinsong (2009) Bouguer gravity anomaly of the Moon from CE-1 topography data: Implications for the impact basin evolution [J].Science in China Series G—Physics Astronomy. 52, 1867-1875.
Li Chunlai, Liu Jianjun, Mu Lingli, Zuo Wei, and Ren Xin (2012)The Chang’E-2 High Resolution Image Atlas of the Moon[M]. China Map Press, Beijing (in Chinese).
Li Chunlai, Liu Jianjun, Ren Xin, Mu Lingli, Zou Yongliao, Zhang Hongbo,Lü Chang, Liu Jianzhong, Zuo Wei, Su Yan, Wen Weibin, Bian Wei, Zhao Baochang, Yang Jianfeng, Zou Xiaoduan, Wang Min, Xu Chun, Kong Deqing, Wang Xiaoqian, Wang Fang, Geng Liang, Zhang Zhoubin, Zheng Lei, Zhu Xinying, Li Junduo, and Ouyang Ziyuan (2010a) The global image of the moon by the Chang’E-1: Data processing and lunar cartography [J].Science China—Earth Sciences.40, 294-306 (in Chinese).
Li Chunlai, Ren Xin, Liu Jianjun, Zou Xiaoduan, Mu Lingli, Wang Jianyu, Shu Rong, Zou Yongliao, Zhang Hongbo, Lü Chang, Liu Jianzhong, Zuo Wei, Su Yan, Wen Weibin, Bian Wei, Wang Min, Xu Chun, Kong Deqing, Wang Xiaoqian, Wang Fang, Geng Liang, Zhang Zhoubin, Zheng Lei, Zhu Xinying, Li Junduo, and Ouyang Ziyuan (2010b) Laser altimetry data of Chang’E-1 and the global lunar DEM model [J].Science China—Earth Sciences.40, 281-293 (in Chinese).
Ling Zongcheng, Zhang Jiang, Liu Jianzhong, Zhang Wenxi, Zhang Guangliang, Liu Bin, Ren Xin, Mu Lingli, Liu Jianjun, and Li Chunlai (2011a) Preliminary results of TiO2mapping using Imaging Interferometer data from Chang’E-1 [J].Chinese Science Bulletin.56, 2082-2087.
Ling Zongcheng, Zhang Jiang, Liu Jianzhong, Zhang Wenxi, Bian Wei, Ren Xin, Mu Lingli, Liu Jianjun, and Li Chunlai (2011b) Preliminary results of FeO mapping using Imaging Interferometer data from Chang’E-1 [J].Chinese Science Bulletin.56, 376-379.
McMahon S.K. (1996) Overview of the planetary data system [J].Planetary and Space Science. 44, 3-12.
Nishino M.N., Wang X.D., Fujimoto M., Tsunakawa H., Saito Y., Yokota S., Bian W., Li C.L., Matsushima M., Shibuya H., Shimizu H., Takahashi F., and Terasawa T. (2011) Anomalous deformation of the Earth’s bow shock in the lunar wake: Joint measurement by Chang’E-1 and SELENE [J].Planetary and Space Science.59, 378-386.
Ouyang Ziyuan, Li Chunlai, Zou Yongliao, Liu Jianzhong and Liu Jianjun (2010) The primary science result from the Chang’E-1 Probe [J].Science China—Earth Sciences.32, 249-254.
Wang Huanyu, Zhang Chengmo, Chen Yong, Liang Xiaohua, Cao Xuelei, Wang Jinzhou, Yang Jiawei, Gao Min, Zhang Jiayu, Peng Wenxi, and Cui Xingzhu (2008) The remote space X-ray imaging spectrometer system and its software for the moon exploration of Chang’E mission [J].Nuclear Electronics & Exploration Technology. 28, 215-222 (in Chinese).
Wang X.D., Bian W., Wang J.S., Liu J.J., Zou Y.L., Zhang H.B., Lü C., Liu J.Z., Zuo W., Su Y., Wen W.B., Wang M., Ouyang Z.Y., and Li C.L. (2010) Acceleration of scattered solar wind protons at the polar terminator of the Moon: Results from Chang’E-1/SWIDs [J].Geophysical Research Letters.37.
Wang X.D., Zong Q.G., Wang J.S., Cui J., Rème H., Dandouras I., Aoustin C., Tan X., Shen J., Ren X., Liu J.J., Zuo W., Su Y., Wen W.B., Wang F., Fu Q., Mu L.L., Wang X.Q., Geng L., Zhang Z.B., Liu J.Z., Zhang H.B., Li C.L., and Ouyang Z.Y. (2011) Detection of m/q=2 pickup ions in the plasma environment of the Moon: the trace of exospheric H2+ [J].Geophysical Research Letters.38.
Wang X.Q., Cui J., Wang X.D., Liu J.J., Zhang H.B., Zuo W., Su Y., Wen W.B., Rème H., Dandouras I., Aoustin C., Wang M., Tan X., Shen J., Wang F., Fu Q., Li C.L., and Ouyang Z.Y. (2011) The solar wind interactions with lunar magnetic anomalies: A case study of the Chang’E-2 plasma data near the Serenitatis antipode [J].Advances in Space Research. 50, 1600-1606.
Wang Zhenzhan, Li Yun, Jiang Jingshan, and Li Dihui (2009a) Lunar surface dielectric constant, regolith thickness and helium-3 abundance distributions retrieved from microwave brightness temperatures of CE-1 Lunar Microwave Sounder [J].Science in China—Earth Sciences.39, 1069-1084 (in Chinese).
Wang Zhenzhan, Li Yun, Zhang Xiaohui, Jiang Jingshan, Xu Chuandong, Zhang Dehai, and Guo Wei (2009b) In-orbit calibration of and antenna pattern correction to CE-1 Lunar microwave sound (CELMS) [J].Science in China—Earth Sciences.39, 1029-1044.
Wu Weiren, Zhang Rongqiao, and Hao Xifan (2010)Technical Manuals Of Ce-2 Mission Program of Lunar Exploration Phase Ii, Luna Exploration and Space Engineer Center[M]. Beijing Yu Xing Zhou Science & Technology Printing Factory, Beijing (in Chinese).
Yan Jianguo, Ping Jingsong, K. Matsumoto, and Li Fei (2008) The simulation of lunar gravity field recovery from D-VLBI of Chang’E-1 and Selene lunar orbiters [J].Advances in Space Research.42, 337-340.
Zhao Baochang, Yang Jianfeng, Xue Bin, Qiao Weidong, and Qiu Yuehong (2010) Calibration of Chang’E-1 satellite interference imaging spectrometer [J].Acta Photonica Sinica.39, 769-775 (in Chinese).
Zhang Dehai, Zhang Xiaohui, Wang Zhenzhan, and Dong Xiaolong (2009) Mechanism of lunar regolith layer depth sounding and ground validation experiment for the CE-1 lunar microwave sounder [J].Science in China—Earth Sciences.39, 1097-1104 (in Chinese).
Zhang Liyan, Zou Yongliao, Liu Jianzhong, Liu Jianjun, Shen Ji, Mu Lingli, Ren Xin, Wen Weibin, and Li Chunlai (2011) Time series data correction for the Chang’E-1 gamma-ray spectrometer [J].Research in Astronomy and Astrophysics.11, 737-750.
Zheng Y.C., Tsang K.T., Chan K.L., Zou Y.L., Zhang F., and Ouyang Z.Y. (2012) First microwave map of the Moon with Chang’E-1 data: The role of local time in global imaging [J].Icarus.219, 194-210.
Zou Yongliao, Zhang Liyan, Liu Jianzhong, Mu Lingli, Ren Xin, Zhang Guangliang, Chang Jin, Yan Jun, Zhang Nan, Zhang Hongbo, Lü Chang, Liu Jianjun, Zuo Wei, Su Yan, Wen Weibin, Bian Wei, Wang Min, Xu Chun, Li Chunlai, and Ouyang Ziyuan (2011) Data analysis of Chang’E-1 gamma-ray spectrometer and global distribution of U, K, and the elemental abundances [J].Acta Geologica Sinica.85, 1299-1309.
10.1007/s11631-014-0657-3
Received February 28, 2013; accepted April 25, 2013
© Science Press and Institute of Geochemistry, CAS and Springer-Verlag Berlin Heidelberg 2014
Chin.J.Geochem.(2014)33:024-044
杂志排行

Acta Geochimica的其它文章
- Zircon U-Pb age and Hf isotopic characteristics of the Huangtuliang monzonitic granite, North Hebei Province, China
- Petrography and geochemistry of Jumara Dome sediments, Kachchh Basin: Implications for provenance, tectonic setting and weathering intensity
- Efficiency of a re-usable Carius tube for determination of platinum group elements in ultramafic rocks
- Geochemistry of rare-earth elements in shallow groundwater, northeastern Guangdong Province, China
- Fluid inclusion, siliceous rock geochemistry of Shewushan lateritic gold deposit, Hubei Province, eastern China: Implication for the genesis of primary orebody
- Carbon and oxygen isotopes suggesting deep-water basin deposition associated with hydrothermal events (Shangsi Section, Northwest Sichuan Basin-South China)