Single channel source separation of radar fuze mixed signal based on phase difference analysis
2014-02-14HngZHUShuningZHANGHuichngZHAO
Hng ZHU,Shu-ning ZHANG*,Hui-chng ZHAO
aSchool of Electronic and Optical Engineering,Nanjing University of Science and Technology,Nanjing 210094,China
bUnit 73015 of PLA,Huzhou 313000,China
Single channel source separation of radar fuze mixed signal based on phase difference analysis
Hang ZHUa,b,Shu-ning ZHANGa,*,Hui-chang ZHAOa
aSchool of Electronic and Optical Engineering,Nanjing University of Science and Technology,Nanjing 210094,China
bUnit 73015 of PLA,Huzhou 313000,China
A new method based on phase difference analysis is proposed for the single-channel mixed signal separation of single-channel radar fuze. This method is used to estimate the mixing coeffcients of de-noised signals through the cumulants of mixed signals,solve the candidate data set by the mixing coeffcients and signal analytical form,and resolve the problem of vector ambiguity by analyzing the phase differences.The signal separation is realized by exchanging data of the solutions.The waveform similarity coeffcients are calculated,and the time-frequency distributions of separated signals are analyzed.The results show that the proposed method is effective.
Single channel source separation;Radar fuze signal;Phase difference analysis;Vector ambiguity
1.Introduction
The linear frequency modulation(LFM)and sinusoidal frequency modulation(SFM)signals,as non-stationary signals,become the most representative FM signals of radar fuze because of their good anti-jamming performance and low probability of intercept.Now many advanced radar fuze systems,such as the United States M734A1 and XXM733, German DM34,and Norway PPD440,use the FM radar fuze. In addition,the pseudo-random binary code and frequency modulation signal are also used in radar fuze system to obtain a better anti-intercept performance,such as the pseudorandom binary code and linearfrequency modulation (PRBC-LFM)signal,and the pseudo-random binary code and sinusoidal frequency modulation(PRBC-SFM)signal.Since the classical Fourier transform can't refect the frequency timevarying properties of non-stationary signal,the joint timefrequency analysis technique which can describe the relationship between signal frequency and time becomes an effective way to process such signals,such as Wigner-Ville distribution(WVD)and the smoothed pseudo Wigner-Ville distribution(SPWVD).
In battlefeld environment,the channel resources are limited,so it is very possible to receive the multi-component radar fuze signals in single channel.Thus it is hard to get the good results by using the joint time-frequency analysis technique to analyze the multi-component signal because of the cross terms and the time-frequency plane intersections. Therefore the technology of separating multi-component signals in single channel is very necessary in this case.But for the single-channel radar fuze mixed signal with complex timefrequency distribution,an effective method is based on the modulation structure of radar fuze signal,which can extract the phase modulation information,then reconstruct the signals for separation.For example,the modulation information of multiple linear frequency modulation(LFM)signals is estimated by using maximum likelihood estimation method in Ref.[1];the fractional Fourier transform is used to detect themulti-component signal and extract the modulation information in Refs.[2,3];and the energy operator is used to estimate the modulation information of multi-component signal in Ref.[4].However,the above methods cannot effectively separate the single-channel mixture with different modulation types when the time-frequency distribution is complex.
In this paper,a new method based on phase difference analysiswasproposed.Eventhoughthemultiplecrosspointsexistin the plane of time-frequency distribution and the component signalsaremodulatedindifferentmodulationtypes,themethod can also achieve good signal separation effect.
2.Signal model
2.1.Single channel mixed signal

Let us consider a simple but popular model of singlechannel mixed signal.It has the following matrix form where Y∈R1×Tis the mixed signal observed at a receiving end;A∈R1×Nis the mixing vector;S∈RN×Trepresents N source signals;and Vis the Gaussian noise.Eq.(1)can also be rewritten as

where y is a row vector,which represents the observed signal; siis also a row vector,which represents the ith source signal; and v is the Gaussian noise.According to the model,there is only one observed signal,called single-channel multiple component signal.Eq.(2)is an extremely underdetermined situation.
2.2.Radar fuze mixed signal
The signal mixed by radar fuze signals is considered here. Eq.(2)can be expressed as

where y(t),si(t)and v(t)are the received mixed signal,the source signal and the Gaussian noise,respectively;and ai,Aiand θi(t)are the mixing coeffcient,the amplitude and phase of each source signal,respectively.We usually assume that the amplitude Aiis 1.
Several kinds of radar fuze signals are considered in this paper,which have different phases.
(1)LFM signal

where fLFMis the carrier frequency;kLFMis the modulation rate;and φLFMis the initial phase.
(2)SFM signal

where fSFMis the carrier frequency;kSFMis the maximum modulated frequency deviation;ΩSFMis the modulation angular frequency;and φSFMis the initial phase.
(3)PRBC-LFM signal

(4)PRBC-SFM signal

where P is the length of pseudo-random sequence;Tcis the width of pseudo-random code;and ciis 1 or-1.
In Eq.(3),y(t)is the signal mixed by radar fuze signals when θi(t)is one of the four phase equations(4)-(7).Here we consider the case of N=2.
3.Estimation method of mixing coeffcients
For the separation of single-channel source,we can use the two-step method.The frst step is to estimate the mixing coeffcients,and the second step is to realize separation by mixing coeffcients.We should use the de-noising process with wavelet transformation introduced in Refs.[5,6]to cancel the Gaussian noise.According to Refs.[5,6],SNR of mixed signal should not worse than 9 dB,or the satisfactory results would be not got using the separating method in this paper.Themethod of estimating mixing coeffcients is mentioned in this section.
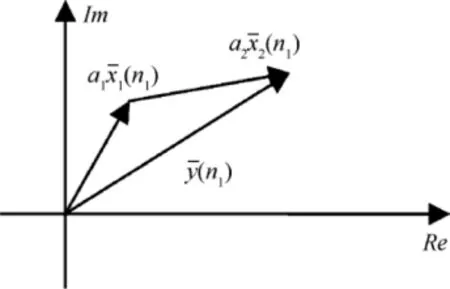
Fig.1.Signals represented as vectors in complex coordinate.
3.1.Probability distribution of radar fuze signal
In Ref.[7],the probability distribution of CW radar fuze signal was derived to give the following result

where A is the amplitude.
The odd moments obtained by calculating the statistics of this probability distribution are all 0,and their even moments are represented as

3.2.Estimating the mixing coeffcients by cumulants
Cumulants can be calculated by the moments.The relations of the second-order,forth-order and sixth-order cumulants with the moments are


The cumulants have the following properties
(1)For scalar a,cumk(ax)=akcumk(x);
(2)If x and y are statistically independent, then cumk(x+y)=cumk(x)+cumk(y).
For a mixed signal y(t)=a1x1(t)+a2x2(t),the two components are statistically independent.It can be known from the two properties mentioned above that

The mixing coeffcients can be obtained by solving Eq. (13).
4.Separation method of mixed signal
4.1.Structuring vectors with signal analytic form
Since an analytic signal can be represented as a vector in the complex coordinate system,the mixed signal vectoris the synthesis of the vectors,)and,of two components at the discrete timen1,whereandare the unit vectors of two components,and a1and a2are the mixing coeffcients,as shown in Fig.1.If the vector of mixed signal and the mixing coeffcients(a1and a2)are known,the component signals can be got.
Two intersections are gained by drawing a cycle with the radius a1at the origin of the coordinate plane and another cycle with the radius a2at the end point of the vector of mixed signal.The vectorsand)can be determined through any intersection,as shown in Fig.2.
Because there are two intersections,another pair of vectors can be got while)and)are obtained,as indicated in Fig.2 by dotted lines.In fact,because of the two intersections,two pairs of vectors can be got at each time,butit is hard to decide which pair of vectors corresponds to the two components.
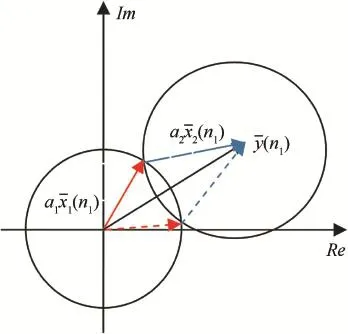
Fig.2.Solving process of the components.
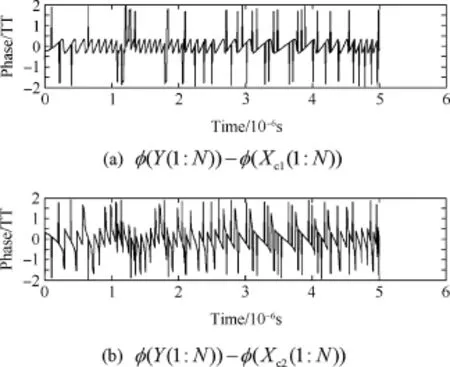
Fig.3.Phase differences before normalization.
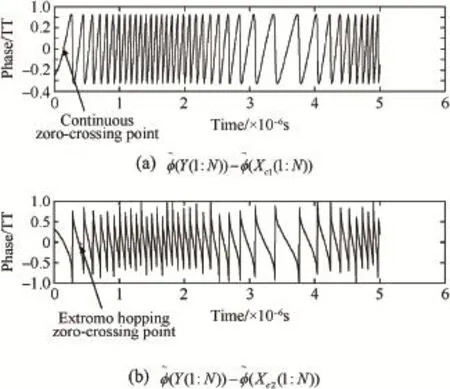
Fig.4.Phase differences after phase processing.


4.2.Resolving vector ambiguity by phase difference analysis
Resolving the vector ambiguity is to determine which one of the two solutions,X(1)(n)and X(2)(n),is the real solution at each discrete time n.
For two component signals,Xc1(1:N)and Xc2(1:N),the mixed signal, Y(1:N), and the phase differences, φ(Y(1:N))-φ(Xc1(1:N))and φ(Y(1:N))-φ(Xc2(1:N)),are calculated.The phase differences are shown in Fig.3.
In Fig.3,the phase differences are ruleless,so a phase is necessarily normalized.The processing rule of phase is expressed as follows:
a)Adding±2iπ(i=0,1,2,…)to the phases of components and mixed signal to make them all greater than 0;
b)If the component signal is in the counterclockwise direction of the mixed signal in the complex coordinate system, its phase should be greater than the phase of mixed phase; Instead,if the component signal is in the clockwise direction of the mixed signal,its phase should be less than the phase of mixed signal.
For example,the phases of component signals are 1.8π and 0.3π,and the phase of the vector of mixed signal is 0.1π.If 2π is added to 0.1π and 0.3π,respectively,then 0<1.8π<2.1π<2.3π.


Fig.5.Phase relation at continuous zero-crossing point.

Fig.6.Phase relation at extreme hopping zero-crossing point.

Fig.7.Combination of real and extraneous solutions.
It can be seen from Fig.4 that the curves of phase differences are regular,and there are the continuous and extreme hopping zero-crossing points.
For the continuous zero-crossing point in Fig.4(a),from the discrete time n to time n+1,the phase differences change as follows

This change is shown in Fig.5,where the extraneous solution is drawn by dotted lines.It is obvious that,at time n,the real solution is in the counterclockwise direction of mixed signal,and the extraneous solution is in the clockwise direction;but at time n+1,their positional relations have changed.
For the extreme hopping zero-crossing point in Fig.4(b), from the discrete time n to time n+1,the phase differences change as follows
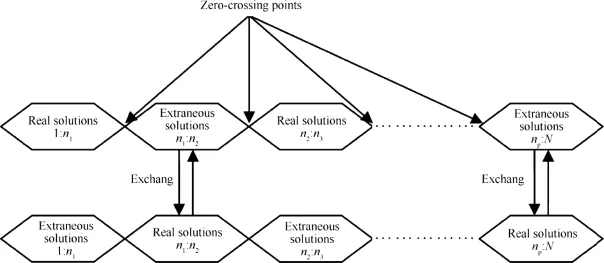
Fig.8.Data exchange process.
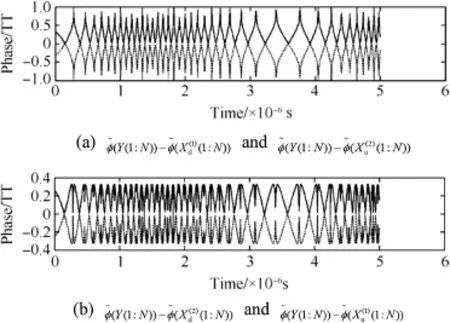
Fig.9.Phase differences between the vectors of mixed signal and solution.
The change is shown in Fig.6,where the extraneous solution is also drawn by dotted lines.The positional relations of real solution and extraneous solution have changed from time n to time n+1,too,and the phase of mixed signal has changed nearly π.
It can be found from Figs.5 and 6 that the positional relations of real solution and extraneous solution about mixed signal change before and after the zero-crossing points,so the X(1)(1:N)and X(2)(1:N)are actually the combinations of real and extraneous solutions,as shown in Fig.7.
If the locations of all the zero-crossing points B={n1,n2…np}are known,then two sets of solutions can be obtained by exchanging data.The data exchange process is shown in Fig.8.
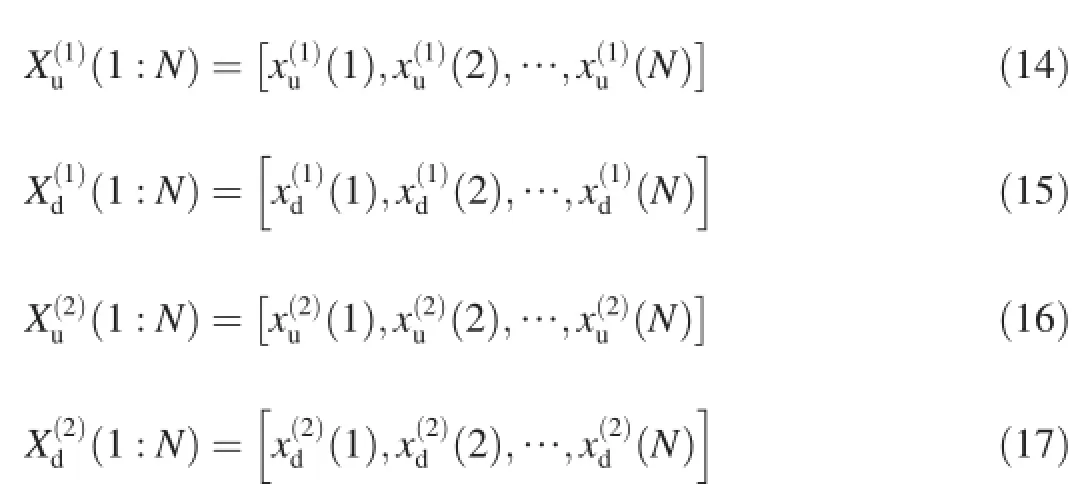
The fnal solutions are represented as
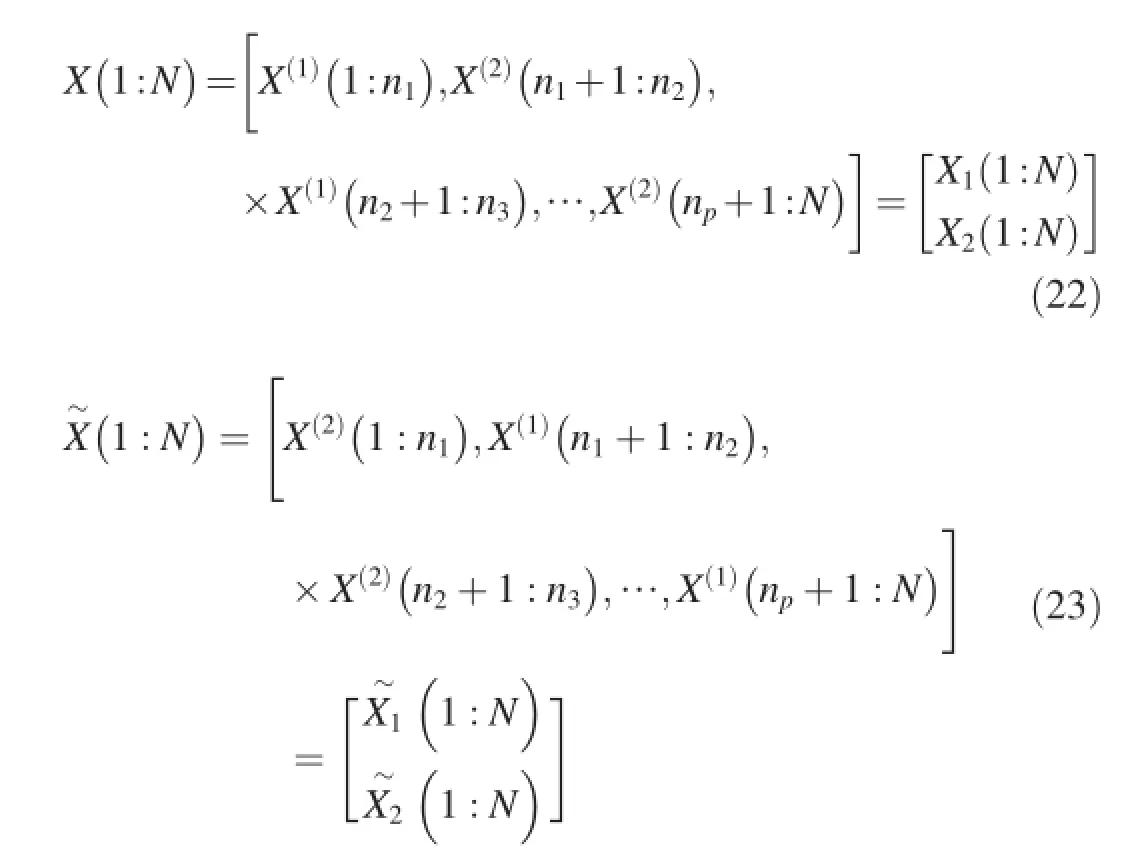
One of fnal solutions consists of all the real solutions from time 1 to time N,and the other consists of all the extraneous solutions.Commonly,the T-F(time-frequency)distribution of the array combined with all the real solutions is clearer than that of the array combined with all the extraneous solutions, which means that we can distinguish which of them is combined with all the real solutions by observing the T-F distribution.
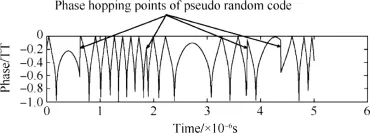
Fig.10.Phase hopping points of pseudo random code.

The plots of the phase differences,(1∶N)),can be drawn to get the locations of all the zerocrossing points,as shown in Fig.9.
It can be seen from Figs.5 and 6 that the common extreme points in Fig.9 correspond to all the zero-crossing points in Fig.4.Therefore,the locations of all the zero-crossing points B={n1,n2…np}can be got by fnding out the common extreme points in Fig.9.
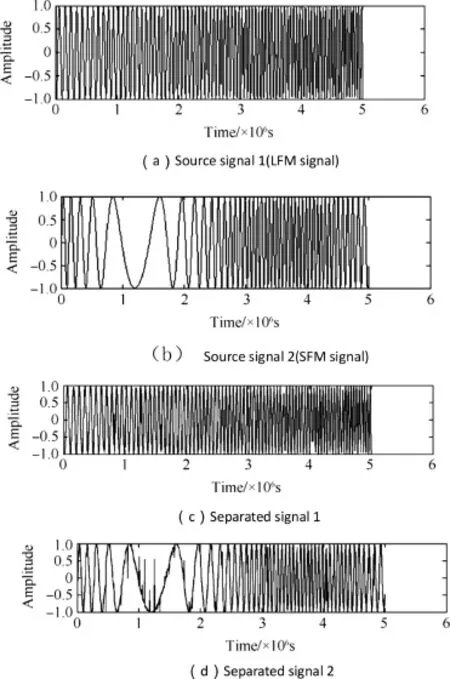
Fig.11.Issue 1:source and separated signals.

Fig.12.Issue 1:time-frequency distribution after separation.
In the case of component signal composited by pseudorandom code,the phase hopping points of pseudo random code sequence can also be found in the curves of phase differences.An example with phase hopping points of pseudo random code is shown in Fig.10.When the data is exchanged, except for the extreme points,these phase hopping points should be considered,too.
5.Simulation and analysis
In this section,the method proposed in this paper is used to realize the separation of two mixed signal.The following computational formula is used to calculate the similarity between two waveforms. where ρijis the value of similarity;yi(t)and sj(t)are two signals;E[·]is the expected value.

If the value of similarity is close to 1,it means that the waveform is well recovered;instead,if the value is close to 0, it means that the signals are not similar at all.Eq.(24)can be used to calculate the similarities of separated and source signals.
For the following two issues,the proposed method is used to separate the mixed signals,and the separation effect is measured by calculating the similarities.In issue 1,the mixed signal is mixed by an LFM signal and an SFM signal;in Issue 2,the mixed signal is mixed by a PRBC-LFM signal and an SFM signal.
In Issue 1,the LFM and SFM signals are mixed in single channel.For LFM signal,the carrier frequency is 10 MHz,and the frequency modulation rate is 2.65×10⁹Hz/s.For SFM signal,the carrier frequency is 9 MHz,the maximum frequency deviation is 8 MHz,and the modulation angular frequency is 40,000π Hz.The mixing coeffcients of LFM and SFM signals are 0.6 and 0.7,respectively,and their estimated mixing coeffcients are 0.5945 and 0.7187,respectively.The separation results are shown in Fig.11,the similarity coeffcients of separated and source signals are 0.9722 and 0.9552,respectively.Fig.12 shows the time-frequency distribution after separation.
It can be seen from Fig.11 that the source signals are almost recovered from the separated signals,but the values of the separated signals are very different from the source signal at some points.These points make the similarity coeffcients not exactly be 1.It can be seen from Fig.12 that the distribution of separated signals meets the requirement of extracting all the modulation coeffcients.
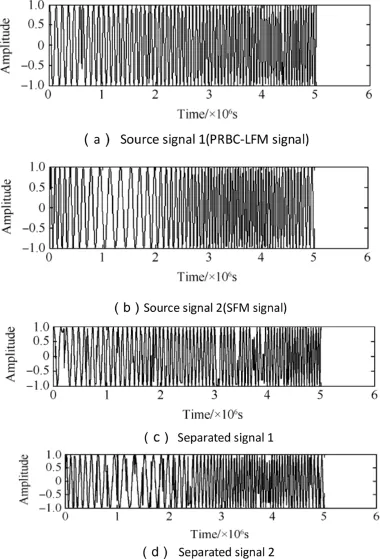
Fig.13.Issue 2:source and separated signals.

Fig.14.Issue 2:time-frequency distribution after separation.
In Issue 2,the PRBC-LFM and SFM signals are mixed in single channel.For PRBC-LFM signal which is composited by pseudo-random code and an LFM signal,the carrier frequency is 8 MHz,and the frequency modulation rate of LFM signal is 2.65×10⁹Hz/s.For SFM signal,the carrier frequency is 13 MHz,and the other parameters are the same as Issue 1.The estimated mixing coeffcients of PRBC-LFM and SFM signals are 0.5642 and 0.7346,respectively.The separation results are shown in Fig.13.The similarity coeffcients of separated and source signals are 0.9175 and 0.9053,respectively.Fig.14 shows the time-frequency distribution after separation.
It can be known from Fig.13 that the effect of separation is not better than that of Issue 1.That is because several crosspoints exist in the plane of time-frequency distribution.In Fig.14,the modulation coeffcients can be obtained from the distribution of separated signals,and the phase hopping points can be found from the distribution of PRBC-LFM signals.
6.Conclusions
A new method based on phase difference analysis was proposed for the single-channel mixed signal separation of single-channel radar fuze.This method was used to estimate the mixing coeffcients through the cumulants of the mixed signals,then the solutions of the component signals at all the time were obtained,and the separation was fnally realized by analyzing the phase differences between the vectors of mixed signal and solutions.The similarity coeffcients and the timefrequency distribution after separation were analyzed.The proposed method can be used to separate the mixed signal effectively,even in the situation that many crossing points exist in the plane of time-frequency distribution.
[1]Lin Y,Peng YN,Wang XT.Maximum likelihood parameter estimation of multiple chirp signals by a new Markov chain Monte Carlo approach. IEEE Proc Radar Conf 2004:559-62.
[2]Huang GM,Xiong G,Zhao HC,Wang LJ.Radio fuze signal reconnaissance based on fractional Fourier transform.J Electron Inf Technol 2004;27(3):431-3.
[3]Li JQ,Jin RH,Geng JP,Fan Y,Mao W.Detection and estimation of multicomponent LFM signals based on Gauss short-time fractional Fourier transform.J Electron Inf Technol 2007;29(3):570-3.
[4]Liu Y.A fast and accurate single frequency estimator synthetic approach. Acta Electron Sin 1999;27(6):126-8.
[5]Xue W,Guan FH,Chen LZ,Sun XW.Radar signal de-noising based on a new wavelet thresholding functions.Comput Simul 2008;25(8):319-22.
[6]Zhao S,Jiang HH,Zhang CL,Ke ZX.Radar signal denoising based on improved waveletthresholding functions.Ordnance Ind Autom 2011;30(7):1-3[in Chinese].
[7]Cheng H.Study on separation and parameter estimation for multicomponent signals.Chengdu:University of Electronic Science and Technology of China;2011[in Chinese].
Received 18 February 2014;revised 20 February 2014;accepted 21 March 2014Available online 31 July 2014
*Corresponding author.
E-mail address:a353eoenjust@163.com(S.N.ZHANG).
Peer review under responsibility of China Ordnance Society.
http://dx.doi.org/10.1016/j.dt.2014.07.006 2214-9147/Copyright©2014,China Ordnance Society.Production and hosting by Elsevier B.V.All rights reserved.
Copyright©2014,China Ordnance Society.Production and hosting by Elsevier B.V.All rights reserved.
杂志排行
Defence Technology的其它文章
- Analysis of equivalent antenna based on FDTD method
- Infuence of high frequency pulse on electrode wear in micro-EDM
- Combined proportional navigation law for interception of high-speed targets
- Numerical simulation of detonation of an explosive atmosphere of liquefed petroleum gas in a confned space
- Analysis on the resistive force in penetration of a rigid projectile
- Numerical simulation of base fow with hot base bleed for two jet models
