Development of Evaluation Technique of GMAW Welding Quality Based on Statistical Analysis
2014-02-07FENGShengqiangTERASAKIHidenriKOMIZOYuichiHUShengsunCHENDonggaoandMAZhihua
FENG Shengqiang *,TERASAKI Hidenri,KOMIZO Yuichi,HU Shengsun,CHEN Donggaoand MA Zhihua
1 Ningbo Branch of China Academy of Ordnance Science,Ningbo 315103,China
2 Joining and Welding Research Institute,Osaka University,Osaka 567-0047,Japan
3 Tianjin Key Laboratory of Advanced Joining Technology,Tianjin University,Tianjin 300072,China
1 Introduction*
Nowadays,demands for welding process reliability and on-line welding quality controllability and prediction are higher than ever before.For this reason,it has become increasingly important to develop efficient methods for evaluating welding quality.Advances in sensor and computer-related techniques have allowed a wide range of computer-based sensing techniques to be brought to use in monitoring welding quality,including acoustic emission techniques which contain information regarding the behavior of the arc column,the molten pool and droplet transfer[1–13],as well as techniques using optical sensors[14–16].Additionally,traditional nondestructive testing(NDT)methods and through the arc electrical sensing are also currently widely used for the credible examination of weld beads.
However,the methods mentioned above may be used for in-site detection,but there are several disadvantages such as high cost and low efficiency,which is critical for the development of gas metal arc welding(GMAW).Besides these disadvantages,the approaches adopted in some studies are rather complex and can be greatly affected by the environment especially in harsh conditions.Although electrical sensing has such advantages as not being affected by harsh industrial welding environments and not interfering with the welding process,it is difficult to interpret the complex electrical waveforms.In particular,when waveforms obtained from welding current and arc voltage in reference experiments differ only slightly from waveforms obtained when faults occur,it is difficult to recognize the difference.Therefore,it is important to find a more practical method to evaluate the welding quality intuitively.
In view of the above,some statistical methods,mainly involving the Taguchi method or grey-based Taguchi methods have been applied in the field of welding.However,these methods were applied in welding not to evaluate the welding quality but determine optimal parameter settings for the welding process.In particular,JUANG and TARNG[17]used the Taguchi method to find an optimal weld bead geometry for a tungsten inert gas welding process.PAN,et al[18],determined optimal welding process parameters by using grey-based Taguchi methods.In another work,TARNG,et al[19],used fuzzy logic with the Taguchi method to select optimal process parameters.
This paper deals with the development of real-time monitoring equipment to evaluate welding quality in GMAW.In previous study,on-line quality monitoring of the welding process needed to use commercial facilities which were too expensive to be applied widely[20].However,in this study,the system does not monitor droplet transfer or motion of the molten pool but assesses weld quality directly and quantitatively.Therefore,the hardware used for the proposed system is relatively simple,which should contribute to increasing efficiency and decreasing costs.Welding current and arc voltage acquired easily from the welding process form the focus for analysis.In this paper,a novel algorithm is presented to analyze data using methods of signal processing and statistical disposition including Mahalanobis distance(MD)and normal distribution in order to evaluate welding quality in real time.On the basis of this algorithm,a new piece of equipment has developed,which is referred to here as the Weld Quality Tester(WQT).
The system described in this study is also extremely versatile and flexible in that it can be applied to all arc welding.The reason for this is that the system utilizes only measured values of welding current and arc voltage,which are hardly affected by the external environment.
2 Developed Algorithms
The analytical methods of the proposed system are based on MD and the normal distribution.MD is a distance measure introduced by Mahalanobis P C in 1936,which is based on correlations between variables by which different patterns can be identified and analyzed.It is a useful way to determine the similarity between an unknown sample set and a known one.MD is widely used in cluster analysis and classification techniques especially in the field of biology;e.g.,in predicting protein structural class,membrane protein type,protein sub-cellular localization,as well as many other attributes of proteins through their pseudo amino acid composition.
The calculation of MD is described in the field of statistics,and is commonly used for multivariate outlier detection.MD is superior to other multidimensional distances,e.g.Euclidean distance,because its calculation involves a covariance matrix which takes into account the distribution and size of points.For a p-dimensional multivariate sample x1,x2,…,xn,the MD is defined as follows:where μ is estimated multivariate location and C is estimated covariance matrix.Generally speaking,μ is multivariate arithmetic mean and C is sample covariance matrix.For normally distribution data,the value ofis approximately chi-square distributed with p degrees of freedom().

In this study,data obtained from the experiments only consist of values of welding current and arc voltage.As a result,2 degrees of freedom are used.Typically data blocks of sampled points of welding current and arc voltage are collected over one second,as shown in Fig.1.The data shown in Fig.1(a)are obtained from a weld without faults and those shown in Fig.1(b)are from a bad weld.It can be seen that the distribution of data shown in Fig.1(a)is more concentrated than that shown in Fig.1(b).
Fig.2 shows the transform voltage and current.Correspondingly,the data shown in Fig.2 are obtained from the data in Fig.1 by normalizing.It can be seen that the data from a reference weld Fig.2(a)are located near the center.However,the distributions of data shown in Fig.2(b)are deviated from the point of origin and incline to the right.According to the concept of MD described above,the more the data inclines to the right,the worse the welding quality is[21].

Fig.2.Typical transform welding current and arc voltage
If MD is defined to be equal to a certain constant,it is possible to have different ellipsoids with the same MD value from the center.To demonstrate this,extracted data is shown in Fig.3.It can be seen that there are altogether one circle and three ellipses corresponding to the quartiles 0.5,0.75 and 0.98 ofThe radius of the circle is the distance from point A to the center or from point B to the center.
That is,points A and B are located on the same circle and the Euclidean distances of two points are equal.However,in order to find multivariate outliers,not only the distance of an observation from the centre of the data but also the shape of the data must be considered,which shows the superiority of MD to other distances such as the Euclidean.With this concept,points A and C lying on an ellipse have the same distance from the centre.MD considers the shape of the data cloud and has potential for more reliably identifying extreme values.According to this concept of MD,a multivariate outlier can be defined simply as an observation with a large MD.In other words,a larger MD illustrates the existence of an outlier.For the purpose of quality control,a larger MD signifies a worse quality.Meanwhile,for this study,the magnitude of the compared values of MD is an indicator of whether a welding fault has occurred,with a large distance indicating a fault.
Whether the quality is good or not the multivariate outliers only can be defined as observations with a large MD.In order to provide reliable measures for the recognition of outliers,however,Eq.(1)described above should be transformed,and meanwhile,a robust procedure is compiled with Matlab software.The transformed formula is shown below:

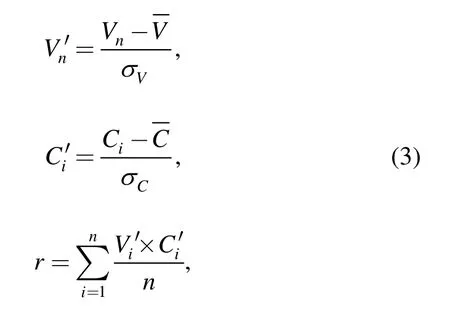
3 Quantification of Welding Quality
Besides MD,the concept of the normal distribution is of importance to the detection system proposed in this paper.The normal distribution is described by the density function shown below:

where μ(mean)and σ(standard deviation)are two important parameters which decide the position and style of data,respectively.There are three important“zones”in this distribution.For the normal distribution,the range of–1σ to+1σ from the mean accounts for about 68% of the set,while the range of two standard deviations from the mean accounts for about 95%,and that for three standard deviations from the mean accounts for about 99.6%[21].According to general quality control(QC)and the concept of the normal distribution,the threshold for considering a point to belong to the distribution is commonly set to±3σ.That is to say,under this assumption,if the results are within the range of±3σ,they are considered to be correct and not outliers.
In this study,the distribution of each MD value is assumed to obey the rule of the normal distribution.However,MD values are always greater than zero.In this study,therefore,the range of the acceptability is from zero to μ+3σ.In other words,as long as values of MD calculated from welding current and arc voltage lie in the range from zero to μ+3σ,welding quality is considered to be good.Conversely,if values of MD lie outside this range,welding quality is poor.The farther from the range,the worse quality is predicted to be.
In order to clarify the manner in which the concepts of MD and normal distribution are applied in the proposed system,a specific example is introduced.In this study,the MD values are considered to be normally distributed and 8192 values of MD obtained in one second are examined.Through the calculation of mean and standard deviation,a normal distribution is defined as in Eq.(4).A reference of MD values in the range from μ to μ+3σ obtained from a good weld should be set first and artificially,and then other MD values compared with the reference.
Fig.4(a)shows a histogram which describes the distributions of 8192 values of MD from a weld with a good quality.According to the properties of the normal distribution,the maximum value occurs at the position x=μ.Therefore,as seen from Fig.4(a),many data are located near the position x=μ.Fig.4(b)shows a curve modeling the standard deviation obtained from the data in Fig.4(a).As described above,the data shown in Fig.4(a)and Fig.4(b)are regarded as a reference.Fig.4(c)shows the frequency of the data from a weld with a bad quality.Obviously,the distribution of the data shown in Fig.4(c)exhibits more variance.In this study,data located within the range from zero to μ+3σ are defined as“healthy”.Conversely,data beyond this range is considered“unhealthy”.Consequently,data on the left-hand side of the dotted line located at the position of x=μ+3σ is normal.However,data on the right-hand side of the dotted line shown in Fig.4(c)are not normal.It is clear,then,that welding quality can be quantified as per Eq.(5)shown below:

where n is the number of data on the left-hand side of the dotted line,and N is the total number of the data obtained in one second.(As noted above,in this study,the latter value is 8192.)
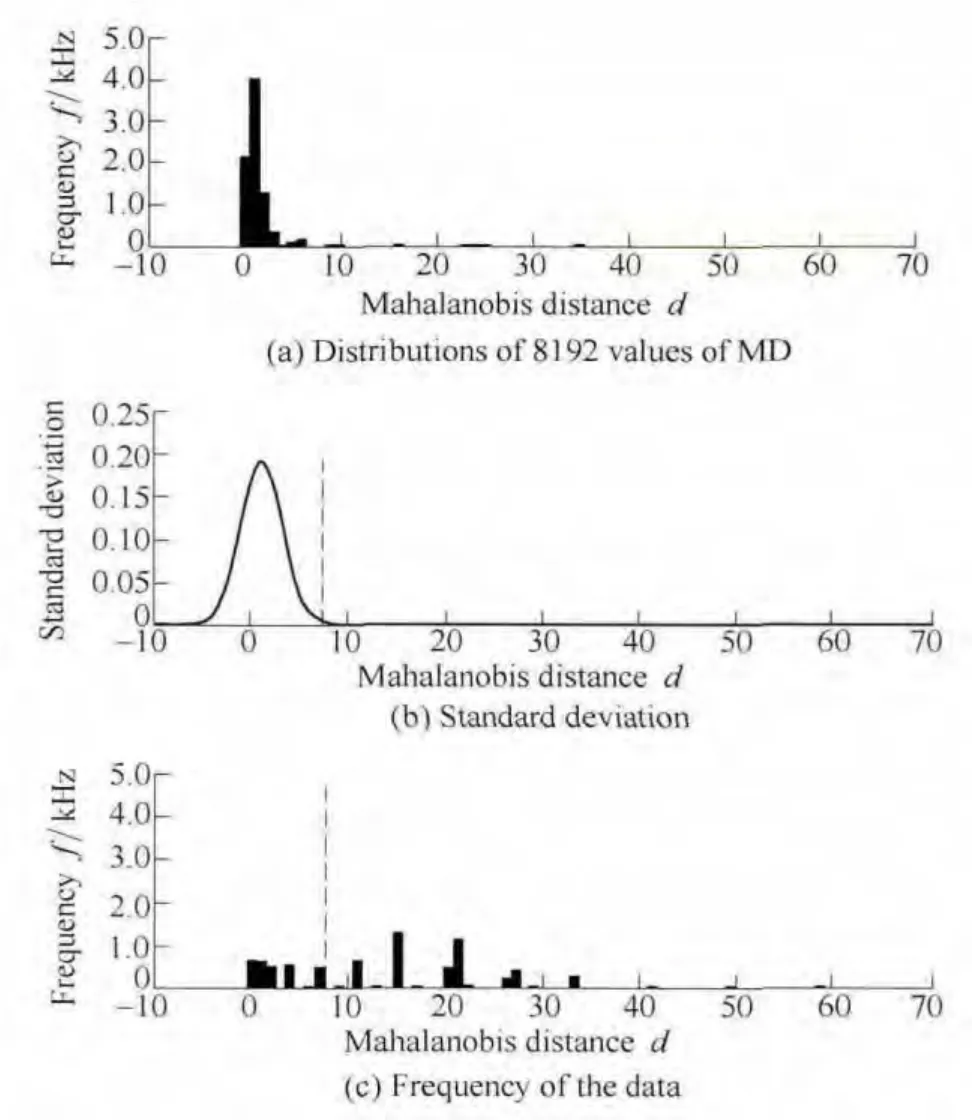
Fig.4.Histogram of values of Mahalanobis distance
According to the theory above,a new piece of equipment named Weld Quality Tester(WQT)was developed.The WQT has the capability to detect and quantify welding quality in real time,from which the level of welding quality can be evaluated.
4 Experiment Procedures
In order to verify the usefulness and application of the WQT,two experiments were performed.The experimental set-up is shown in Fig.5.A welding power source CPDP-500(S-1)with a wire feeder CMWH-231 was used.The welding torch was fixed on a fixture,which made the torch stationary.Thus,the stability of welding was guaranteed.The weldment was fixed on a trolley controlled by a speed controller which was able to change the welding speed artificially.The consumable electrode was MG-50T,Φ=1.2mm.The substrate used in this study was commercially SPH370 whose chemical composition is given in Table 1.A mixture of 80%Ar+20% CO2was employed as the shielding gas.
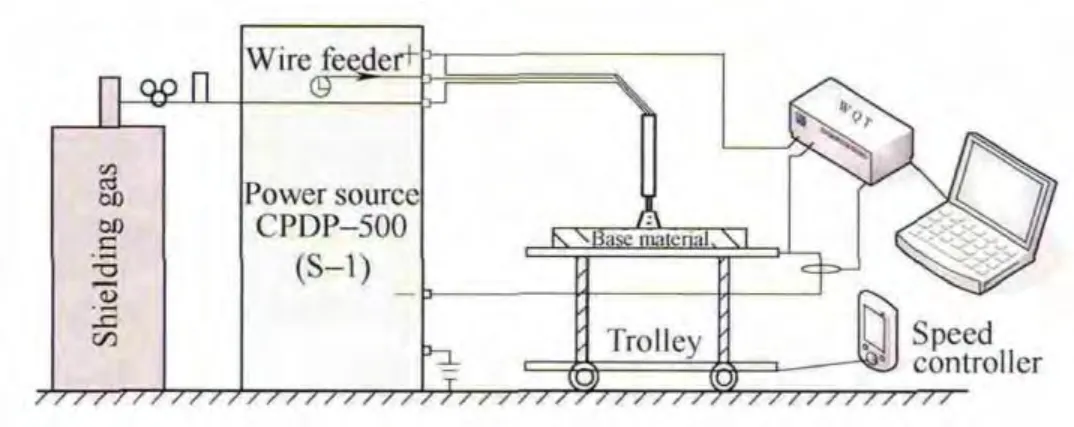
Fig.5.Schematic diagram of experimental setup

Table 1.Mass fraction of the substrate(wt.%)
Two experiments were performed based on changing two parameters:flow of the shielding gas and paint on the surface of the substrate.Welding speed and wire feed rate for the two experiments were identical:50 cm/min and 150 cm/min respectively.In the first experiment,the total length of the bead was about 14 mm,and the flow of the shielding gas was changed from 15 L/min to 0 rapidly at the range from 4 mm to 10 mm.In the second experiment,paint was smeared on the surface of the substrate.After the paint dried,the experiment was performed.The length of the paint was about 7 cm at the latter part of the substrate.
The welding process was monitored in real time by measuring the welding current and arc voltage with the WQT as shown in Fig.5.By using the WQT,a computer,and software based on the concept of MD related to WQT,signals were processed and compared with welding process and weld characteristics.The quantified welding quality was calculated and shown synchronously in a computer,which enabled us to evaluate the welding quality in real time.
5 Results and Discussion
The voltage used for analysis was obtained directly from the power source.Current was sampled with a current clamp according to the electromagnetic testing principle.Typical signals of welding current and arc voltage obtained from a reference experiment and sampled by using the WQT are shown in Figs.6(a)and(b)respectively.
Seen from Figs.6(a)and(b),there are some data on the top of the figure.These data represent the quantified welding quality.Shown in the figures,data from 2 seconds to 3 seconds is regarded as the reference because,at the very beginning of the welding,the process is unstable and welding quality is worse compared with other parts.However,the welding quality at the end is the worst during the whole process,which results from an artificial increase of arc length.The excessive increase of the arc length correspondingly tends to cause a slight decrease of the welding quality.Therefore,the welding quality in the last second is only 95.9%.
The solid line shown in Fig.7 shows the quantified welding quality obtained from the data plotted in Fig.6.In this study,the threshold value of the welding quality is defined to be 95%,which is plotted with dash line.That is to say,if the values of quantified welding quality are all above the threshold value,the welding quality may be considered good;instead,if the values of the quantified welding quality are below the threshold value,the welding quality is poor.
5.1 Effects of flow of shielding gas on welding quality
Fig.8(a)shows the fashion in which MD values vary in relation to changes in the rate of shielding gas.For the first six seconds,the flow of shielding gas was constant and remained at 15 L/min.After six seconds,the flow of shielding gas decreased rapidly and remained closed for about seven seconds.Then the value of the flow of shielding gas was changed to 15 L/min again.The averages of arc voltages are shown in Fig.8(b).Compared with welding quality shown in Fig.8(a),the changes of the average arc voltage are not noticeable.As expected,the values of MD have the ability to quantify the welding quality.
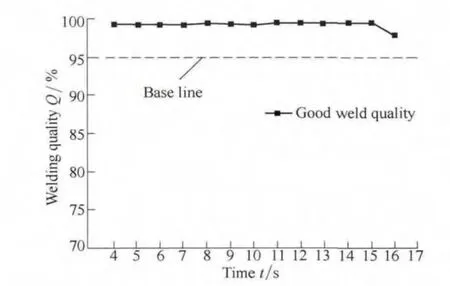
Fig.7.Referenced base line quantified welding quality
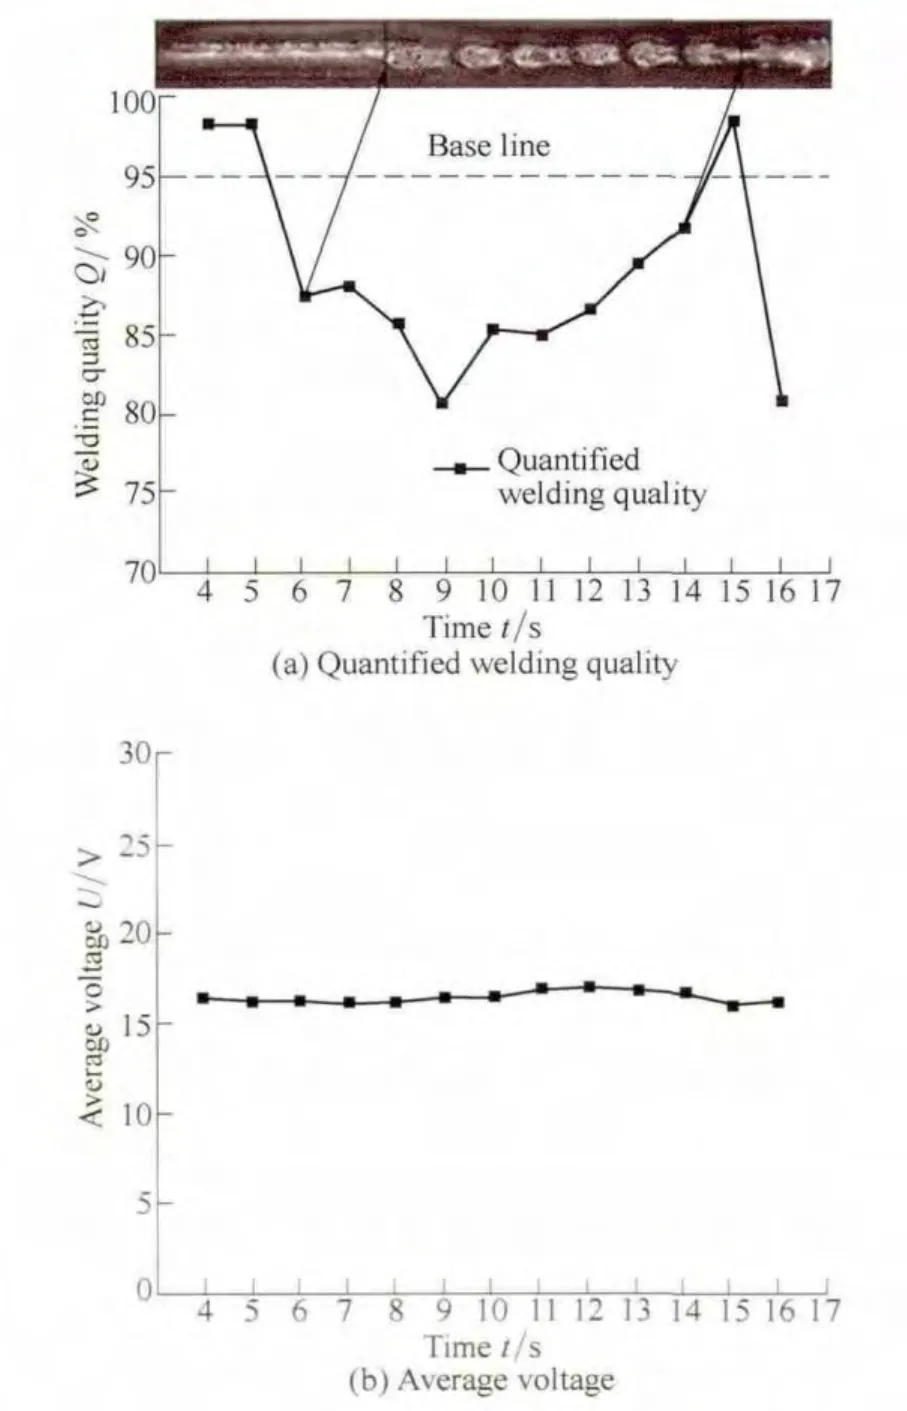
Fig.8.Macrostructure of a welding bead and quantified welding quality and average voltage
5.2 Effects of paints on welding quality
Welding quality is sensitive to the presence of paint.The welding quality of parts with paint is rather poor,which is shown in Fig.9(a).The poorest value is below 75%.This clearly shows that paint has a great influence on welding quality.Similarly,this influence can not be seen clearly from the average of arc voltage shown in Fig.9(b).
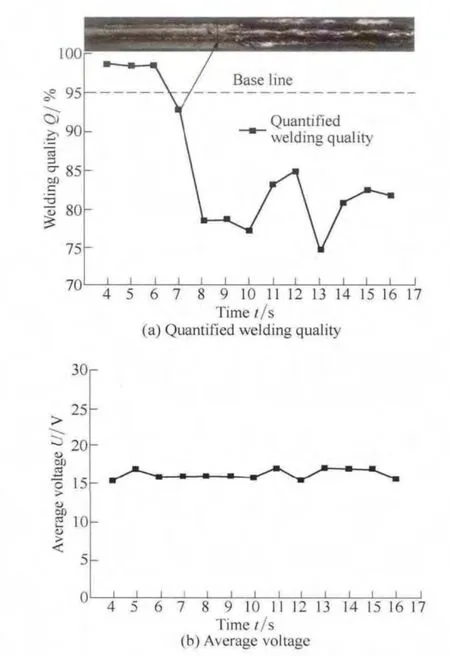
Fig.9.Macrostructure of a welding bead and quantified welding quality and average voltage
It also can be seen that the weld bead with paint is narrower and higher than that without paint.Two crucial conditions for welding are gas ionization and a cathode that emits electrons.However,paint prevents electrons from being emitted,which causes the welding arc to be extinguished.Thus,the welding arc can be extinguished occasionally,which means that less metal is transferred to the substrate and the width of welding bead become narrower.
Two experiments performed in this study clearly demonstrate that welding quality can be effectively evaluated with the WQT.In the future,the WQT will be improved to make it more sensitive to the number of welding faults.
6 Conclusions
(1)The application of a newly developed piece of equipment named WQT for GMAW faults detection is investigated.MD and normal distribution are used to intuitively quantify and qualify welding quality in real time with the new equipment.The method and a new piece of equipment is developed to be practical for real-time computation and applicable toward quality monitoring and fault detection in GMAW.
(2)The proposed method employes the concepts of MD and normal distribution to describe a good quality welding as a reference with which to compare with other welding.
(3)Two kinds of experiments are performed by changing parameters artificially in order to verify the sensitivity and feasibility of WQT based on the concepts of MD and normal distribution.
(4)The results demonstrated that WQT is fully capable of quantifying and qualifying welding faults.
[1]LEE H T,WANG M,MAEV R,et al.A study on using scanning acoustic microscopy and neural network techniques to evaluate the quality of resistance spot welding[J].International Journal of Advanced Manufacturing Technology,2003,22(9–10):727–732.
[2]KRAILJ V.Biocybernetic investigations of hand movements of human operator in hand welding[J].IIW/IIS Doc,1968:212-140-68.
[3]JOLLY W D.Acoustic emission exposes cracks during welding[J].Welding Journal,1969,48:21–27.
[4]ARATA Y.Investigation on welding arc sound[J].Report 1,IIW Doc.S.G.1979:212–451–79.
[5]ARATA Y.Investigation on welding arc sound:vibration analysis of base metal during welding[J].Transaction of JWRI,1981,10(1):39–45.
[6]MAYER J L.Application of acoustic emission to in process monitoring of submerged arc welding[J].IIW Doc V-WG,1987:3–29–87.
[7]ROSTEK W.Investigation on the connection between the welding process and airborne noise emission in gas shielding metal arc welding[J].Schweissen Schneiden,1990,42(6):E96–E97.
[8]GRAD L,KRAILJ V.On line monitoring of arc welding process using acoustic signal[C]//Proceedings of the 13th Conference,Zagreb,1996,I.17–I.20.
[9]LIN J,QU L S.Feature detection and fault diagnosis based on continuous wavelet transform[J].Chinese Journal of Mechanical Engineering,2000,36(12):4867–4873.
[10]MI M,MILLER B,KITA A,et al.Development of automated real-time data acquisition system for robotic weld quality monitoring[J].Mechatronics,2002,12(9–10):1259–1269.
[11]LADISLAV G,JANEZ G,IVAN P,et al.Feasibility study of acoustic signals for on-line monitoring in short circuit gas metal arc welding[J].International Journal of Machine Tools and Manufacture,2004,44(5):555–561.
[12]KAMAL P,SANDIP B,SURJYA K P.Investigation on arc sound and metal transfer modes for on-line monitoring in pulsed gas metal arc welding[J].Journal of Materials Processing Technology,2010,210(10):1397–1410.
[13]WANG Y W,ZHAO P S.Noncontact acoustic analysis monitoring of plasma arc welding[J].International Journal of Pressure Vessels and Piping,2001,79(1):43–47.
[14]LU X Q,ZHANG K,WU Y X.Condition and expectation of automatic seam tracking system[J].Chinese Journal of Mechanical Engineering,2003,39(12):4867–4873.
[15]PATRIZIA S,DARIO D B.On-line optical monitoring system for arc welding[J].NDT &E International,2002,35(1):37–43.
[16]JOHANNES R,JURGEN B,MARIO L.Quality evaluation in resistance spot welding by analysing the weld fingerprint on metal bands by computer vision[J].International Journal of Advanced Manufacturing Technology,2007,33(9–10):952–960.
[17]JUANG S C,TARNG Y S.Process parameter selection for optimizing the weld pool geometry in the tungsten inert gas welding of stainless steel[J].Journal of Materials Processing Technology,2002,122(1):33–37.
[18]PAN L K,WANG C C,WEI S L,et al.Optimizing multiple quality characteristics via Taguchi method-based Grey analysis[J].Journal of Materials Processing Technology,2007,182(1–3):107–116.
[19]TARNG Y S,YANG W H,JUANG S C.The use of fuzzy logic in the Taguchi method for the optimization of the submerged arc welding[J].International Journal of Advanced Manufacturing Technology,2000,16(9):688–694.
[20]LI Z Y,WANG B,DING J B.Detection of GTA welding quality and disturbance factors with spectral signal of arc light[J].Journal of Materials Processing Technology,2009,209(10):4867–4873.
[21]WATANABE Y.Practice Taguchi methods[M].Tokyo:JUSE Press,2006.
杂志排行
Chinese Journal of Mechanical Engineering的其它文章
- Wear Analysis of Disc Cutters of Full Face Rock Tunnel Boring Machine
- Experiment on Wear Behavior of High Pressure Gas Seal Faces
- Dimensional Description of On-line Wear Debris Images for Wear Characterization
- Temperature Distribution and Scuffing of Tapered Roller Bearing
- Case-Based Reasoning(CBR)Model for Ultra-Fast Cooling in Plate Mill
- Modified Pressure Loss Model for T-junctions of Engine Exhaust Manifold
