Effect of combined treatment with clozapine and metformin on fasting blood glucose, insulin level, and expression of the glucose transporter-2 (GLUT2) in Sprague-Dawley rats
2013-12-09LanGAOGaohuaWANGHaoLIUChaohuiYAN
Lan GAO, Gaohua WANG*, Hao LIU, Chaohui YAN
·Original Article·
Effect of combined treatment with clozapine and metformin on fasting blood glucose, insulin level, and expression of the glucose transporter-2 (GLUT2) in Sprague-Dawley rats
Lan GAO, Gaohua WANG*, Hao LIU, Chaohui YAN
1. Introduction
A large number of studies have found a strong relationship between antipsychotic medications and impaired glucose metabolism and diabetes. Patients with psychosis who use antipsychotics for long periods have a higher incidence of diabetes compared to the general population. Incidence of impaired glucose metabolism varies widely across antipsychotics with different chemical structures.[1]According to a retrospective study in 2012, clozapine and olanzapine were associated with the largest weight gain and the highest risk of abnormal glucose metabolism compared to other atypical antipsychotics.[2]Despite its popularity due to its effectiveness in difficult-to-treat patients and its lower incidence of extrapyramidal side-effects, tardive dyskinesia and elevated prolactin than other atypical antipsychotics, concerns about the association of clozapine with weight gain, increased blood glucose and type II diabetes[3,4]has limited its clinical use. This issue is of particular interest in China because of the frequent use of clozapine as monotherapy or in combination with other antipsychotic agents in the treatment of schizophrenia.[5]
There have been several research papers about this issue in China. Clinical trials have demonstrated thatmetformin can effectively reduce the side effects of antipsychotics (particularly those caused by clozapine and olanzapine) including weight gain, increased blood glucose and other metabolic abnormalities. For example,in 2007, Wu and colleagues[6]reported that metformin can effectively mitigate antipsychotics-induced weight gain and abnormal glucose metabolism and several other studies in China report similar findings.[7-11]A meta-analysis reported in 2010[12]found that metformin can reduce weight, body mass index (BMI), waist circumference and insulin resistance, but did not reduce the incidence of diabetes in patients using antipsychotics.

Figure 1. Flowchart of the study
Animal studies can help understand the molecular mechanisms underlying the antipsychotic-induced abnormalities in glucose metabolism and the ameliorating effect of metformin on these sideeffects. One such study by Zhou and colleagues[13]found that clozapine suppressed insulin secretion of isolated pancreatic islets in rats and, thus, resulted in increased blood glucose. The current study compares the levels of several variables between three groups of rats administered clozapine, clozapine and metformin or saline for 28 days:fasting blood glucose, insulin, C-peptide, and mRNA and protein levels of the glucose transporter-2 (GLUT2) in pancreatic β cells.
2. Methods
The flowchart of the experiment is shown in Figure 1. Animals used in this study were 18 healthy female Sprague-Dawley (SD) rats provided by the Hunan Slack King Laboratory Animal Co., Ltd. The animals were 8-10 weeks old, weighed around 190 g, and were kept in the Experimental Animal Center of Wuhan University (with natural lighting, at a room temperature 20 to 25 °C, and fed ad libitum). After one week of acclimation at the animal center, they were divided into three groups using a random number table (six rats in each group): the clozapine group,the clozapine+metformin group, and the saline group.There were no significant differences in the mean weights of the rats in the three groups.
Based on the methods used by Cheng and colleagues,[14]clozapine was administered at 20 mg/kg/d. The clozapine used in the study was purchased (as 25 mg tablets) from Jiangsu Ruinian Qianjin Pharmaceutical Co., Ltd. (National Drug Approval Number: H32022268). The tablets were pulverized and added to 0.9% saline to achieve a suspension with a concentration of 3 mg/ml. Based on the methods used by Wu and colleagues,[6]metformin was administered at 78 mg/kg/d. The metformin used was purchased (as 250mg tablets) from Tianjin Pacific Pharmaceutical Co.,Ltd. (National Drug Approval Number: H12020797).Pulverized tablets of metformin were added to 0.9% saline to achieve a suspension of 22.3 mg/ml. The suspensions were shaken well before administration. The 5ml solution was administered through a 5cm-long stomach tube at 08:00 every day for 28 days.
This study was approved by the institutional review board of the Experimental Animal Center of Wuhan University (which meets regulations for the care of experimental animals established by the Hubei provincial government). The authors certify that the treatment of animals in this study met the ethical standards specif i ed in the Guidelines for Ethical Conduct in the Care and Use of Nonhuman Animals in Research set forth by the American Psychological Association.
2.1 Measurements
2.1.1 Fasting blood glucose
Fasting blood glucose levels were assessed after 10-12 hours of fasting and water deprivation at baseline and on the 7th, 14th, 21st, and 28thday of the study.
2.1.2 Insulin and C-peptide
After water deprivation and fasting for 10-12 hours on the 28thday of the study, anesthesia was induced using 20% urethane (0.6 ml/100g). Abdominal venous blood(2-3ml) was drawn and centrifuged at 3000 RPM for 10 min. The supernatant was used to measure blood insulin and C-peptide using the radioimmunoassay method.The analyses were conducted using the125I-insulin radioimmunoassay kit and125I-human C-peptide radioimmunoassay kit purchased from Beijing Kemei Biotechnology Co., Ltd.
2.1.3 GLUT2mRNA
After anesthetizing the rats on the 28thday of the study(above) samples of fresh pancreatic tissue were collected and stored at -80°C. Rat pancreatic islet cell RNA was extracted with Trizol and then dissolved in DEPC-H2O.The A260 nm/A280 nm value was detected with a spectrophotometer to determine the concentration of RNA. cDNA was prepared via reverse transcription of RNA. The polymerase chain reaction (PCR) product (5μL)was obtained for electrophoresis identification.
PCR was conducted in two steps, amplification of β-actin and amplification of GLUT2.The β-actin PCR amplification reaction started with adding β-actin F(10 μM) 0.5 μL, a-Actin R (10 μM) 0.5 μL, dNTP (2.5 mM) 2 μL,Ex Taq 0.25 μL, 10×Ex Taq E buffer 2.5 μL, cDNA 1 μl, and a complementary amount of de-ionized water into a precooled EP tube up to 25 μL. Subsequently, the following reactions were carried out: pre-denaturation at 94 °C for 4min, denaturation at 94 °C for 30 s, annealing at 56°C for 30 s, and extension at 72°C for 25 s. The above steps were repeated in cycles 30 times. Final extension was then carried out at 72°C for 4min, followed by 4°C for 4 min.
The GLUT2PCR amplification reaction started with adding cDNA (10x dilution) 4 μl, GLUT2F (100μM) 0.4μl,GLUT2R (100μM) 0.4μl, SYBR Green / the Flourescein qPCR Master Mix (2X) 10μl, and de-ionized water 5.4 μl sequentially into the reaction system. Subsequently,two cycles of pre-denaturation at 50°C for 2 min and predenaturation at 95°C for 10min were completed; and,finally, 40 cycles of denaturation at 95°C for 30 s and extension at 60°C for 30 s were conducted.
The mean Ct (cycle threshold) values for each reaction were assessed and the difference in mean Ct values (i.e.,ΔCt = Ct for GLUT2minus Ct for β-actin) was assessed for each rat. The difference between the mean ΔCt values for the three pairs of groups is then computed (e.g.,ΔΔCt[clozapine/saline]= ΔCt [clozapine group] minus ΔCt [saline group]). The expression 2-ΔΔCtis then used as the measure of the relative strength of expression of GLUT2mRNA.
The primers used in these reactions (provided by Genscript Co., Ltd.) are shown in Table 1. The DL2000 DNA Marker and Ex TaqTMwere purchased from TAKARA. And the SYBR Green / the Flourescein qPCR Master Mix (2X)was purchased from Fermentas.
2.1.4 GLUT2protein expression
RIPA (radioimmunoprecipitation) lysis liquid homogenate was taken from each sample of pancreatic tissue. After measuring the protein concentration, 50 μg of total protein from each homogenate was used for electrophoresis with pre-prepared 10% SDS-PAGE (sodium dodecyl sulfate polyacrylamide gel electrophoresis). Electrophoresis was finished when the target protein had been sufficiently separated according to the pre-stained marker.
To transfer to the membrane (wet transfer method),the target strip was cut from the gel and rinsed with distilled water. PVDF (polyvinylidene difluoride) membrane and filter paper were cut to the same size of the PAGE gel. After soaking in methanol for a few seconds, the PVDF membrane was immersed in electro-transfer buffer solution with the filter paper. The material was assembled in the following order: black plate, fiber mat,filter paper, gel, PVDF membrane, filter paper, fiber mat,and white plate; this was then put into a transmembrane electrophoresis box (black plate side facing the negative electrode) at a current of 200 mA for 110 min. The PVDF membrane was subsequently soaked in TBST (Tris-Buffered Saline and Tween 20) containing 5% skim milk powder and put on a shaker at room temperature for 2 hours. Rabbit anti-glucose transporter protein-2 (GLUT2)was diluted using the blocking solution at a ratio of 1:500.Then the PVDF membrane was soaked in the GLUT2incubation solution, and incubated at 4 °C overnight.
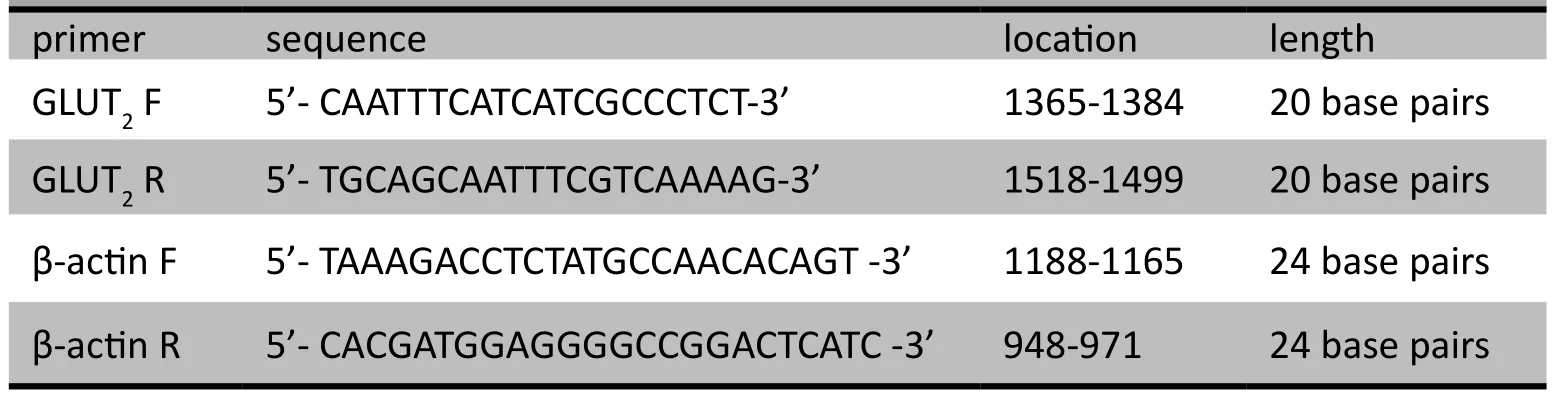
Table 1. Experimental primer sequence and length

Table 2. Comparison of fasting blood glucose levels between the saline group and the other two groups during different time points
The PVDF membrane was then thoroughly rinsed 5-6times (5 min/rinse) with TBST. Blocking solution was used to dilute associated HRP (horseradish peroxidase)-labeled secondary antibody (1:50000) before the PVDF membrane was soaked in this secondary antibody incubation liquid.Incubation was carried out at room temperature on a shaker for 2 hours. The PVDF membrane was then again thoroughly rinsed 5-6 times (5 min/rinse)with TBST. An appropriate amount of ECL (enhanced chemiluminescence) substrate solution was added to each membrane, and then the membrane was incubated a few minutes. When fluorescent bands became visible,excess substrate liquid was extracted with filter paper,and the membrane was covered with a plastic wrap.Subsequently, x-ray films of the membrane were scanned and gradation analysis conducted. The grayscale value of the GLUT2protein divided by the grayscale value of the GAPDH (glyceraldehyde-3-phosphate dehydrogenase)protein was the measure of the relative expression level of the GLUT2protein.
The materials for this Western Blot analysis were obtained from the following suppliers. GAPDH antibody was purchased from Hangzhou Xianzhi Biological Co., Ltd.Rabbit anti-glucose transporter-2 (GLUT2) was purchased from Abcam. HRP-conjugated goat anti-rabbit secondary antibody was purchased from Wuhan Boster Biological Engineering Co., Ltd. The PVDF membrane was purchased from Millipore Corporation. ECL substrate solution was purchased from Thermo. RIPA lysis buffer and BCA protein concentration assay kit were purchased from Beyotime.X-ray film was purchased from Kodak.
2.2 Statistical analysis
SPSS17.0 software was used for data analysis. Means and standard deviations were used to describe the data,and the normality of distributions was tested. Oneway ANOVA was used to compare the sample means across the three groups. Multiple comparisons were used for post-hoc pairwise comparisons. The LSD (least significant difference) method was used when variance was homogeneous, and the Games-Howell method was used when variance was heterogeneous. Blood glucose levels at different time points were compared across groups using repeated measures ANOVA. Significance level was set at p<0.05.
3. Results
As shown in Table 2, in the clozapine group the levels of fasting blood glucose at the 14th(t=3.19, df=5, p=0.024),21st(t=3.81, df=5, p=0.013), and 28thday (t=3.31, df=5,p=0.021) of the study were significantly higher than at baseline. Similarly, in the clozapine+metformin group,the fasting blood glucose level at the 14thday of the study was significantly higher than the baseline level (t=2.74,df=5, p=0.041). Interestingly, the saline group also showed non-significant increases compared to baseline in fasting blood glucose levels at the 14th(t=1.49, df=5,p=0.195), and 21stday (t=1.83, df=5, p=0.127) of the study.
Despite higher fasting blood glucose levels in the clozapine group than in the saline group throughout the study, and higher levels in the clozapine group than in the clozapine+metformin group in the last twotime periods (21stand 28thday) of the study, repeated measures ANOVA found that the differences in fastingblood glucose over time across the three groups were not statistically significant (p=0.136). Thus this small-sample study did not confirm the increase in blood glucose with clozapine use or the suppression of the clozapine-induced increase in blood glucose by combined treatment with clozapine and metformin.

Table 3. Comparisons of insulin and C-peptide levels of the three groups

Figure 2. Electrophoretic bands of β-actin mRNA and GLUT2 mRNA of the three groups using real-time polymerase chain reaction (RT-PCR)
As show in Table 3, after 28 days of intragastric administration of medications or saline, insulin levels were significantly different across the three groups (F=4.13, df=2,p=0.037). The mean insulin level in the clozapine+metformin group was significantly lower than in the saline group(p=0.032) or the clozapine group (p=0.020). Among the three groups, the mean C-peptide level was the lowest in the saline group, followed by the clozapine+metformin group and the clozapine group; however, these differences did not reach statistical significance.
The results of the RT-PCR assessment of the expression of GLUT2mRNA and the Western Blot assessment of the expression of GLUT2protein are shown in Figures 2 and 3, respectively. As shown in Table 4, at the 28thday of the experiment there were statistically significant differences in the levels of pancreatic GLUT2mRNA across the three groups (F=3306.85, df=2, p<0.001): GLUT2mRNA levels in the clozapine group and the clozapine+metformin group were significantly lower than in the saline group(p<0.001), and the level in the clozapine+metformin group was significantly lower than that in the clozapine group (p<0.001). Table 4 also shows that the expression levels of the GLUT2protein were significantly lower in the clozapine group and the clozapine+metformin groupthan in the saline group (p<0.001), but the difference in the GLUT2protein expression in the clozapine and clozapine+metformin groups were not statistically significant.

Figure 3. Results from Western Blot of GAPDH (glyceraldehyde-3-phosphate dehydrogenase, left image) and GLUT2 (glucose transporter-2, right image)of the three groups

Table 4. Expression of pancreatic glucose transporter-2 (GLUT2) mRNA and protein of the three groups
4. Discussion
4.1 Main findings
In this study, we found a non-significant increase in fasting blood glucose levels in rats during 28 days of continuous intake of clozapine compared to rats given saline. After 28 days, the C-peptide and insulin level in rats administered clozapine were not significantly different from rats given saline, but the expression of GLUT2mRNA and GLUT2protein were significantly lower in the clozapine-treated rats than in the saline-treated rats. These results are consistent with a large number of related studies. Studies have shown that antipsychotic medications may interfere with the functioning of glucose transporters on the cell membrane and that the inhibition of glucose transporters is associated both with hyperglycemia and diabetes. Moreover, the inhibition of glucose transporters caused by clozapine is much greater than that caused by risperidone.[14]Clozapine serves as a partial antagonist of DA receptors, 5-HT1A receptors, α1 receptors, and M receptors, and it may also elevate leptin levels, which leads to increased appetite, weight gain, and hyperglycemia.
In this study rats treated with a combination of clozapine and metformin showed a peak in the fasting blood glucose level one week after the start of the trial, which gradually decreased thereafter. This may be due to the faster rate of metabolism of metformin compared to that of clozapine(90% of metformin is metabolized within 12 hours);metformin would, thus, take longer to achieve the steadystate blood level needed to realize its full potential for suppressing the hyperglycemic effects of clozapine. Though not statistically significant, this trajectory in the fasting blood glucose levels of the clozapine+metaformin group over the 28 days, combined with the significantly lower level of insulin in the this group after 28 days of treatment,suggests that metformin can reduce the elevated blood glucose level induced by clozapine and reduce insulin resistance. These results are consistent with a clinical study by Wu and colleagues.[7]The main mechanisms of the hypoglycemic effect of metformin include the promotion of glucose uptake in peripheral tissues, reduction of glycogen decomposition and gluconeogenesis, reduction of hepatic glucose output, inhibition of glucose absorption in the intestines, and the promotion of glucose utilization in peripheral tissues.[15,16]Other possible mechanisms include the promotion of lipid metabolism, reduction of obesity,[17,18]increase in the expression of leptin receptors,and the restoration of leptin levels.[19,20,21]
Contrary to expectations, the current study also found that GLUT2mRNA and GLUT2protein expression in the pancreatic islet β-cells of rats receiving clozapine and metformin was significantly lower than in the control rats receiving saline. This may have occurred because the 28-day duration of the study was not long enough for the up-regulation of GLUT2to occur or because the primary hypoglycemic effect of metformin is by up-regulation of GLUT2in the liver (not in the pancreas).
4.2 Limitations
This study has several limitations. First, due to the small number of animals, differences in fasting blood glucose over time did not reach statistical significance. Second,the relatively short duration of the study (28 days) made it impossible to assess the long-term effects of metformin on clozapine-induced abnormalities in glucose metabolism.Third, we based our decision on the appropriate dosage of metformin on clinical trials; more pharmacokinetic studies are needed to determine the appropriate dosage in rats.Finally, we did not test GLUT2expression in the liver, the most important site of manufacture of this transporter.Future studies in this area need to have larger samples,assess the effects over more prolonged periods, test various doses of metformin, and evaluate GLUT2expression in both the pancreas and the liver.
4.3 Significance
Diabetes and the metabolic syndrome are serious adverse events that affect the quality of life and treatmentadherence of patients who need to take antipsychotic medications for prolonged periods. Developing effective means for reducing the frequency and severity of these adverse reactions is an important clinical goal for psychiatry.Metformin is one promising agent for achieving this goal,but much more needs to be known about the adjunctive use of metformin with antipsychotic medications before this potential can be realized.
Studies in animals are needed to help clarify the complex relationship between clozapine, metformin,glucose metabolism and diabetes. Our study highlights the complexity of these relationships and clarifies the need for a parallel series of animal studies and clinical studies to assess the appropriate use of metformin as an adjunctive treatment for patients taking antipsychotic medications who are at risk of developing the metabolic syndrome. Several avenues of research are indicated: (a)in which patients and for which antipsychotic medications is metformin most likely to be beneficial?; (b) what is the appropriate dosage of metformin to achieve the desired effect while limiting the possibility of unwanted adverse reactions?; (c) which measures should be used to determine whether or not metformin is effective?;and (d) how long should metformin be administered to determine whether or not it is effective?
Conflict of interest
The authors report no conflict of interest related to this study.
Funding
This study was funded by the National Natural Science Foundation (30971041).
1. Krakowski M, Czobor P, Citrome L. Weight gain, metabolic parameters, and the impact of race in aggressive inpatients randomized to double-blind clozapine, olanzapine or haloperidol. Schiz Res 2009; 110(1-3): 95-102.
2. Hasnain MW, Victor RV, Hollett B. Weight gain and glucose dysregulation with second-generation antipsychotics and antidepressants: a review for primary care physicians. Postgrad Med 2012; 124(4): 154-167.
3. Henderson DC, Cagliero E, Gray C, Nasrallah RA, Hayden DL,Schoenfeld DA. Clozapine, diabetes mellitus, weight gain,and lipid abnormalities: a five-year naturalistic study. Am J Psychiatry 2000; 157(6): 975-981.
4. Koller E, Schneider B, Bennett K, Dubitsky G. Clozapineassociated diabetes. Am J Med 2001; 111(9): 716-723.
5. Chen J, Feng F, Shang L, Li J, Han XQ, Pang Y, et al. Assessment of medication status of elderly hospitalized patients with schizophrenia. Journal of Psychiatry 2008; 21(3): 222-223. (in Chinese)
6. Wu RR, Zhao JP, Shao P, He YQ, Fang MS, Liu YJ, et al. Efficacy of behavioral intervention and metformin in the treatment of antipsychotic-induced weight gain and glucose metabolism dysfunction. Chin J Psychiatry 2007;40(4): 193-196. (in Chinese)
7. Wu RR, Zhao JP, Shao P. Metformin addition therapy attenuates olanzapine-induced weight gain. Chin J Psychiatry 2008; 41(1):1-4. (in Chinese)
8. Li CY, Pei SJ, Guo YH. Metformin in patients with schizophrenia early intervention study of glucose. China Clinical Practical Medicine 2009; 3(7): 22-25. (in Chinese)
9. Chen JX, Wu SY, Lin R, Chen HE. The effi cacy of metformin in combination with life style intervention on body weight, blood lipid and blood glucose in schizophrenia during clozapine treatment. Sichuan Mental Health 2010; 23(4): 198-202. (in Chinese)
10. Liu HP. Effects of metformin hydrochloride on body mass and blood sugar of inpatients with schizophrenia on clozapine. J Clin Psychosom Dis 2012; 18(2): 97-100. (in Chinese)
11. Tao F. The effect of metformin on relieving weight gain in patients with first-episode schizophrenia treated with olanzapine. Modern Practical Medicine 2012; 24(1): 58-59; 97.(in Chinese)
12. Ehret M, Goethe J, Lanosa M, Coleman CI. The effect of metformin on anthropometrics and insulin resistance in patients receiving atypical antipsychotic agents: a metaanalysis. J Clin Psychiatry 2010; 71(10): 1286-1292.
13. Zhou Y, Wang GH, Wang XP, Wang HL. The effect of clozapine on insulin of rats in vitro. Chin J of Nervous and Mental Disease 2009; 30(5): 377-378. (in Chinese)
14. Cheng WR, Xie SP, Zhang XR, Zhang Z. Effects of clozapine on fasting blood glucose and mRNA expression of skeletal muscle glucose transporter 4 in male mice. Chin J Psychiatry 2006;39(4): 224-227. (in Chinese)
15. Scheen AJ, De Hert MA. Abnormal glucose metabolism in patients treated with antipsychotics. Diabetes Metab 2007; 33(3): 169-175.
16. Stumvoll M, Nurjhan N, Perriello G, Dailey G, Gerich JE.Metabolic effects of metformin in non-insulin-dependent diabetes mellitus. N Engl J Med 1995; 333(9): 550-554.
17. Bailey CJ, Turner RC. Metformin. N Engl J Med 1996; 334(9):574-579.
18. Rodríguez-Moctezuma JR, Robles-López G,López-Carmona JM, Gutiérrez-Rosas MJ. Effects of metformin on the body composition in subjects with risk factors for type-2 diabetes.Diabetes Obes Metab 2005; 7(2): 189-192.
19. Tankova T. Current indications for metformin therapy. Rom J Intern Med 2003; 41(3): 215-225.
20. Aubert G, Mansuy V, Voirol M J, Pellerin L, Pralong FP. The anorexigenic effects of metformin involve increases in hypothalamic leptin receptor expression. Metab Clin and Exper 2011; 60: 327-334.
21. Nakhjavani M, Morteza A, Asgarani F, Mokhtari A, EsteghamatiA, Khalilzadeh O, et al. Metformin restores the correlation between serum-oxidized LDL and leptin levels in type 2 diabetic patients. Redox Rep 2011; 16(5): 193-200.
氯氮平联合二甲双胍对SD大鼠空腹血糖及胰岛GLUT2表达水平的影响
高兰 王高华* 刘浩 阎超慧
武汉大学人民医院精神卫生中心 湖北武汉
背景: 抗精神病药物可引起血糖升高甚至导致2型糖尿病。二甲双胍可能会减轻上述副作用。目的评价二甲双胍能否减轻使用抗精神病药氯氮平时发生的糖代谢异常。方法将18只成年SD大鼠分为3组,分别用生理盐水、氯氮平(20mg/kg)及氯氮平(20mg/kg)+二甲双胍(78mg/kg)灌胃28d。在基线及其后每隔7天测空腹血糖。实验第28d麻醉大鼠使其安乐死,此时取腹主静脉血,用放射免疫法检测血胰岛素和C肽水平;取胰腺组织,采用实时聚合酶链反应和Western Blot技术检测葡萄糖转运体2(glucose transporter-2,GLUT2)的表达水平。结果氯氮平组第14天、21天和28天的空腹血糖值均显著高于基线值,但氯氮平+二甲双胍组仅第14天时的空腹血糖值较基线明显升高。尽管如此,重复测量的方差分析并未发现三组间随时间变化的血糖水平差异有统计学意义(p=0.136)。多组比较发现氯氮平+二甲双胍组的胰岛素均值显著低于盐水组及氯氮平组。组间GLUT2 mRNA的表达差异具有统计学意义(氯氮平+二甲双胍组<氯氮平组<盐水组),组间GLUT2 蛋白的表达差异亦有统计学意义(氯氮平+二甲双胍组,氯氮平组<盐水组)。结论本研究发现氯氮平一定程度上能使SD大鼠空腹血糖水平升高,联合使用二甲双胍可部分抵消血糖的升高。正如预期,接受氯氮平的SD大鼠GLUT2的表达水平降低。然而,意料之外的是氯氮平联合二甲双胍治疗28 d并未使GLUT2的表达水平正常化。
Background:Antipsychotic medications can cause an increase in blood glucose and the development of type II diabetes. Metformin may ameliorate these side effects. Objective: Assess whether or not metformin reduces the abnormalities in glucose metabolism that occur with use of the antipsychotic clozapine.Methods:Eighteen adult Sprague-Dawley (SD) rats were divided into three groups that were intragastrically administered saline, clozapine (20 mg/kg), or a combination of clozapine (20 mg/kg) and metformin (78 mg/kg)for 28 days. Fasting blood glucose was assessed at baseline and every seven days thereafter. The animals were euthanized on the 28th day at which time aortic blood was obtained to assess blood insulin and C-peptide by radioimmunoassay, and pancreatic tissue samples were collected and used to determine the expression of the glucose transporter-2 (GLUT2) by real-time polymerase chain reaction (RT-PCR) and Western Blot.Results:Fasting blood glucose in the clozapine group was significantly higher at the 14th, 21st, and 28th day compared to baseline, but rats receiving clozapine and metformin only had significantly elevated levels on the 14th day of treatment. However, repeated measures ANOVA found no statistically significant differences in blood glucose levels over time between the three groups (p=0.136). Multiple comparison tests found that the mean insulin level in the clozapine+metformin group was significantly lower than the levels in the clozapine and saline groups. There were statistically significant differences in the expression of GLUT2 mRNA (clozapine+metformin group < clozapine group < saline group) and in the expression of GLUT2 protein (clozapine+metformin group,clozapine group < saline group).Conclusion:This study found a non-significant increase in fasting blood glucose in SD rats treated with clozapine that was partially counteracted by concurrent administration of metformin. Rats administered clozapine showed the expected decrease in the expression of GLUT2, but concurrent administration of metformin and clozapine for 28 days did not show the expected normalization of the expression levels of GLUT2.
10.3969/j.issn.1002-0829.2013.03.004
Mental Health Center, People’s Hospital of Wuhan University, Wuhan, Hubei Province, China
*correspondence: wgh6402@163.com
(received: 2012-12-14; accepted: 2013-02-26)

Dr. Lan Gao graduated from Jining Medical College in July 2011 with a Bachelor's degree in clinical medicine. She is currently pursuing a Master's degree in psychiatry and mental health from Wuhan University. Her main research interests are psychopharmacology and the effects of new antipsychotics on glucose metabolism in patients with psychosis.
*通信作者:wgh6402@163.com
猜你喜欢
杂志排行
上海精神医学的其它文章
- Antidepressants for children with depression
- Should repeve Transcranial Magnec Smulaon (rTMS)be considered an effecve adjuncve treatment for auditory hallucinaons in paents with schizophrenia?
- Survival analysis for observational and clustered data: an application for assessing individual and environmental risk factors for suicide
- Prevalence of ausm spectrum disorders in China
- Changing the focus of suicide research in China from rural to urban communities
- Two cases of neuroleptic malignant syndrome in elderly patients taking atypical antipsychotics