Odorant discrimination using functional near-infrared spectroscopy of the main olfactory bulb in rats
2013-11-01InwonJungKyungjinYouHyunchoolShinChinsuKohHyungcheulShinJaewooShin
Inwon Jung, Kyungjin You, Hyunchool Shin, Chinsu Koh, Hyungcheul Shin, Jaewoo Shin
(1. Dept. of Electronic Engineering, Soongsil University, Seoul 156-743, Korea;2. Dept. of Physiology, College of Medicine, Hallym University, Chuncheon 200-702, Korea)
Odorant discrimination using functional near-infrared spectroscopy of the main olfactory bulb in rats
Inwon Jung1, Kyungjin You1, Hyunchool Shin1, Chinsu Koh2, Hyungcheul Shin2, Jaewoo Shin2
(1. Dept. of Electronic Engineering, Soongsil University, Seoul 156-743, Korea;2. Dept. of Physiology, College of Medicine, Hallym University, Chuncheon 200-702, Korea)
We characterize the hemodynamic response changes in the main olfactory bulb (MOB) of anesthetized rats with near-infrared spectroscopy (NIRS) during the presentation of three different odorants: (i) plain air as a reference (Blank), (ii) 2-heptanone (HEP), and (iii) isopropylbenzene (Ib). Odorants generate different changes in the concentrations of oxy-hemoglobin. Our results suggest that NIRS technology might be useful in discriminating various odorants in a non-invasive manner using animals with a superb olfactory system.
brain-machine interface (BMI); functional near-infrared spectroscopy (fNIRS); main olfactory bulb (MOB); oxyhemoglobin (HbO2); Beer-Lambert law; maximum likelihood estimation (MLE)
Near infrared spectroscopy (NRIS) is a technique that enables noninvasive measurement of concentration changes and optical coefficients (scattering and absorption coefficients) in chromophores such as oxyhemoglobin (HbO2), deoxyhemoglobin (Hbr), myoglobin, cytochrome oxidase, water, lipid and protein, and in human tissues using lights that are harmless to the human body. Since Jobsis first measured tissue oxygenation in human tissues[1], NRIS has been used extensively not only in the analysis of the metabolic process in human tissues, including neuroimaging, which visualizes brain activation; the diagnosis of breast cancer; neuroscience using small animals; and brain-machine interfaces (BMI), but also in the analysis of crop quality. In particular, near infrared rays in wavelength of 600-900 nm have fewer occurrences of scattering and absorption in human tissues compared with other wavelength. Thus, information inside the human body can be obtained using those rays.
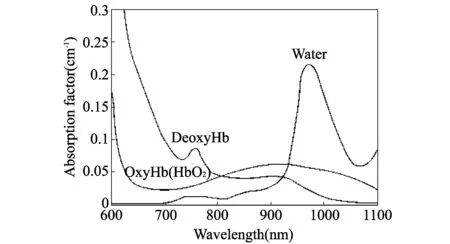
Concentration changes in HbO2and Hbr are due to hemodynamic responses in blood vessels. An increased amount of HbO2flows in the surrounding tissues when the human metabolism becomes active. This study attempts to measure hemodynamic response changes in the main olfactory bulb (MOB) of rats when they are stimulated with odorants, using Imagent equipment in the frequency domain type. In order to measure hemodynamic changes, wavelength around 800 nm, where the absorbencies of HbO2and Hbr become equal, is selected. In addition, 690 nm and 830 nm laser diodes are used in Imagent system and optical coefficients are derived from the changes in the signal intensities of phase and light. Using the optical coefficients derived, odorants are reversely inferred from the hemodynamic changes in main olfactory bulb (MOB) of rats when they were stimulated by odorants.

Fig.1 Absorbencies of HbO2 and Hbr become equal at around 800 nm. In Imagent system used in this experiment, HbO2 and Hbr are measured using the near infrared rays in wavelengths of 830 nm and 690 nm, respectively
This study performed an analysis on how concentration changes in the MOB of rats, according to odor stimulations, and their variations, according to the lapse of time, influence the reverse inference of odorants. When analyzing the concentration changes in the MOB of rats, this study use only the information of HbO2.
1 Materials and methods
1.1 Experiment protocol
The experiment is performed in the Medicine and Physiology Laboratory, Hallym University, using Sprague Dawley (SD) rats (350-400 g, male), which are provided by the animal center of Orient Bio Co. The laboratory is maintained at 23±2℃ and 55±10% humidity. Rats can freely take food and water in their cages. Rats are anesthetized by intraperitoneal injection using urethane (20%, 1.25 g/kg body weight). After fixing the rats on a stereotaxic device, their scalps are incised. Signals are then obtained after arranging optical fibers according to the location of coordinates.
Using the 16 source-channel frequency-domain NIRS system (Imagent, ISS, IL, USA), hemodynamic responses in the olfactory bulb are measured. This system uses two wavelengths, 690 nm and 830 nm, and each channel includes two 400-μm core diameter optical fibers (FT-400EMT, Thorlabs, NJ, USA) of 690 nm and 830 nm wavelengths.

Fig.2 Experiment arrangement
Optical fibers are arranged as shown in Fig.2(a) and the actual experiment is shown in Fig.2(b). In NIRS channels, sources and detectors are separated by 7 mm and the penetration of near infrared rays into the cortex area is 2 mm deep. Once optical fibers are arranged in the due location of coordinates, they are fixed to the rats’ skulls using dental cement (KetacCem, 3M, USA). Sampling is performed at 28.4 Hz in NIRS system.
The rats are stimulated with diluted odors by connecting each bottle containing a chemical and a silicone tube. The chemicals used in the experiment are (i) natural air (Blank), (ii) 2-heptanone (Hep), and (iii) Isopropylbenzene (Ib).
1.2 Theory
In order to measure hemodynamic changes in the MOB of rats, the concentration changes in HbO2and Hbr are calculated using the Beer-Lambert law. Transitivity (T) is derived by

Absorbance(=optical density) A is
where L is pathlength, the distance between the source and detector; Bλis differential pathlength factor[4](dimension less constant to account for photon path lengthening effect of scattering) corresponds to wavelength λ.
In general, matrix-vector equation is
where S is the total number of wavelength types, M is the total number of matter types.
A=LBEC.
(4)
What we interested in is concentration vector

(5)
In this experiments, S=2 (830nm, 690nm) and M=2(Oxy-Hemoglobin, Deoxy-Hemoglobin).
During the progress of the experiment, intensity values occasionally exhibit an overall increase with the lapse of time because temperature increases in Imagent equipment. In such a case, the increase of intensity can be reduced by using a second polynomial line fitting. An overall increase or decrease phenomenon can be removed using the difference between raw data and a fitting line. Moreover, an approximation to the original intensity value can be enabled by adding the average value of raw data again.
The signals of concentration changes using an altered Beer-Lambert law appear in the form of containing a large amount of high-frequency substances. As a result, as shown in Fig.3[5], low-frequency filtering is performed with a cut-off frequency of 0.125 Hz in order to obtain a cleaner pattern of concentration changes.

Fig.3 Experimental results
The concentration changes calculated from HbO2and Hbr are different. The initial values of concentration changes in each channel or trial are also different.
Therefore, an offset is set up to adjust the initial value of concentration changes at each trial. The point of stimulation is set at 0 s. Using the average gap in concentration changes between the post-stimulation line and the pre-stimulation base line during the time of -25 to -5 s, the initial gap in concentration changes is reduced for each trial.
1.3 Setting up features and decoding
The average and standard deviations of the concentration changes of HbO2from the point of stimulation to 30 s after a round of trials are shown in Fig.4. Each odor stimulation produces a different time of maximum concentration change and a different change value. Therefore, decoding is performed using the maximum value of concentrauion changes for each odor stimulation.

Fig.4 Average and standard deviations of concentration chaoges in the three odorants for 30 s after the stimulation point of all trials which applied pre-processing
However, as the point to reach the maximum concentration change varies in each trial, it is difficult to provide high reliability, regardless of success rates. For this reason, this study sets up a sliding window with size of 3 s and a center of 1.5 s, and thereby the average of concentration changes is used as a feature.
A probability density function is modeled using Gaussian distribution. The probability density function based on the Gaussian distribution is formed as the below X equation.
where k is the type of odor stimulation used in the experiment and n is the number of channels. μn(k) is the average of the training data and σn(k) is the standard deviation of the training data.
To reversely infer the unknown chemical k using the probability density value of each chemical obtained from the Gaussian modeling, the maximum likelihood estimation (MLE) technique is employed. that maximizes p(x1(k),x2(k),…,xN(k)), which is the probability density function of the unknown chemical k denoted as

If each channel is assumed to be probabilistic and independent from the others[5,6], an equation can be developed as


(10)
This function can be viewed as a multi-dimensional entropy likelihood function to each chemical response. Maximum likelihood estimation is a nonlinear classification method that estimates the likelihood for every number of cases, and finds a value that generates the highest likelihood. The chemical that maximizes is estimated according to this. This study uses only one out of a total of eight trials as the test data, and the remaining seven trials are used as the training data. With this combination, eight data sets are used to be infer odorants.
2 Results
2.1 Decoding using max peaks
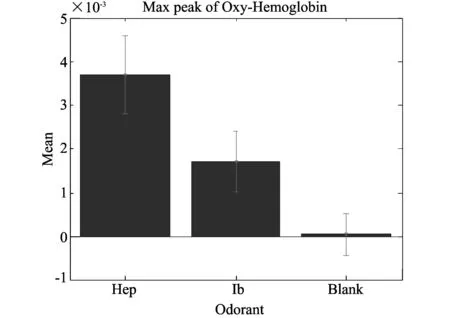
Fig.4 shows that the concentration changes of blood flow in the MOB of rats vary according to different chemicals of odor stimulation. Fig.5 confirms that maximum concentration changes vary according to odor stimulations. In addition, the average of the maximum concentration changes is set as a feature.

Fig.5 Average and standard deviations of the maximum values of concentration changes for 30 s after three types of odor stimulation
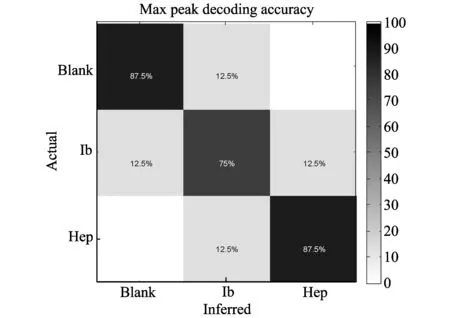
Fig.6 shows the results when the Gaussian modeling is built based on the average and standard deviations of concentration changes at the point when the maximum concentration change occurrs for 30 s after the stimulation point. From the results of the Gaussian modeling in Hep, Ib and Blank, it is easy to distinguish between Blank and Hep, but Ib exhibits a high probability of being classified as either Hep or Blank. The performance of decoding is shown in Fig.7 when MLE is used to the Gaussian model.

Fig.6 Gaussian model using the average and standard deviations of the maximum values of concentration changes for 30 s after odor stimulation

Fig.7 Performance results of decoding when the maximum value of concentrations changes is set as a feature. As estimated from the model in Fig.6, the performance of Ib is the lowest among the three types of odor stimulation
The Gaussian distribution suggests a relatively higher probability of the classification of Ib as Hep or Blank. Accordingly, the actual results of decoding confirmed that Ib has a lower performance compared to Hep and Blank, as shown in Fig.7. The overall performance of decoding is high at 83.3%. However, when the average of the maximum values of concentration changes is set as a feature, the decoding results become without the consideration of time information, which increases the need to use a different feature.
2.2 Decoding using the average of concentration changes according to lapse of time
After odor stimulation, the concentration of HbO2increases with time and then decreases after a certain lapse of time (Fig.4). Based on this phenomenon, the earlier mentioned Gaussian modeling and MLE are performed according to the lapse of time after odor stimulation by setting the average of HbO2’s concentration changes as a feature while using a sliding window with a window size of 3 s and a center of 1.5 s. As the gaps in concentration changes among individual chemicals for about 5 s after odor stimulation, with an offset set up, are negligible, the odorants are hardly distinguishable. However, Fig.4 shows that the gaps in concentration changes among individual chemicals become greater with the passage of time, making the identification of odorants easier. Similarly, as the gaps narrow again, the identification becomes more difficult. The decoding performances based on each central time slot are presented in Fig.8. The decoding performance for 10.5 to 13.5 s is indicated at 92%. Meanwhile, the decoding success rate remained at about 40% from the point of stimulation to 4.5 s, suggesting difficulty in distinguishing among odorants. While the decoding performance from 13.5 to 21 s appeares relatively high, the decoding performance from 22.5 s drops markedly. Such findings confirm that the highest decoding performance is realized around the time of 10 to 14 s.

Fig.8 Time-based performance results of decoding with the window size of 3 s and the center of 1.5 s. This shows the highest decoding performance during 10.5 to 13.5 s
3 Conclusion
This study measures hemodynamic response changes occurring when odor stimulation is applied to MOB of rats using NIRS. And the concentration changes in HbO2and Hbr are calculated using Beer-Lambert law. Meanwhile, an analysis is given using HbO2only, given that the concentration changes in Hbr are relatively smaller than in HbO2.
The method of inferring odorants using the scale of concentration changes creates high performances. But, this does not take into account time information, resulting in difficulty in increasing reliability. Thus, the inference of odorants with time information is performed. The experiment shows that concentration changes reach their peak at around 15 s after odor stimulation, and then decline gradually. Based on this result, the actual performance of decoding is expected to be highest at around 15 s and this has been confirmed. Given the limitations of the present work, additional experiments are planned to increase the reliability of our findings by increasing the number of trials used for analysis.
[1] Jobsis F. Noninvasive, infrared monitoring of cerebral and myocardial oxygen sufficiency and circulatory parameters, Science, 1977, 198(4323): 1264-1267.
[2] Lee H J, Shin H C, et al, Odor-dependent hemodynamic responses measured with NIRS in the main olfactory bulb of anesthetized rats. Experimental Neurobiology, 2011, 20: 189-196.
[3] Crespi F, Bandera A, Donini M, et al. Non-invasive in vivo infrared laser spectroscopy to analyse endogenous oxy-haemoglobin, deoxy-haemoglobin, and blood volume in the rat CNS. Journal of Neuroscience Methods, 2005, 145(1/2): 11-22.
[4] Duncan A, Meek J H, Clemence M, et al. Optical pathlength measurements on adult head, calf and forearm and the new born infant using phase resolved optical spectroscopy. Phyics in Medicine and Biology, 1995, 40(5): 295-304.
[5] ZHANG Quan, Strangman G E, Ganis G. Adaptive filtering to reduce global interference in non-invasive NIRS measures of brain activation: How well and when does it work? NeuroImage, 2009, 45(3): 788-794.
[6] Shin H C, Aggarwal V, Acharya S, et al. Neural decoding of finger movements using Skellam-based maximum-likelihood decoding. IEEE Transactions on Biomedical Engineering, 2010, 57(3): 754-760.
[7] Jazayeri M, Movshon J A, Optimal representation of sensory information by neural populations. Nature Neuroscience, 2006, 9(5): 690-696.
[8] You K J, Ham H G, Lee H J, et al, Odor discrimination using neural decoding of the main olfactory bulb in rats. IEEE Transactions on Biomedical Engineering, 2011, 58(5): 1208-1215.
date: 2012-08-23
The MKE(The Ministry of Knowledge Economy), Korea, under the ITRC(Information Technology Research Center) support program supervised by the NIPA(National IT Industry Promotion Agency) (NIPA-2012-H0301-12-2006); Brain Research Center (BRC)(2012K001127), The MKE(10033634-2012-21) ; National Research Foundation of Korea (NRF)(2012-0005787)
Hyunchool Shin (Shinhc@ssu.ac.kr)
CLD number: TN219 Document code: A
1674-8042(2013)01-0089-05
10.3969/j.issn.1674-8042.2013.01.019
杂志排行
Journal of Measurement Science and Instrumentation的其它文章
- Image enhancement and post-processing for low resolution compressed video
- Acetonitrile (CH3CN) and methyl isocyanide(CH3NC) adsorption on Pt(111) surface: a DFT study
- Erosion thermocouple temperature acquisition system
- Dynamic calibration method of capacitive pressure measuring device
- Automatic measurement of air-pressure sensor based on two-pressure control instrument
- An experiment to estimate the revolution of DC motor
