Studyof velocityfluctuations in the plenum of a 3/4open jet automotive wind tunnel
2013-10-21JIAQingYANGZhigang
JIA Qing,YANG Zhi-gang
(Shanghai Automotive Wind Tunnel Center,Tongji University,Shanghai 201804,China)
0 Introduction
It is well known that flow inside the plenum of an open jet wind tunnel has apparent unsteady characteristics,commonly referred to as buffeting,which could arise from the open jet shear layer or the feedback effect of the collectors.The resultant unsteady test environment is undesirable for aero-acoustic and aerodynamic measurements as it yields unsteady measurements of aerodynamic forces and high aero-acoustic noise levels.In the extreme case,it can be difficult for the facility control system to maintain steady wind speed conditions or even the safety of the facility could be at stake.Though in recent years,the elimination/reduction of buffeting phenomenon in low speed wind tunnels has attracted considerable attention,but due to the problem's complication,the mechanism for buffeting phenomena is still not fully understood.
To eliminate buffeting phenomenon and to establish a good axial static pressure distribution in open jet wind tunnels,it is necessary to understand the flow characteristics inside plenum.For the Shanghai Automotive Wind Tunnel Center Project[1]which has a full scale aerodynamic and aero-acoustic wind tunnel,apilot wind tunnel with the 1∶15scale was constructed for such studies.The model wind tunnel was found to have a good axial static pressure[2-3].The current investigation focuses on the unsteady aspect of the flow characteristics inside the plenum.
Both test and the computational fluid dynamics(CFD)were used in the present study.As indicated in reference[2],the axial static pressure distribution in the plenum of the model wind tunnel is well simulated with the CFD method.For the unsteady flow in the plenum of the model wind tunnel,the simulation can be carried out using the DNS or LES approaches.These approaches,however,demand high computational resources in time and storage.In the present study,a simplified method,the URAN approach,is used.The velocity at the inlet assumed to be fluctuating to establish an unsteady environment,and the unsteady flow field in the plenum viewed as a response to the velocity fluctuation at the inlet.
Earlier test results showed that in the plenum of the model wind tunnel under the present study there were strong pressure fluctuations at the low speed conditions at some frequencies especially at 20Hz[4].Since the frequency is relatively low,the URAN approach is deemed reasonable.In the present study,both CFD method and tests have been carried out.In the simulation,the unsteady inlet boundary condition was used to set an unsteady flow field environment inside the simulating domain.The velocity was assumed to be a combination of a constant mean velocity and an oscillating component.For the same constant mean velocity,the frequencies of the oscillating velocities were varied to study the response of the velocity fluctuations in the plenum to the varying inlet conditions.For a selected given oscillation,the mean velocity was varied in the simulations.The corresponding tests for unsteady flow field inside the plenum were carried out in the 1∶15scale wind tunnel test.The velocities of the nozzle outlet plane were set equal to the velocities at the same position used in the simulation.Finally the simulating and test result were compared and analyzed.
1 Simulation
1.1 Modeling
Part of model open jet wind tunnel is shown in Figure 1,which includes the contraction part,the breathers,the nozzle,the plenum,the collectors and the diffuser.The dimensions for plenum chamber is 1.517min length,1.183min width,and 0.818min height.According to the 1:15scaled wind tunnel,the max velocity for the nozzle out plane is 45m/s.
1.2 Discretization
In the computational study,the Hex-Core meshes were used.The character of this kind of mesh was that in the main computational domain the hexahedral meshes were created and in the area near to the wall the triangle meshes were created.Thus the more accurate and economy hexahedral meshes were used for most of the computational domain.While due to the complicated shape of the collectors,the volume surrounding the collections were discretized with tetra meshes.The prism layers were created on the floor inside the domain.The resulting meshes are shown in Figure 2.
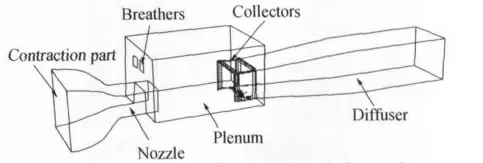
Fig.1 Components of the virtual wind tunnel图1 模型风洞结构组成
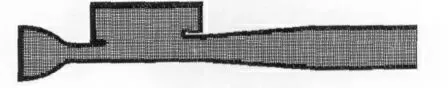
Fig.2 Mesh图2 网格
1.3 Numerical method
The commercial CFD code of Fluent[5]was used for the current analysis.In current study,CFD was performed in the framework of URAN to analyze the velocity fluctuations,which were found to be at relatively low frequencies.The incompressible continuity equation and unsteady Navier-Stokes equations were applied as the basic equations.The boundary conditions for the computations were set as follows:at the inlet for the contraction part of the virtual wind tunnel,the inlet velocity was assumed to be a combination of a constant mean and an oscillating component defined as following equations:
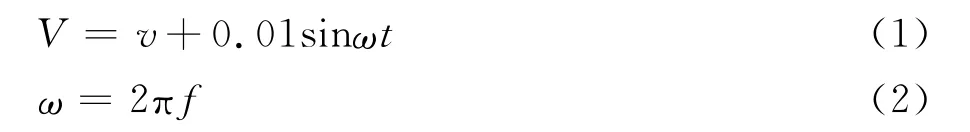
Wherevdenotes the constant mean velocity which was set to 5m/s,andfrepresents the frequency of the oscillating velocity.From the acoustic test result shown in figure 3,the sound pressure which relates to the pressure fluctuation of the flow is found to have peaks at the frequencies less than 100Hz.So the oscillating frequency in formula(2)was set to 20Hz,30Hz,40Hz,45Hz,50Hz,80Hz,and 90Hz,respectively,in the simulation.For each case a turbulence level was set to 1%and a turbulent eddy viscosity ratio of 100was set for the turbulence field.At the exit of the virtual wind tunnel,the outflow condition was specified.Inviscid wall conditions were applied at the virtual wind tunnel side and top walls.On the wind tunnel floor,velocity was set to zero and the wall functions approach[6]was used to model the turbulence field at the viscous walls.
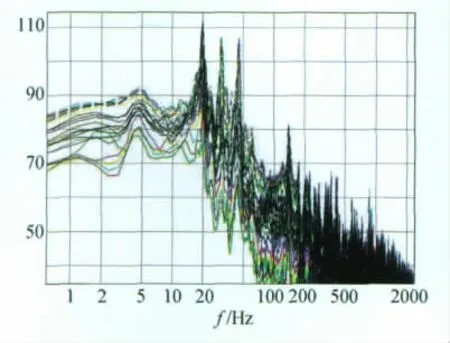
Fig.3 Sound pressure level plots at low speeds图3 低速情况下声压级测试图
In each of the computational cases,the simulation was conducted in three steps.At the first step,a steady state flow field was obtained using a uniform velocity inlet condition.At the second step,with the results from the steady state simulation as the initial condition,an unsteady simulation was conducted with time stepΔt=0.005using an oscillating velocity inlet conditions.The calculation would be stopped after the monitored points showing the definite periodical changes.At the third step,the sampling computation would be continued.The sampling time was defined as 1second in all cases.
1.4 Test validation
To validate the simulating method,the corresponding test for one situation was carried out.According to the simulation,the velocity for the nozzle outlet plane was set to 25m/s.During the test,the data at the same points as the simulation were obtained.
In the simulation,for each case the velocity fluctuation data were acquired at the positions indicated in Figure 4.
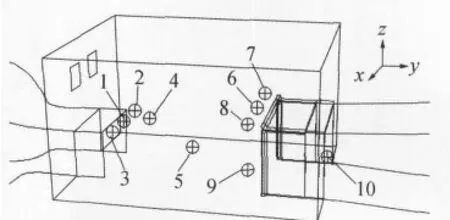
Fig.4 Location of testing points图4 测点布置图
The points were set at varied axial positions:the nozzle exit plane(1,2,3),the shear layer region(4),the axial center(5),the collector inlet plane(6,7,8,9),the diffuser inlet plane(10).
The RMS value of the velocity at the three directions from test and the simulation separately at the position of point 4,point 5,point 6and point 9 were compared and shown in figure 5.
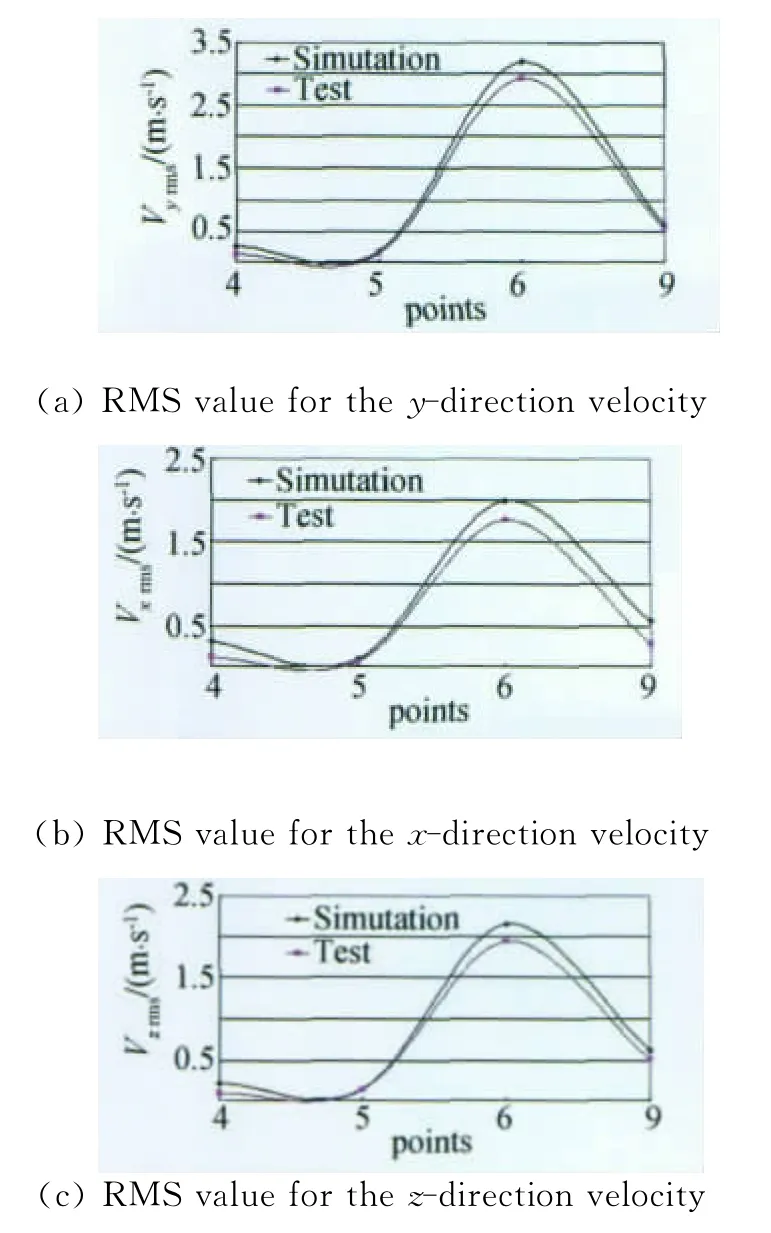
Fig.5 RMS value of the velocity图5 速度均方根值图
The test result and the simulating result were found to agree well.Such agreement validated the simulating method used in the paper.
1.5 Simulating results
The data obtained in the time domain were changed into the frequency domain.Thus the power spectral density(PSD)figures for each point(see figure 6)were obtained as follows.
Figure 6shows the velocity fluctuations with varied inlet oscillating frequencies at different positions.The labels on the right of the figure denote the different fluctuating frequencies which were set in the inlet velocities.
From figures it was seen that at the position of the inlet plane the velocity fluctuations with different frequencies were successfully established.
In the plenum,out of the nozzle plane the flow spout into the plenum.A typical jet flow was formed which intensified the unsteadiness of the flow.Further downstream,the velocity fluctuations at frequencies of 20Hz and 30Hz were gradually enlarged,while the fluctuations at other frequencies disappeared at the downstream positions.At the position of the collectors the peak value of the velocity fluctuation for the frequency of 20Hz became the dominant one.The frequency of 20Hz is just one of the buffeting frequencies inside the open-jet wind tunnel plenum.So we can imagine the flow power under the 20Hz have some relationship with the buffeting phenomenon.
Since the frequency of 20Hz was the dominant one,then the cases for frequency of 20Hz were further simulated with different constant mean velocities.They were 2.5m/s,2.7m/s,2.83m/s,4.17m/s and 5m/s.The results for PSD value at different points were shown in figure 7.
From figure 7it is noted that the peak of the velocity fluctuation appeared at the same frequency under the condition of varied constant mean velocities,which was still 20Hz.When the constant mean velocity of the inlet plane was less than 5m/s,the values of the velocity fluctuation were even higher.And at the position of collector the velocity fluctuation for 4.17m/s was enlarged mostly.
To clearly observe the distribution of the flow pulsation at the frequency of 20Hz,the root mean square(RMS)value of the unsteady statistics velocity magnitude for the case with the oscillating frequency of 20Hz and the mean velocity of 4.17m/s was shown in figure 8.
Figure 8(a)and(c)show the position of the observing section and the points,respectively.And the corresponding results are shown in the figure 8(b)and d).The distribution of the RMS value of the unsteady statistics velocity magnitude,which embodied the flow energy,is shown directly in figure 8(b).Out of the nozzle,the flow sprout into the plenum,at the position of the nozzle a shear layer was formed.Above the shear layer,the fluid outside the flow field with lower speed was entrained into the shear layer continually,which induced to the higher fluctuation.Below the shear layer,the fluid inside shear layer met the higher speed fluid inside the flow field;the speed difference caused the higher fluctuation here.At the position of the collectors,some of the flow was feedback,which will enlarge the upstream fluctuations.
From figure 8(d)it could be more clearly that at the position of the nozzle outlet plane and the collectors the fluctuations were higher compared with the fluid inside the flow field.Thus the frequency of 20Hz must have relation with the construction of the nozzle and the collectors.

Fig.8 RMS figure of the velocity magnitude图8 速度均方根值图
2 Test
The corresponding tests for unsteady flow inside the plenum were carried out.The contractive ratio of the contraction part was 1∶6,thus accord-ing to the simulating boundary conditions,the velocity for the nozzle outlet plane was set to 15m/s,16m/s,17m/s,25m/s and 30m/s separately.The PSD figures for the points are shown in figure 9and figure 10.
From figure 9we saw that for different points,the peak of the velocity fluctuations all appeared at the frequency of 20Hz.And the value of the velocity fluctuation at the position of the collector was larger than that at the position of the nozzle outlet plane.
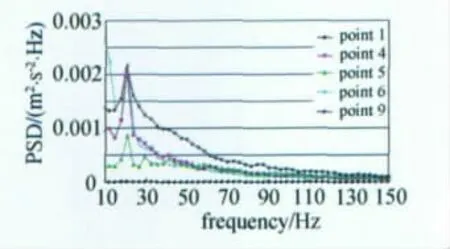
Fig.9 PSD figure at different points for case of V=30m/s图9 速度为30m/s时不同测点处速度自功率谱密度图
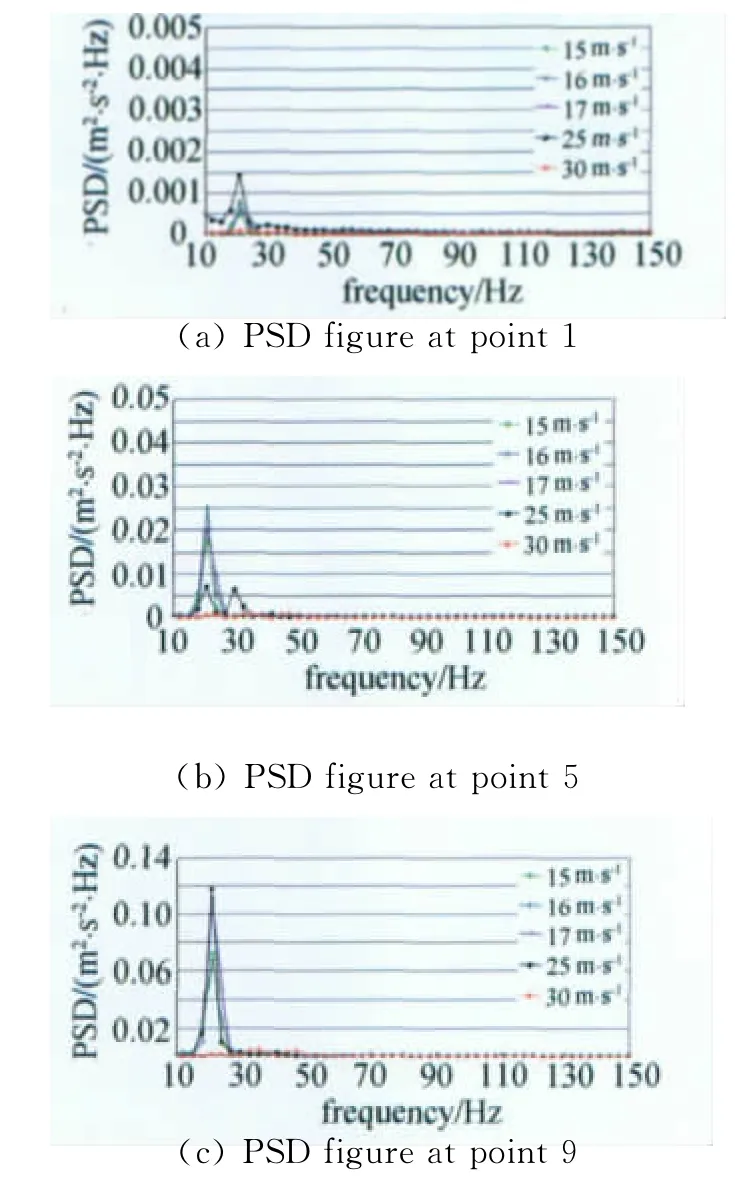
Fig.10 PSD figure for varied velocities图10 不同速度下速度自功率谱密度图
From figure 10it is seenthat the velocity fluctuations all had peak value at the frequency of 20Hz.As the velocity of the nozzle outlet plane was 25m/s,the velocity fluctuation was amplified the most.The test result again showed the distribution of the velocity fluctuation of the flow inside the plenum of the wind tunnel.
3 Discussions and conclusions
To study the flow field inside the plenum of a low speed 3/4open-jet type wind tunnel,both the CFD method and the test were used.The unsteady character of the flow inside the plenum of the wind tunnel under the low speed condition was investigated.
In the paper a simplified method was carried out in modeling the unsteady flow field.The inlet velocity was set as a combination of a mean velocity and an oscillating component.The frequencies of the fluctuation were set at 20Hz,30Hz,40Hz,45Hz,50Hz,80Hz,and 90Hz,respectively.For the case with oscillation frequency of 20Hz,the mean velocities at the inlet of the contraction were set at 2.5m/s,2.7m/s,2.83m/s,4.17m/s,and 5m/s,respectively.For these inlet velocity conditions,tests were carried out to study the unsteady flow field and to validate the simulating method.
In the plenum of the wind tunnel,the flow sprout out from the nozzle and a typical jet flow was formed,which induced to the high velocity fluctuation.At the position of the collectors the flow was feedback which brought some of the fluctuation back into the shear layer enhancing the velocity fluctuation.At positions both above the shear layer and below it,the fluctuation seemed high because of the huge velocity differences.
The velocity fluctuation,setting in the inlet velocity,was reserved and enhanced at the frequency of 20Hz and 30Hz.At the position of the collectors the value of the velocity fluctuation inside the flow at frequency of 20Hz was enhanced the most.With different invariable velocities the dominant frequency of the velocity fluctuation remains at 20Hz.
[1]YANG Zhi-gang.Shanghai automotive wind tunnel center project[C].Proc.7thStüuttgart Symposium on Automotive and Engine Technology,2007.
[2]JIA Qing,YANG Zhi-gang.Simulation and test research for model wind tunnel plenum at different collector angles[J].JournalofExperimentsinFluidMechanics,2007,12:93-96.
[3]JIA Qing,YANG Zhi-gang.Numerical simulation on effects of breather on flow field of open-jet automotive model wind tunnel[J].JournalofComputerAided Engineering,2007.16:92-96.
[4]ZHENG Zhi-qiang,YANG Zhi-gang.Experimental investigations of effects of collector on performances of automotive wind tunnel[C].SAE 2008 World Congress,SAE paper 2008-01-1206.
[5]Fluent 6.0,Fluent Inc,2002.
[6]LAUNDER B E,SPALDING D B.The numerical computation of turbulent flows[J].ComputationalMethods inAppl.Mech.&Engineering,1974.3.