Analysis of Key Attributes Influencing the User Satisfaction towards Applications
2013-07-14YuFanHoYiLunChiandIuonChangLin
Yu-Fan Ho, Yi-Lun Chi, and Iuon-Chang Lin
1. Introduction
The mobile phone has been evolved from a voice communication device to a powerful device during the last twenty years. With the enhancements in processing and storage capabilities, the reductions in hardware costs, and the development of mobile platforms such as Apple App Store, Google Play, Widows Phone Store and BlackBerry App World, mobile device has become an essential daily component for hundreds of millions of people around the world. Apart from a means of voice communication, it can be not only an entertainment center, keeping individuals happy and occupied for hours, but also a production center,capable of granting access for individuals to large knowledge bases of information in their palms[1]–[3].
Mobile applications (also mobile apps) are software applications that run on smart phones, tablet computers, and other mobile devices. They have been currently evolving very rapidly and explosively since the rise of mobile platforms[4]. There are billions of mobile apps on the mobile platforms. Each mobile app has its own page on the mobile platforms describing function description, printed screen of the mobile app, user comments, released date,updated date, etc.
Users can browse information, download mobile apps from the mobile platforms and install them on their mobile devices and may leave their opinions, comments and ratings with the degree of satisfaction to the mobile apps.However, people have no idea of which attributes on the page will influence the user satisfaction unless they do install and experience the mobile applications themselves.
In order to find out which attributes of mobile apps have influences on user satisfaction, the methodology involving three phases, data collection, data processing, and analysis is proposed. The information of some mobile apps are collected and processed as attributes. These attributes will be evaluated with the analysis of variance and correlation coefficient to find out which attributes have influence on the user satisfaction.
The remainder of this paper is organized as follows.First, the literature review is introduced in Section 2. Then,the procedure of proposed methodology is presented in Section 3. Section 4 is devoted to the analysis results of variance and correlation coefficient, and conclusions and further research directions will be stated in Section 5.
2. Literature Review
2.1 Mobile Applications
Mobile applications (also mobile apps) are software applications that run on smart phones, tablet computers, and other mobile devices, and currently are evolving explosively due to the rise of the mobile platforms[4].
On the mobile platform, billions of mobile apps are available with their own web pages to present app information. Users can then download apps from platforms,install them and leave their opinions and satisfaction ratings to them[5].
2.2 Analysis of Correlation Coefficients
In statistics, correlation (or correlation coefficients)refers to the strength and direction of the linear relationship between two mathematical variables or measured data values. The meaning of correlation analysis is to measure the mutually independent distance between two variables and is useful to evaluate the relationship between them.
According to the different data attributes, there are different correlation coefficients measuring the degree of correlation, such as Pearson product-moment correlation coefficient, Spearman rank correlation, Tetrachoric correlation coefficient, biserial correlation coefficient, and point-biserial correlation coefficient. In all cases, the value is between -1 and 1, which represents the relationship between two variables. The definitions of the correlation coefficient (corr.) are described as follows:
· Corr. is positive in the case of a positive (also referred as increasing) linear relationship, and negative in the case of a negative (also referred as decreasing) linear relationship.
· The closer the corr. is to either -1 or 1, the stronger the correlation between the variables. When it approaches to zero, there are less signs of relation between the two variables.
3. Proposed Methodology
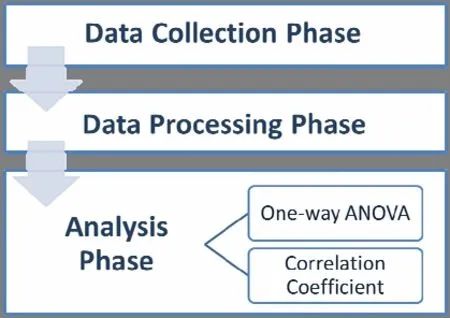
In this research, the goal is to evaluate and discover the attributes influencing the user satisfaction towards applications on mobile application store. To achieve the goal, the methodology involves three phases, data collection, data processing, and analysis phase. The data collection phase yields a great deal of raw data about mobile application, then the data processing phase is to transfer those raw data into information that can be used in the third phase, analysis. The procedure of the proposed methodology is shown in Fig. 1.
3.1 Phase 1: Data Collection
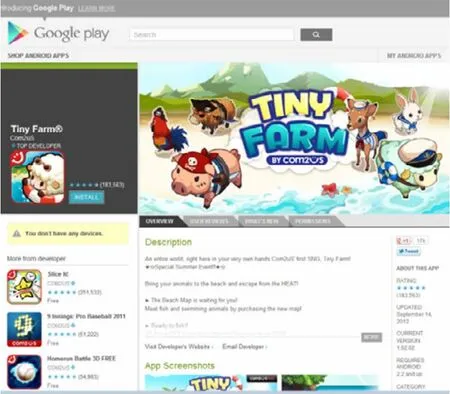
The data about eight attributes of 48 mobile applications were collected from the online mobile application web “Google play(https://play.google.com/store)”. (Refer to Fig. 2.) The attributes collected from these mobile applications include number of installation, run chart of user installing in the last 30 days, the number of users giving the application a rating value, the number of other applications developed by the author, the release date, last updated date, the number of comments in the last 30 days, and the average rating the application get. The raw data will be kept and used for the second data processing phase.

Fig. 1. Procedure of the proposed methodology.

Fig. 2. Online mobile application web Google play(https://play.google.com/store)”.
3.2 Phase 2: Data Processing
Eight attributes of mobile applications were collected at the phase 1. However, the raw data cannot be used for analysis to examine which attributes possibly influence the user trust. In order to convert these raw data into usable information analysis, the data processing was implemented.The 8 attributes of mobile applications collected in the phase 1 are listed in Table 1.
These attributes are further described below:
1) The number of installation (NI): NIis the number of the users who have installed the target mobile application.If NIis large, it reveals that the target mobile application is popular to many users. NIgetting from the mobile application web page is an interval value, like 10,000,000–50,000,000. The value after processing is the average of maximum and minimum.
2) Run-chart value: The run chart from the mobile application web page is a graph (see Fig. 2) that displays daily number of users who have installed the target application in the last 30 days.
In order to evaluate whether the trend in the graph is an attribute influencing users’ satisfaction, three quantifications are used.

Table 1: Arrangement of channels
a) The starting slope comparison (slope cp.): Divide the horizontal axis into six parts. If the starting slope of run chart is positive, the run-chart value is increased by 1. If the starting slope of run chart is negative, the value is decreased by 1. Otherwise, if the starting slope is zero, the value is increased by 0. Following the above method and summing up all 6 values, the total slope cp. of the run chart will be obtained. Fig. 4 is the sketch map of slope cp.
b) The high peak comparison (peak cp.): Divide the horizontal axis into six parts and compare the high peak between the two adjacent parts. If the peak in the latter part is higher than the one in the former part, the run chart value is increased by 1. If the peak in the latter part is lower than the one in the former part, the value is decreased by 1.Otherwise, if the two peaks are equal, the value is increased by 0. Following the above method and summing up all 5 comparisons, the total peak cp. of the run chart will be obtained.
c) The slope of the run chart (slope): Divide the vertical axis into four parts. Let the falling part of ending point minus the one of starting point and get the value of difference between starting and ending point.
3) The number of ratings (NR): NRis the number of users that have given the target application rating.
4) The number of developments (ND): The developer of the mobile application may also have developed other mobile applications. NDis the number of mobile applications the developer of the target mobile application has developed.
5) Release date (RD): RDrecords the date when the target mobile application is released. Here the release date is measured in months from release date to the date of collection.

Fig. 3. Run-chart graph.

Fig. 4. Sketch map of slope cp.
6) Updated date (UD): UDrecords the date when the target mobile application is updated by the developer recently. Here the updated date is measured in months from updated date to the date of collection.
7) The number of comments (NC): NCis the number of comments users have given to the target mobile application in the last 30 days.
8) User rating (R): R is the average rating that the target mobile application has received from the installing users.The rating is rated from 1 to 5 which reveal the users’satisfaction to the mobile application.
In this research, R is used to represent the user satisfaction towards the mobile application. The relationship between the first seven attributes and the last attribute R will be evaluated in the third phase.
3.3 Phase 3: Analysis
In this phase, two statistical tests are applied to check which attribute will affect user’s opinion of rating. The first test is analysis of variance (ANOVA). ANOVA evaluates the degree of independent variables (or input variables) on dependent variable (or result) through the relationship between two data sets of variables[6]. Those attributes related to the user satisfaction will be selected and the others will be discarded[7]on this test. To check whether the test attributes have significant impact towards the user rating, some null hypotheses are set up as following.
H1: The attribute of NIhas no significant impact towards R.
H2: The attribute of run-chart value has no significant impact towards user rating.
H3: The attribute of NRhas no significant impact towards R.
H4: The attribute of NDhas no significant impact towards R.
H5: The attribute of RDhas no significant impact towards R.
H6: The attribute of UDhas no significant impact towards R.
H7: The attribute of NChas no significant impact towards R.
Here the p-value approach is applied. If the p-value between attributes and R is smaller than 0.05, there is a sufficient evidence to conclude that the attribute has a significant impact towards user rating and the null hypothesis will be rejected[8]. Accordingly, the attributes which have significant impact towards user rating will be derived.
For the second test, correlation analysis, the goal is to evaluate the degree of correlation between each attribute and user rating. The correlation coefficients used in this research is K. The Pearson’s correlation coefficient value of two attributes, X and Y, is given below[9],[10]:

where X represents the average value of X ,Y represents the average value of Y, and n is the total number of item.
The results have been evaluated as stated in Section 2.2.
4. Analysis Results
From the two tests stated in the previous section, the results are as follows.
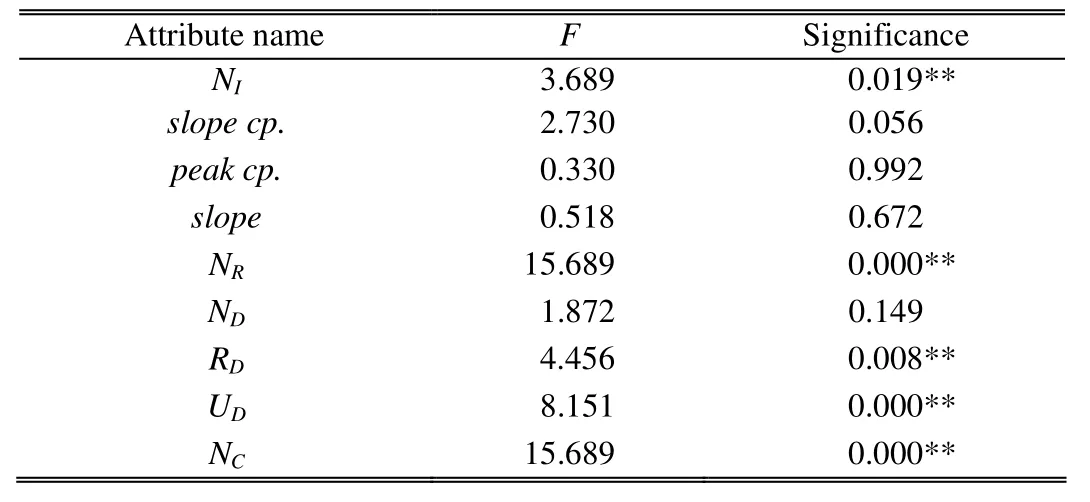
In the analysis results of ANOVA shown in Table 2, the p-value of NI,NR, RD, UD, and NCare all smaller than 0.05 and the null hypotheses of those attributes can be rejected.So that it can be concluded that the attributes of NI, NR, RD,UD, and NChave significant impact towards user rating.
On the other way, the p-value of slope cp., peak cp.,slope, and NDare above 0.05. It implies that there are no sufficient evidences to reject the four null hypotheses.
After the analysis of ANOVA, the attributes having significant impact towards user rating are derived and the attributes are NI, NR, RD, UD, and NC. The next step is to apply the analysis of correlation coefficient to those attributes, which aims to evaluate the degree of correlation to user rating. The analysis results are shown in Tables. The** symbol in the tables represents that the attribute is up to significant levels and has the correlation to the target attribute.
It can be seen that the significances are all below 0.05 which can be concluded again that the five attributes have impact towards user rating. The Pearson’s correlation coefficient of RDand UDare -0.429 and -0.606, which implies that the two attributes have negative correlation to user rating. The Pearson’s correlation coefficient of NI, NR,and NCare 0.337, 0.518, and 0.406, which implies that the three attributes have positive correlation to user rating.
From results above, there are five attributes relative to the user rating, including the number of installation, the number of ratings, the number of developments, releasedate and the number of comments. Two of them, including release date and updated date, are negative correlation to user rating. If the release date and the updated date of one mobile application are long ago, it may be predicted that users may be unsatisfied with the mobile application. The remaining three, including the number of installation, the number of ratings, and the number of comments, are positively relative to user rating. The finding also reveals that if the number of installation, ratings or comments of one mobile application is considerable, it may be predicted that the mobile application is popular among users.

Table 2: Analysis results of ANOVA

Table 3: Analysis results of correlation coefficient
5. Conclusions
In this research, the goal is to find out the key attributes of mobile application influencing the user rating towards applications on the online mobile application store. Eight attributes which are considered to have significant impact towards user rating and the null hypotheses are relatively established. However, analysis results of ANOVA indicate that five attributes including NI, NR, ND, RD, and NC, are truly relative to user rating.
Among these five attributes, release date and updated date have negative correlation to user rating, which indicates that if the release/updated date of the mobile application goes longer, the user may be more unsatisfied with the mobile application. Otherwise, NI, NR, and NC,have positive correlation to user rating, which reflects that if any of them gets more, the user may be more satisfied with the mobile application.
Those features may be applied to the recommendation system to recommend the mobile applications to users who will probably like. However, there is still much useful information which has influence on the user satisfaction.There will be many more issues to be discussed in the future.
[1] A. K. Jain and D. Shanbhag, “Addressing security and privacy risks in mobile applications,” IT Professional, vol.14, no. 5, pp. 28–33, 2012.
[2] Q. H. Mahmoud and P. Popowicz, “Toward a framework for the discovery and acquisition of mobile applications,” in Proc. of the 9th Int. Conf. on Mobile Business and Global Mobility Roundtable, Athens, 2010, pp. 58–65.
[3] G. Andrea and M. Florian, “AppAware: which mobile applications are hot?” in Proc. of the 12th Int. Conf. on Human Computer Interaction with Mobile Devices and Services, Lisboa, 2010, pp. 431–434.
[4] K. W. Tracy, “Mobile application development experiences on Apple’s iOS and Android OS,” IEEE Potentials, vol. 31,no. 4, pp. 30–34, 2012.
[5] D. Christoffer and M. Simon, ‘‘Utilizing implicit feedback and context to recommend mobile applications from first use,” in Proc. of 2011 Workshop on Context-Awareness in Retrieval and Recommendation, California, 2011, pp.19–22.
[6] M. A. Rezgui, M. Ayadi, A. Cherouat, K. Hamrouni, A.Zghal, and S. Bejaoui, ‘‘Application of Taguchi approach to optimize friction stir welding parameters of polyethylene,’’in Proc. of the 14th Int. Conf. on Experimental Mechanics,Poitiers, 2010, doi: 10.1051/epjconf/20100607003.
[7] A. Antonio, J. L. Aznarteb, and J. M. Bemitezc, “Empirical study of feature selection methods based on individual feature evaluation for classification problems,” Expert Systems with Applications, vol. 38, no. 7, pp. 8170–8177,2010.
[8] M. S. Norazah, “Examining factors influencing customer satisfaction and trust towards vendors on the mobile Internet,” Journal of Internet Banking and Commerce, vol.17, no. 1, pp. 1–11, 2012.
[9] T.-H. Dao, S.-R. Jeong, and H. Ahn, “A novel recommendation model of location-based advertising:context-aware collaborative filtering using GA approach,”Expert Systems with Applications, vol. 39, no. 3, pp.3731–3739, 2012.
[10] G. Ozbal, H. Karaman, and F. N. Alpaslan, “A content-boosted collaborative filtering approach for movie recommendation based on local and global similarity and missing data prediction,” Computer Journal, vol. 54, no. 9,pp. 1535–1546, 2011.
杂志排行
Journal of Electronic Science and Technology的其它文章
- Design of a House Lease Management System in Cloud Computing
- Parallelizing Modif i ed Cuckoo Search on MapReduce Architecture
- Access Control Policy Analysis and Access Denial Method for Cloud Services
- A Unified Framework of the Cloud Computing Service Model
- ID-Based User Authentication Scheme for Cloud Computing
- Modified Packing Algorithm for Dynamic Energy-Saving in Cloud Computing Servers
