Global Gold Mining: Is Technological Learning Overcoming the Declining in Ore grades?
2013-06-15AdrianaDomnguezAliciaValero
Adriana Domínguez, Alicia Valero
1CIRCE, Centre of Research for Energy Resources and Consumptions, Universidad de Zaragoza, Zaragoza, Spain
Global Gold Mining: Is Technological Learning Overcoming the Declining in Ore grades?
Adriana Domínguez1†, Alicia Valero1
1CIRCE, Centre of Research for Energy Resources and Consumptions, Universidad de Zaragoza, Zaragoza, Spain
Submission Info
Communicated by Sergio Ulgiati
Gold mining
Technological learning
Declining ore grades
Learning curves
Future availability of mineral resources is influenced by two opposed facts. On the one hand, general trends suggest a long-term decline in ore grade, which increases energy consumption in mining industry. But on the other hand there have been technological transitions that might avert rises in energy consumption. The aim of this paper is to become acquainted if technological breakthroughs that have occurred can preclude the rising energy demand for the gold mining industry. As experience is acquired, material and energy efficiency increase and technical changes can be expressed through the so called learning curves. Accordingly, the learning curve approach is applied to several data sets of 17 major gold producing countries. Our results show that technological learning is as dependent on ore grade as it is on mining operation and recovery processes. Applying the learning curve method we obtain average progress ratios varying from +20% to -22%. This survey allows us to have a better understanding of the mining sector and the outcomes of technology evolution together with ore grade declining by means of identifying best mining practices around the world.
© 2013 L&H Scientific Publishing, LLC. All rights reserved.
1 Introduction
The mining industry is experiencing groundbreaking changes such as commodity price fluctuating, rising energy demand, water and cyanide consumption, increasing costs, declining ore grades, greenhouse gas emissions, increasing waste volumes and the challenge to achieve a more sustainable industry. Thence, sustainability practices have become important for most major mining companies in order to reach a balance between socio-political, economic and environmental issues.
Otherwise, there is a debate about the availability of commodities in the future. Although there is evi-dence supporting the long-term decline in gold ore grades, there also exists the possibility that technological learning will overwhelm this fact. Hence, this paper analyzes the relationship between two issues: the decline in ore grades and the rising in energy consumption per ton of metal extracted.
The analysis of data set on historic gold mining in the main gold producing countries was carried out by means of linking resource extraction with energy use through the learning curves approach. Learning curves were originally developed to evaluate the effect of learning by doing in manufacturing. However, there are new applications such as analysis innovation and technical change in energy technology.
This paper looks over energy data on gold mining for Australia, North America, Africa and the Asia-Pacific compiled by Mudd [2-3], who pointed out the critical aspects of mineral resource sustainability such as resource intensity linked to technology.
1.1 Gold mining issues
1.1.1 Production and reserves
The world gold production during 2010 was produced in the following countries: China (13.8%), Australia (10.2%), USA (9.2%), South Africa (7.6%), Russia (7.6%), Peru (6.8%), Indonesia (4.8%), Ghana (4%), Canada (3.6%), Uzbekistan (3.6%), Brazil (2.6%), Papua New Guinea (2.4%), Mexico (2.4%), Chile (1.6%) and other countries (19.7%). The major reserves are located in Australia (14.4%), South Africa (11.84%), Russia (9.86%) and Chile (6.71%). Reserves data are dynamic because they may be reduced as ores are mined and/or the extraction feasibility decreases. More commonly, they may continue to increase as further deposits (known or recently discovered) are developed. Additionally, currently exploited deposits that are more completely explored and/or new technology or economic variables that may appear enhance their economic feasibility [4]. Hence, reserves data are a major issue because they betray where the largest resources are, allowing us to be aware of the countries that must improve its mining methods in order to extract resources in the best possible way.
1.1.2 Energy consumption
Gold production is one of the processes with the greatest energy requirements in the mining industry. Energy consumption is dependent on several factors such as the recovery process and the kinds of mining operations analysed in this paper. For instance, energy consumed in open pit (OP) mining usually is greater than the energy required in underground (UG) mining because ore grades in open pit mines are smaller than those presented in underground mines. For open pit mines the average energy requirement is 170,000 GJ/t whilst for underground mining is 127,000 GJ/t of gold produced. The energy required to separate the gold from the mine increases abruptly when the concentration of the ore in a deposit tends to zero.
1.2 Learning curves theory
Learning curves come out as an empirical method to assess the effect of learning on technical change. As experience is acquired, efficiency and quality upgrade, mining costs decline and wastes are reduced. Technical change is a gradual process that entails technical knowledge and investment, but also an increase in material and energy efficiency. Both material and energy efficiency increase independently and changes can be leaded to the learning by doing concept [5]. Technical change is introduced by implementing technology learning rates, which specify the quantitative relationship between the cumulative experiences of the technology and cost reductions [6].
There is a widespread use of learning curves because of their usefulness to quantify the impact of increased experience and learning of a given technology. This allows obtaining a representation of technical change with a variety of different indicators of technological performance.
A good number of studies based on the learning curves theory have been carried out. For instance, Soderholm [6] used learning curves for assessing the economic outlook of renewable energy technologies to link future cost developments to current investment in new technology. Other studies [7,8] about the impact of quality on learning, suggest that learning is the link between quality improvement and productivity increase.
The simplest and most frequently representation of learning curves in energy technology studies is the Wright’s log-linear model [9]:

whereYxrepresents the energy required to produce thex-th unit,Y0is the theoretical energy of the first production unit,xis the sequential number of the unit for which the energy is to be computed andbis a constant reflecting the rate energy decrease from year to year (learning index) and is calculated as:
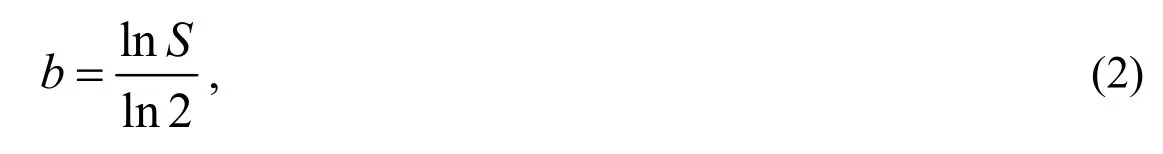
whereSis the energy slope expressed as a decimal value (learning rate), while (1-S) is defined as the progress ratio (PR) which expresses the fraction to which energy requirements are reduced with cumulated production.
Nonetheless, there is a limit on the energy use to ore production that cannot be exceeded with increasing experience and in this case it is the minimum theoretical energy required to concentrate a substance from an ideal mixture of components [10] and is given by the following expression:
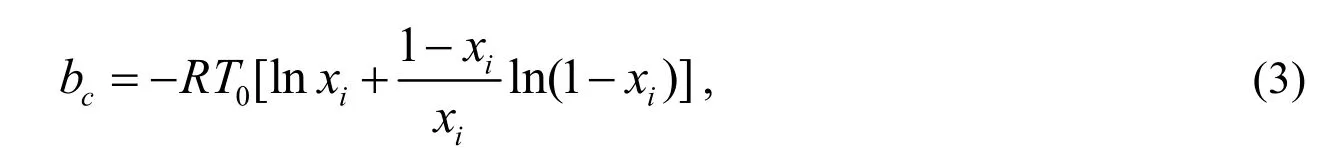
wherexiis the concentration of substancei, Ris the gas constant (8.3145 J/molK) andT0is the reference temperature (298.15 K).
Considering the energy limiting value, the learning curve can be expressed as:

Equation (4) integrates thermodynamic concepts to the learning curve analysis.
In this case technology learning rates state the correspondence between the cumulative experience of the technology and the energy requirement reductions.
Energy requirement reductions are the result of learning by doing. For instance, performance improves as new technologies and mining methods are implemented. Accordingly, learning curves will be used to empirically quantify the impact of accomplishing new mining practices on the energy consumptions of ore mining.
There is an enhancement for the simplest learning curve by applying a factor related with research and development. This extended formulation is known as the two factor learning curve (TFLC) expressed as follows:

whereKSis the knowledge stock and c is the elasticity of learning by researching [11]. Both types of learning curves are the most commonly used to assess technology learning rates in the energy sector [6].Multiple-factor learning curves that account for other independent variables besides cumulative production represent an approach to get a better understanding of technological learning by enhancing the knowledge base [12,13].
Learning rates depend on the data points that are chosen. Previous surveys reveal significant variability in estimated rates between different energy technologies, which ranges from 1% to 41.5% [11]. On the other hand, the study developed by McDonald shows that the average value of learning rates for energy technologies is 16-17% and learning rates for manufacturing is 19-20% [14]. Negative learning rates can be interpreted as a consequence of experience depreciation, if no important external factors (such as declining ore grades in mining technologies) are influencing the production process.
The estimation of learning curves has some highlights. For instance, the need to explore the effect of detaching single observations especially outliers that may affect the learning rate estimate.
2 Learning curves applied to global gold mining
Learning rates and progress ratios were calculated for each mine using Eq. (2) and Eq. (4). The information was grouped according to the different mining technologies used, because learning by doing will differ between mines, countries and technologies.
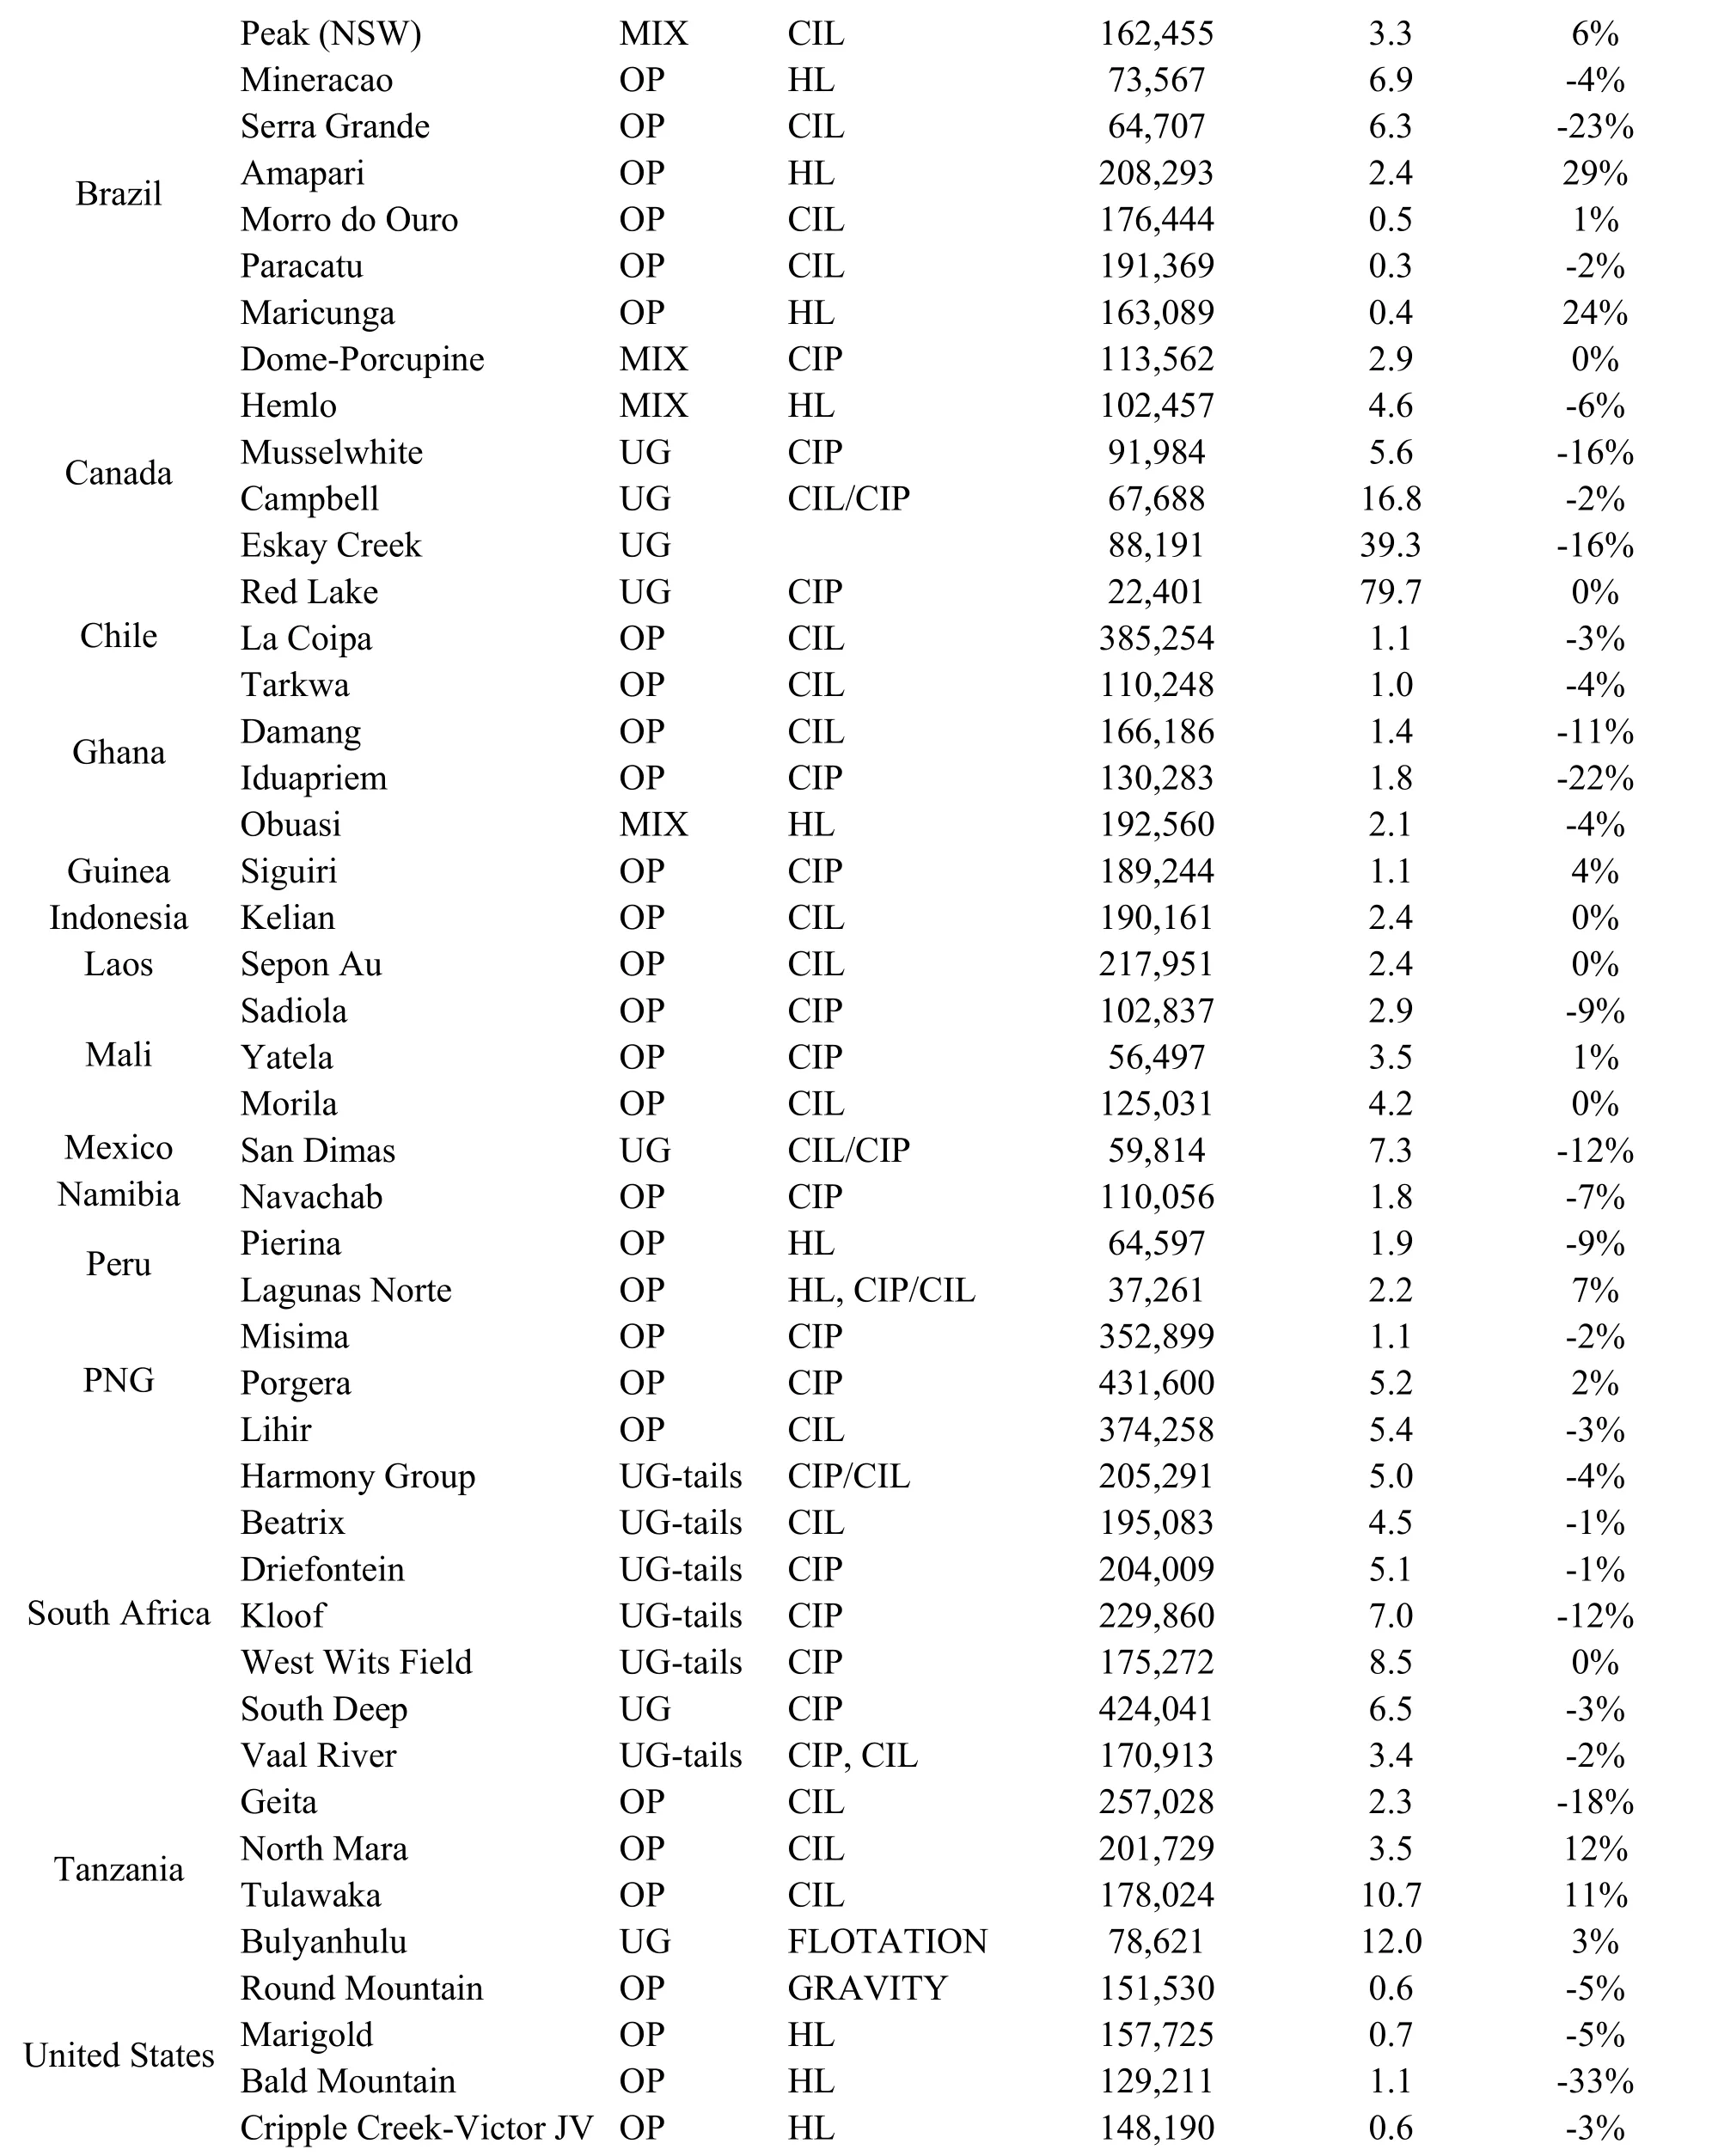
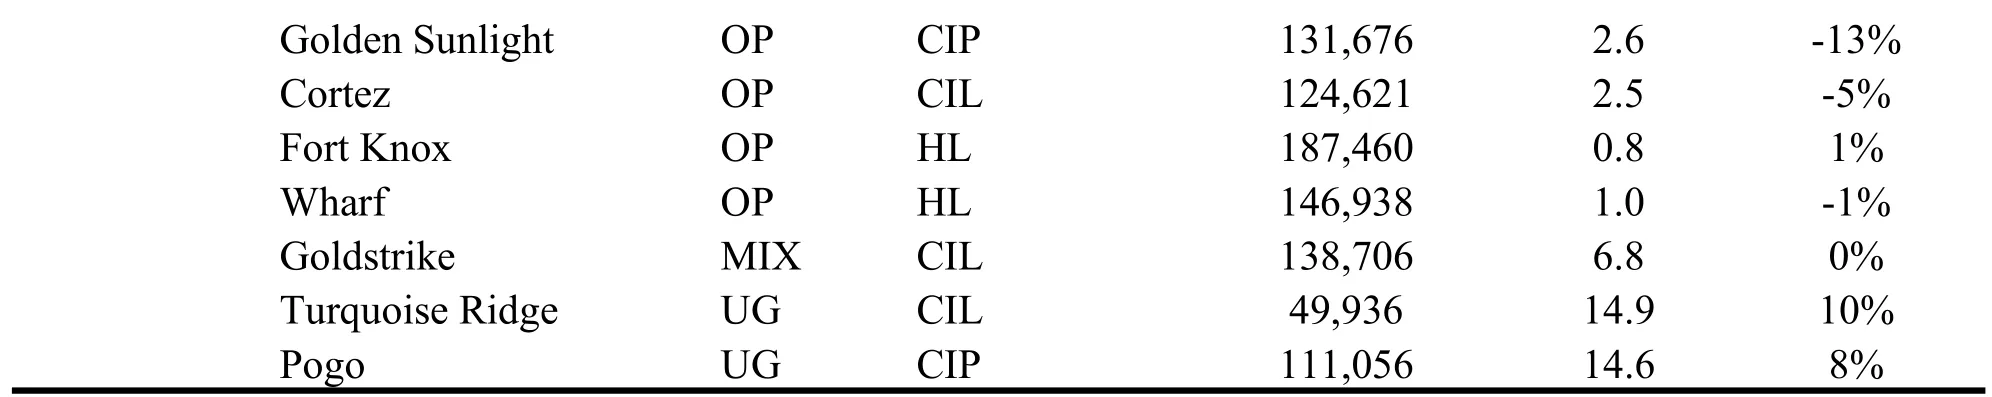
Progress ratios are different for each country and even for each mine although they use the same recovery process technology. This is due to inherent factors to each mine such as project age, depth, ore types, etc. Results of the analysis performed for different mining operations and recovery processes are shown in Table 1.
The assorted configurations of gold mines like open pit (OP), underground (UG) or mixed (MIX), as well as the energy source (diesel, coal, hydro, gas or any mix among them) are factors that influenced the progress ratio.
Recovery process technologies show average progress ratios around ±25% as shown in Figure 1. Open pit operations with heap leach technology (HL) as recovery process as well as underground operations using carbon in pulp (CIP) 1 technology are the mining options with the greatest progress ratios.
2.1 Argentina
Gold is produced in two open pit mines; Veladero and Cerro Vanguardia. There is another important mine in Argentina named Bajo la Alumbrera in which gold and copper are produced.
The Veladero mine [16] with typical ore grades under 2.5 g/t Au started its production on 2005 so it is a new mine that has been increasing its production with lower energy requirements. Hence positive learning rates are obtained when applying the learning curve approach. Otherwise, Cerro Vanguardia mine with ore grades between 7 and 8 g/t Au has been dispalying a decline in its ore grade. Although cumulative production has grown, the energy per unit of gold produced has also increased and thereby negative progress ratios are presented. Available data: from 2005 through 2007.
Negative progress ratios convey that technological learning has been unable to overcome the increase in energy consumption during mining operations due to the declining in ore grade. On the other side, positive progress ratios imply that mining recovery processes have achieved to maintain or decrease the energy consumption during mining operations through time. Consequently, the progress ratio becomes an indicator to identify those mines where mining practices are successful when saving energy.
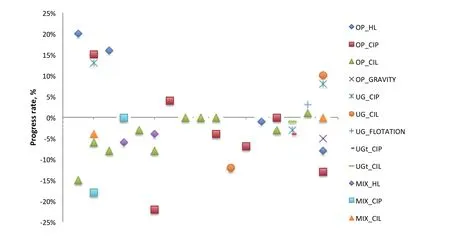
Fig. 1 Distribution of average progress ratios for gold mining industry.
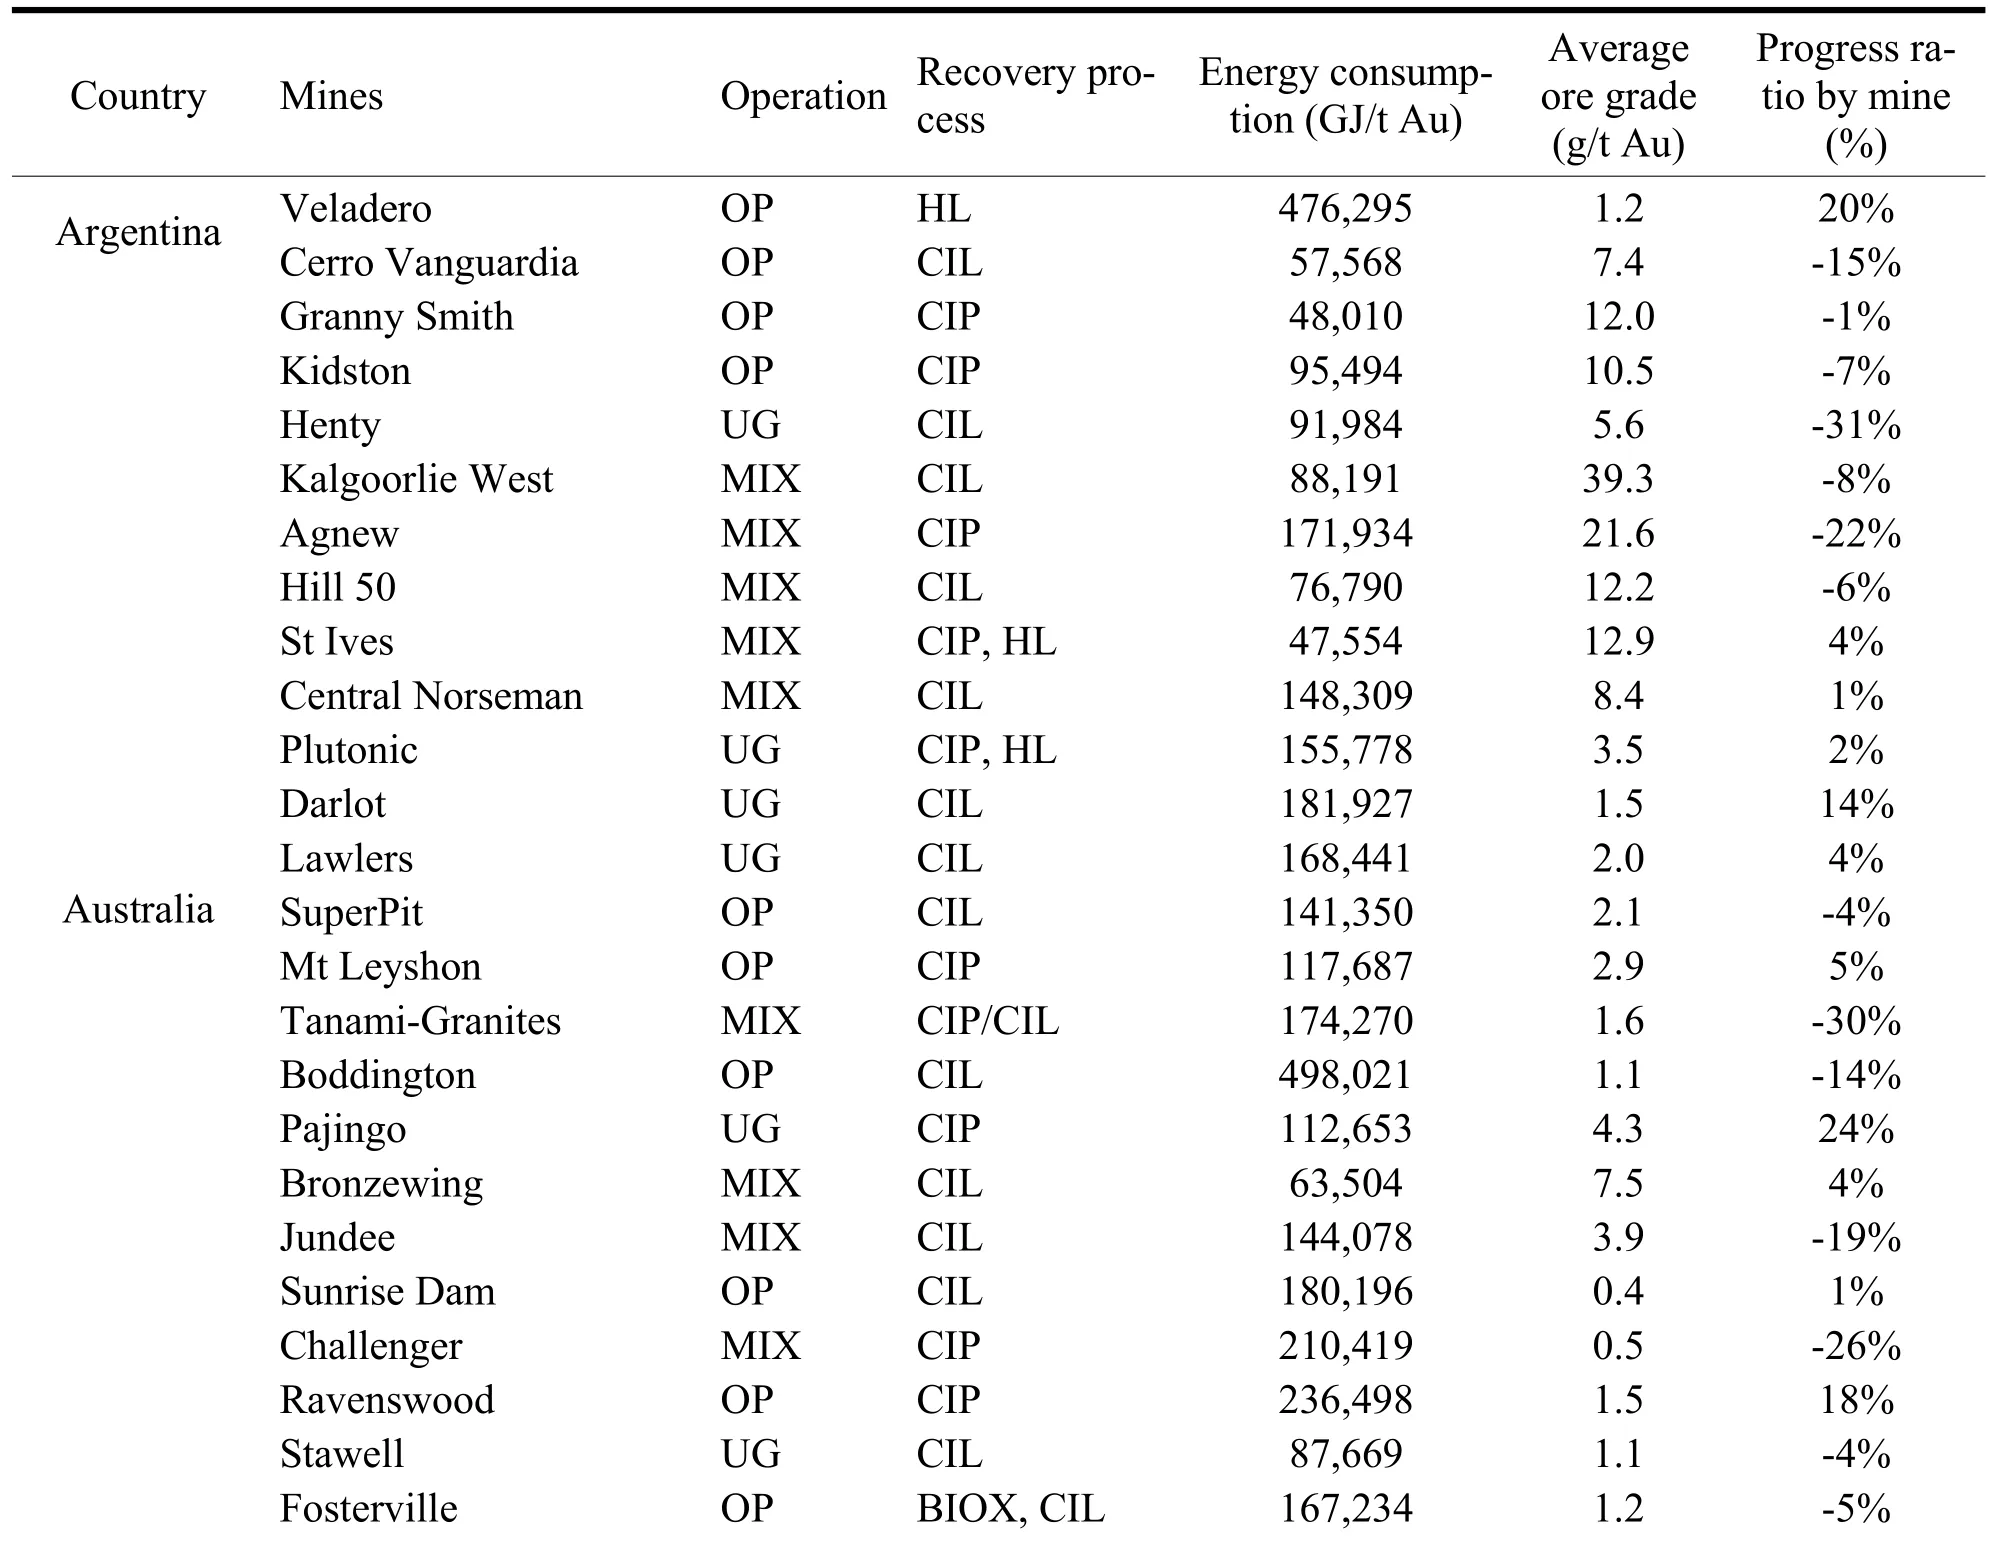
Table 1 Progress ratio for global gold mining
In the coming sections, the key aspects of gold mining in the largest gold producer countries are briefly analyzed.
2.2 Australia
Gold is produced in almost 30 mines, including open pit, underground and mixed. A previous work accomplished by Valero et. al. [17] analyzed the influence of technical development and declining ore grades on the availability of Australian gold resources. The obtained results suggest that although progress in technology has been made, in most cases energy requirements are increasing, because the main variable is the ore grade. Progress ratios represent the amount of improvement in mining technologies for several mines in Australia, such as Kidston [18], Henty [19], Kalgoorlie [20], Agnew [21], St Ives [22], Plutonic [23], Darlot [15], Lawers [15], Superpit [23], Mt. Leyshon [24], Tanami [25], Boddington [23], Pajingo [26], Sunrise Dam [27], Challenger [23], Ravenswood [28], Peak [29]. Available data: from 1990 through 2008.
2.3 Brazil
There are two mines in which gold is extracted with an ore grade range less than 0.35 g/t Au, Maricunga and Paracatu [30]. Maricunga mills only 35% of the total ore milled in Paracatu. In that case, the energy consumption in mining is related with quantity (cumulative production) and quality (ore grade) resulting a positive PR of 24% for Maricunga but not for Paracatu, which has a negative PR. Amapari mine [31] shows an improvement from 2005 to 2006 when it reduces its energy requirement almost 60% even though ore grade decreases. Hence, it presents the highest progress ratio of all mines analyzed. Available data: from 2001 through 2007.
2.4 Canada
Dome-Porcupine mine belongs to Goldcorp Company [32], this mine does not show variation in progress ratios although three situations were identified: 1) with the same ore grade in 1997 and 2005, an increment in energy consumption was presented, this can imply that there was no improvement in the process and that this increase can be caused by the deterioration in the mining equipment, 2) energy consumption can diminish although ore grade declines; for instance from 1997 to 1998, where energy reduction was influenced by the increase in the tons of ore milled, leading to a positive learning rate, and 3) the expected behavior of energy increase when ore grades decrease and vice verse.
Hemlo [15], Musselwhite [32] and Campbell [23] mines show negative progress ratios as a result of ore grade declining, as well as the increment in energy consumption although ore grade remains constant.
Eskay Creek Mine belongs to Barrick’s Company. This mine is a clear example of ore grade decliningtrend insomuch as ore grade in 2001 was 53.14 g/t Au and then in 2007 it was of 20.91 g/t Au. This situation has an effect on the energy consumption because in 2001 the energy required was 35.09 MJ/kg Au while in 2007 it reached 203.378 MJ/kg Au. Accordingly, negative progress ratios are presented. For values of ore grade between 40 and 90 g/t Au, besides Eskay Creek, there is another mine Red Lake from Goldcorp. Inc. [32]. Available data: from 1997 through 2007.
2.5 Chile
Coipa mine [33] uses conventional open pit mining methods and crushing, grinding and leaching operations to process gold. Energy consumption has been increasing over time, leading to negative progress ratios. Available data: from 2003 through 2004.
2.6 Ghana
The main gold producing country in West Africa is Ghana. For ore grades below 1.5 g/t Au, there are two mines from Gold Fields Co.: Tarkwa Gold Mine [34] and Damang Gold Mine [34]. The first one consists of six open pits, two heap leach facilities, and a CIL plant. The operation is currently mining multiplereef horizons from open pits and there is potential for underground mining in the future. Tarkwa has mineral resources equal to 433.75 gold tons and a mineral reserve of 280.6 tons. The second one is composed of multiple open pits, surface stockpile sources and a CIL plant, with a mineral resource of 133.2 gold tons and a mineral reserve of 59.5 tons.
In accordance with the above information, it is reasonable that Damang mine has energy consumptions greater than Tarkwa mine for the same ore grade, leading to lower PR values. Furthermore, both mines show an increasing energy consumption trend under two conditions, when ore grades decrease and when cumulative production increase. Consequently, both mines have negative progress ratios, because under any circumstances there is an increase in energy consumption.
AngloGold Ashanti has two mines in Ghana: Iduapriem [27] and Obuasi [23]. The decrease in ore grade together with the rising energy consumption, result in negative progress ratios for both.
Available data: from 2004 through 2008.
2.7 Guinea
Siguiri gold mine belongs to AngloGold Ashanti Co. [23]. The annual production is 7.9 gold tons. It has a mineral resource of 138.9 gold tons and a mineral reserve of 73.7 tons. This mine fulfills the learning curve theory, since energy consumption decreases as cumulative production increases despite the ore grade is declining. Consequently, positive progress ratios are presented. Available data: from 2005 through 2007.
2.8 Indonesia
Kelian Equatorial Mining [35] is 90% owned by Rio Tinto. This open pit mine started its production in 1992 and finished it in 2004. The gold recovery process uses SAG and Ball Mills followed by gravity separation and carbon in leach (CIL) cyanidation. This mine shows a neutral PR. Available data: from 2002 through 2004.
2.9 Laos
MMG owns Seapon mine [36] which has gold and copper operations. Gold has been produced since 2002. In early 2005, an expansion of the original gold processing facility was completed doubling the capacity of the gold processing plant to 2.5Mt/year, with a new crusher and mill allowing more flexibility and efficiency in the treatment of Sepon ore. The mine has 93.5 tons of gold resources and a reserve of 5.1 tons. The Seapon gold mine is expected to be operational until 2012. There is not enough data to establish a trend in its energy consumption (its PR is zero). Available data: 2003 and 2005.
2.10 Mali
Sadiola Gold Mine [37] is operated by AngloGold Ashanti. Yatela Gold Mine performs the elution and smelting processes at the nearby Sadiola Gold mine. Morila Gold Mine [38] is a joint venture company between Randgold (40%), AngloGold Ashanti Ltd (40%) and the State of Mali (20%). During the first quarter of 2009, a successful transition was made from open pit mining to stockpile treatment. The operation is expected to come to an end in 2013 although the mine is currently investigating the opportunity to retreat the Tailings Storage Facility (TSF) material, which would extend the mine life by approximately five years. For ore grades under 3 g/t Au, energy consumption increases as cumulative production rises, leading to negative progress ratios. The positive progress ratio is due to the increment in ore grade. For the ore grades ranging between 3 and 6 g/t Au, energy consumptions vary for each mine. However, the general trend is a decreasing in energy consumption when cumulative production grows. Consequently, a null progress ratio is presented. Available data: from 2005 through 2007.
2.11 Mexico
San Dimas Mine [39] consists of five ore zones or blocks where underground gold and silver mining operations are carried out using mechanized cut-and-fill mining methods, with LHD equipment feeding either truck or rail haul to the mills. After milling, cyanidation, zinc precipitation and smelting, dore bars are poured and then transported to refineries in the United States. Over the last ten years investments have been made to significantly upgraded tailings management, increasing production and achieving a lower cost structure in the future. Besides, in 2005, crushing capacity was increased, as well as improvements to the chemical treatment and leaching area. Energy consumption increases although cumulative production grows and ore grade increases, but there is a change in 2005 where a reduction in energy requirements is presented despite the fact that ore grade decreases due to the improvement in the processes indicated above. Nevertheless, a negative progress ratio is presented. Available data: from 2004 through 2006.
2.12 Namibia
Navachab gold mine [40] recovers 85% of gold. After CIP extraction, elution and smelting, the unrefined bullion is sent to Switzerland, where it is refined. Energy consumption increases throughout the due to the decline in ore grades, leading to a negative progress ratio. Available data: from 2005 through 2007.
2.13 Peru
Pierina [15] is an open-pit mine, with truck and loader operations. Ore is crushed and transported through an overland conveyor to the leach pad area. Run-of-mine ore is trucked directly to a classic valley-fill type of leach pad. Pierina is currently engaged in energy efficiency optimization efforts which lead to decreasing energy consumptions or increasing energy efficiencies as well as reducing greenhouse gas emissions [41]. Over the last decade, improvements in the leach pad system as well as in the surface water management system have been made [42]. Despite the improvements made in the mine, energy consumptions continue growing due to the ore grade declining, leading to negative progress ratios. This can imply that technological efforts adopted by the mine aren’t enough to bring down the energy increasing trend.
Yanacocha Gold Mine is the largest and most profitable gold mine in Latin America, with relatively low energy consumptions. It operates a complex of six open pit gold mines, five leach pads and two processing facilities. Gold is extracted from ore through a cyanide heap leach process. The solution is treated then by the Merrill Crowe process. After recovery, the contained metal is smelted and casted as bars containing 75% gold and 20% silver [23].
Lagunas Norte mine is owned by Barrick Co. [33]. In 2006 began the development of a high grade area with a longer hauling cycle. Gold and silver are recovered in a conventional clarification and zinc precipitation circuit, using the Merrill- Crowe process. For this reason, a decrement in energy consumption from 2006 is observed, leading to a positive progress ratio, regardless the ore grade declining.
Available data: from 2001 through 2007.
2.14 Papua New Guinea
Misima gold/silver mine [23] ended its operation in 2001 with stockpile milling anticipated to continue into 2004. Gold recovery used a standard crushing, grinding and carbon-in-pulp (CIP) flowsheet. All data analyzed for this mine indicates that both cumulative production and energy consumption increase. Besides, ore grades are declining, resulting in negative progress ratios.
For ore grades varying between 3 and 5 g/t Au, there are two mines that are mined: Porgera and Lihir mines. Almost all data for this range is from Porgera mine.The energy consumption grows as cumulative production does, whilst progress ratios vary according to the ore grade changes. For the interval within 5 and 6 g/t Au of ore grade, Porgera mine reveals a slightly trend of ore grade decrease, whilst cumulative production increase. The result is a decreasing tendency of energy consumption prompting a positive progress ratio.
The Porgera gold mine [23] is operated by a Barrick subsidiary. Both open-pit and underground mining methods are employed because it was initially an underground operation until 1997, but was resumed in 2002. Additionally an open-pit mining became increasingly important from 1993. A lot of changes have been made into the mining processes. For instance, the open pit has been mined in five stages, with final-stage overburden removal taking place during 2001. The open-pit truck and shovel fleet was expanded in 1995 and 1997. Besides, in 1999 a flotation expansion was installed as well as additional oxygen capacity to increase autoclave throughput. Run-of-mine ore is crushed and ground, gold is then recovered in a gravity circuit and flotation is used to recover a sulphide concentrate before the applying of CIP cyanide leaching process. The final step is the electrowinning process that produces bars of 88% gold average.
The Lihir gold mine [33] is an open-pit mine consisting of two adjacent overlapping pits. Its operations include; crusher, SAG and ball mill circuit, flotation circuit, pressure oxidation and CIL processing facilities, and electrowinning and smelting facilities to produce gold doré.
Available data: from 1997 through 2007.
2.15 South Africa
In South Africa the data are from the following mines: Harmony Group, Vaal River, Beatrix, Driefontein, South Deep, Kloof and West Field. Gold Fields company owns Beatrix, Driefontein, South Deep and Kloof.
Beatrix Gold Mine [34] consists of four surface operating shafts that mine various gold bearing reefs from open ground and pillars. The ore is processed at two metallurgical plants, where milling, CIL process, elution and gravity circuits, electrowinning and smelting operations are carried out.
Driefontein Gold Mine [34] includes eight shaft systems that mine various gold bearing reefs from open ground and pillars. Ore extracted from the bearing reefs is processed at three metallurgical plants. It has a centralized elution and carbon treatment facility since 2001. The mineral processing technology was based on SAG milling circuit followed by a cyanide leaching until the year 2003, when these processes were replaced by the CIP plant.
Kloof Gold Mine [34] is composed of five shaft systems and two gold plants, the gold is produced from a combination of underground mining and processing of surface waste rock dump material. For the mineral processing, two operational metallurgical facilities are used, including a central elution and smelting facility. In 2001 and ACC Pump Cell CIP circuit was installed to replace the less efficient drum filtration and zinc precipitation. Additionally, the upgrade included the installation of continuous electrowinning sludge reactors.
South Deep Gold Mine [34] incorporates two shaft systems that mine various auriferous conglomerates from open ground and pillars. The ore is processed at a central metallurgical plant. The mineral processing includes a milling circuit SAG, a CIP circuit, an elution system to finally recover gold by electrowinning and smelting processes.
Great Noligwa underground gold mine [23] is situated close to the Vaal River. It comprises four gold plants, one uranium plant and a sulphuric acid plant. Great Noligwa has its own milling and treatment plant which applies conventional crushing, screening, grinding and CIL processes to threat the ore and extract the gold.
Harmony Group in South Africa include the following mines: Bambanani, Doornkop, Kusasalethu, Evander, Joel, Kalgold, Masimong, Phakisa, Phoenix, Target, Tshepong and Virginia [43]. Sometimes the value of ore milled is too large compared with the values of other mines in the same ore grade scope. Therefore, it is probably that these data are referred to several mines. West Wits Operations include Driefontein, Kloof and South Deep Gold Mines [34].
Harmony Group reports the highest energy consumption value, leading to a negative progress ratio. For ore grades from 6 to 7 g/t Au, the only existing mine is Kloof, which shows an increase in the energy consumption for the same ore grade value from 2004 to 2008, therefore a negative progress ratio is shown. Data in the span between 8 and 9 g/t Au is from West Wits Field, eventhoug ore grade decreased, energy consumption decreased too, leading to a null positive progress ratio. Available data: from 2003 through 2008.
2.16 Tanzania
North Mara gold mine consists of three open pit deposits and belongs to Placer Dome Company. AngloGold Ashanti Ltd owns Geita gold mine, which began production in 2000. Geita [27] is a multiple open-pit operation with underground potential. For ore grades between 3 and 5 g/t Au, most of the data isfrom North Mara, during 2003 and 2004 the ore grade is the same but the energy consumption differs greatly, almost by a 50%. The same situation is repeated for years 2005 and 2007 and despite of these observations, there is a declining trend in energy consumption, resulting in a positive progress ratio of 12%.
Tulawaka Gold mine [33] consists of a completed open pit mine with an underground access ramp, an ore stockpile area and crushing plant and processing plant. The ore processing method includes SAG, gravity recovery and CIL. It is the only mine which report data in the span of 9 and 14 g/t Au. Within this large ore grade range the energy consumption falls as cumulative production increase, leading to a positive progress ratio of 11%.
Bulyanhulu Mine [44] is owned by Barrick Gold Corp. Bulyanhulu is an underground trackless operation using long hole and drift and fill as its principal toping methods. It shows a clear downtrend in ore grade that results in an energy consumption increase as cumulative production rises. However, due to the fact that ore grade vary from one year to another without a clear trend of increase or decrease and this variation is not significant, the progress ratio is positive.
Available data: from 2001 through 2007.
2.17 United States
Barrick Company [15] in USA owns several mines. Bald Mountain mine is an open pit, run-of mine with conventional heap leaching technology and carbon absorption for ore treatment.
Cortez mine is mined by conventional open-pit methods. It employs three different metallurgical processes to recover gold. Lower-grade oxide ore is heap leached, while higher grade ore is treated in a conventional mill using cyanidation and a CIL process. Heap leached ore is hauled directly to leach pads for gold recovery.
Golden Sunlight mine is mined by conventional open-pit methods. The ore treatment plant uses conventional CIP technology as well as San Tailing Retreatment (SRT). Goldstrike complex includes an open pit mine and two underground mines. The open pit is a truck and shovel operation using large electric shovels. While one of the underground mines is a high grade ore body which is mined by transverse longhole stoping, underhand drift and fill mining methods, the other is a trackless operation, using two different underground mining methods: long-hole open stoping and drift and fill. The mine consists of two processing facilities that are used for both the surface and underground operations: (i) an autoclave circuit and (ii) the roaster.
Marigold mine is an open-pit operation that uses heap-leaching to process its ore.
Round Mountain mine is a conventional open-pit operation that uses multiple processing methods including crushed ore leaching, run of mine ore leaching, milling of higher ore grade and the gravity concentration circuit.
Turquoise Ridge mine uses underhand cut and fill mining methods. The ore is transported to an external mill for processing. The refractory gold ore is treated by pressure oxidation technology and gold is recovered using conventional CIL technology.
Cripple Creek Victor JV gold mine [23] is a low-grade, open pit operation. The ore is treated using a valley-type, heap leach process with activated carbon used to recover the gold. The resulting doré buttons are shipped to a refinery for final processing.
Fort Knox mine [30] is an open pit mine, that uses as processing methods CIP mill, heap leach and gravity. Production from heap leach began in late 2009. Ridgeway underground mine [23] produces gold and copper. It is in the process of transitioning from the sub-level cave to a block cave beneath the existing mine. Crushed ore from the underground is delivered by conveyor to a surface stockpile. Gold andcopper are then recovered in a conventional floatation circuit to produce a copper concentrate containing elevated gold levels. The next step is to pump to the filtration plant where it is dewatered prior to being exported to smelters throughout East Asia.
Wharf [32] is an open pit and heap leach mine that has been in operation since 1983.
Barneys Canyon gold mine [33] is an open pit mine that started production in 1989. Mining and milling ended in 2001. Gold production from stockpiles continued until 2005.
Kettle River-Buckhorn gold mine [30], was originally conceived as an open pit mine, but it was redesigned and developed as an underground mine. The primary mining method employed is cut and fill. Its ore is processed through milling, flotation and CIP processes.
Pogo gold mine [33] is an underground mine that utilizes a cut and fill drift method. The milling operation includes grinding, sulfide flotation, paste thickening, leach/CIP, cyanide detoxification, tailings filtration and gravity recovery.
Open pit mining in USA is characterized by negative progress ratios, but underground mining using CIL and CIP shows positive progress ratios. Available data: from 2002 through 2007.
3 Summary of the results
Assuming that all mines of the same kind of operation as well as recovery process for a specific country are comparable, progress ratios can be presented as figure 2 displays.
For instance, Australia has an excellent progress ratio when CIP technology is used either in open pit or underground mines. This can imply that gold mining industry in Australia has overcome the declining in ore grades through technological learning. A compilation of the best practices and all mining process in general would be very useful for mines using the same recovery process around the world. The sharing of operational and technical experiences, with countries such as Papua New Guinea would be an excellent way to improve the efficiency in the gold mining sector.
For the United States, positive progress ratios can be observed when underground mining is performed (either when CIP or CIL process are applied). Hence, the relevant fact here is the kind of mining operation used: underground. Performance benchmarking of gold mines in Canada can be a worthwhile action to improve practices in the gold mining industry.
In South America, countries like Argentina and Brazil show great positive progress ratio when operations in open pit mines with heap in leach technology as recovery process is employed. Again, it would be very useful an extended compilation of their best practices in order to share this information with countries that have mines with the same geological and technological characteristics, such as those in Peru.
4 Conclusions
This paper has studied the influence of technical development and declining ore grades on the availability of world gold resources, applying the learning curves approach and estimating progress ratios for each country. The latter allowed us to identify mines in which mining operations have proved to be successful when the goal is to save energy. Therefore these estimates can be used to point out best mining practices and serve as a reference for other mines with similar conditions.
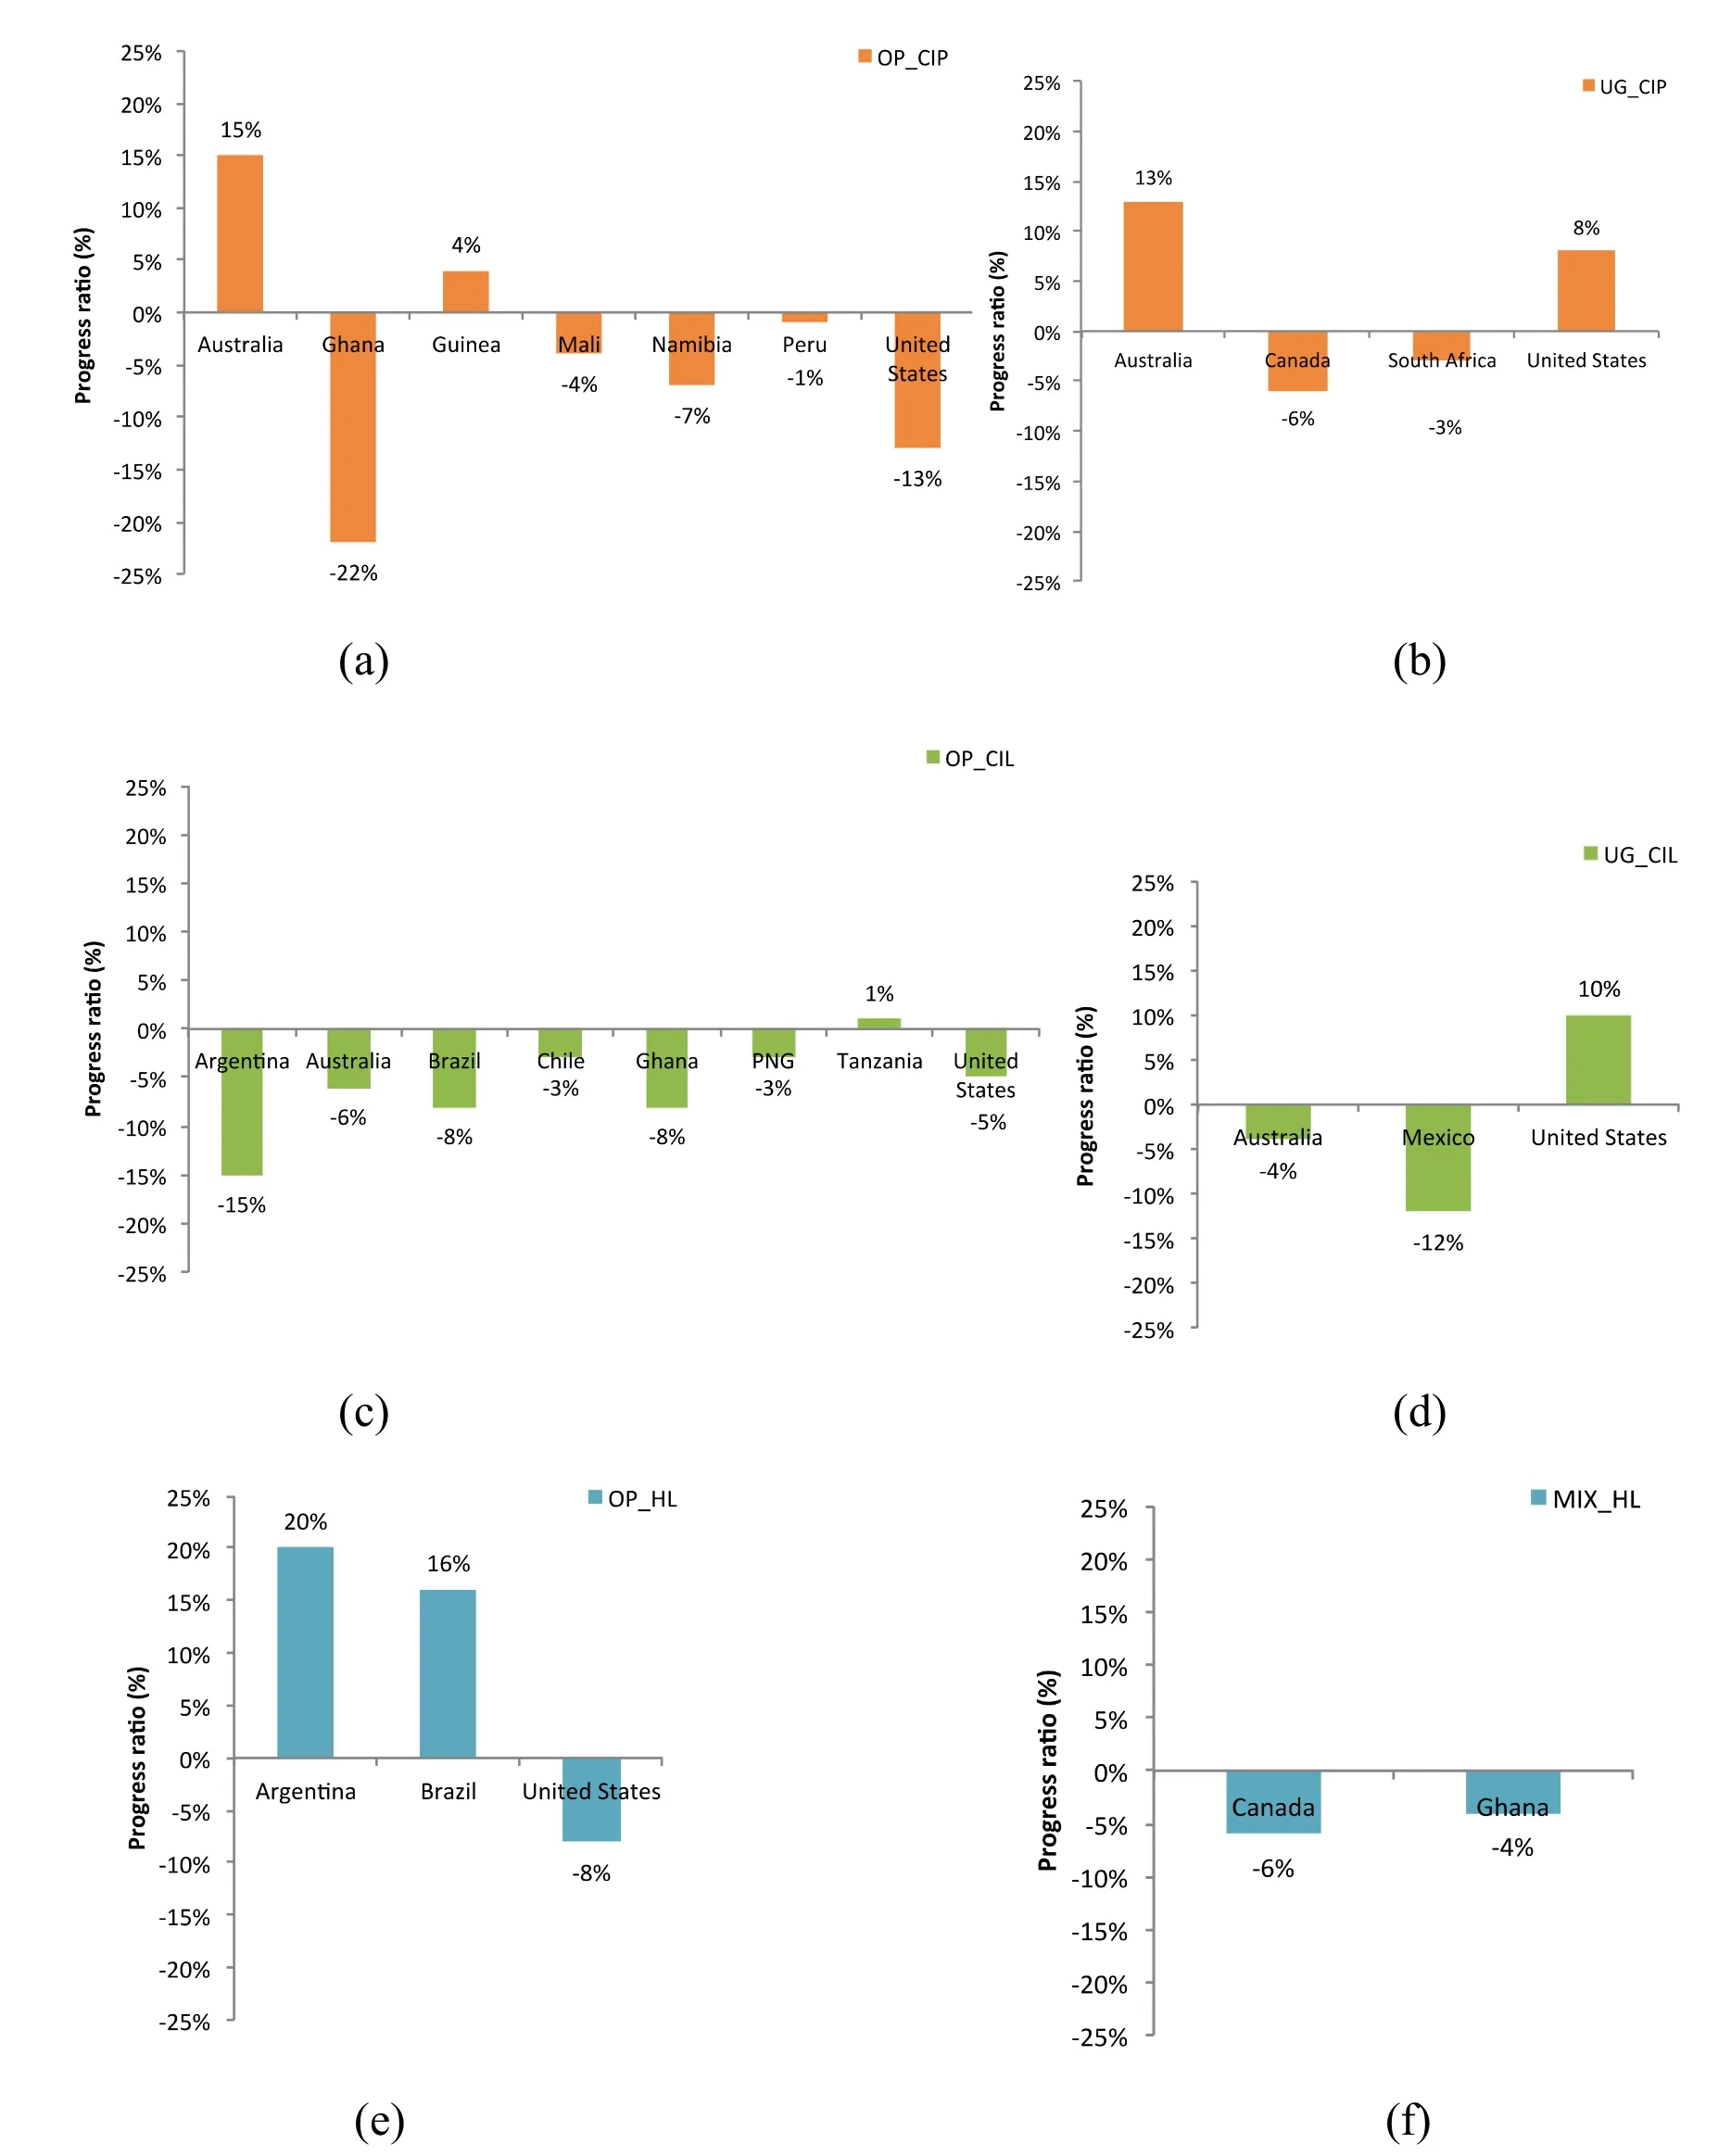
Fig. 2 Progress ratio for different recovery process and countries in gold mining industry.
Average progress ratios obtained between different operation and recovery processes ranged from + 20% to – 22%. The learning effect is measured in terms of reduction in the energy requirements of mining operations.
It should be pointed out, that the improvement in mining technologies, represented in this paper by the progress ratios calculated for different countries, mines operations and recovery processes are not related to time or cumulative production as it happens to conventional applications (such as manufacturing) when the theory of learning curves is applied. In the mining sector, an additional factor needs to be taken into account, and that is the key variable ore grade change. This way, an improvement in the energy efficiency of the processes does not necessarily imply an overall energy reduction, since the decrease in the ore grade may dominate.
General results suggest that although progress in technology has been made, in most cases energy requirements are increasing, because the main variable is the ore grade. Therefore, it can be asserted that technology cannot in general avert the rising energy demand for gold mining in the future if no major changes are performed in gold mines around the world.
It is crucial to analyze carefully those countries that are and will be the major gold producers such as Australia, South Africa, Russia, Chile, United States and Indonesia. The data analyzed reveals that South Africa and Australia show the greatest energy consumptions and hence should increase their efforts in improving their mining practices. Additionally, due to the strategic position of China in the gold mining industry, analyzing its data sets in energy consumptions and ore grades would be also very interesting and profitable.
This survey has been carried out for gold, but future studies will be accomplished to other important commodities. This will allow us to have a broader understanding of the mining sector and the outcomes of technology evolution together with ore grade declining.
Acknowledgements
This paper has been financed by the IDERE II project from the Spanish Ministry of Industry and Science. We thank Dr. Gavin Mudd for sharing with us his comprehensive and useful data set of global gold mining.
Nomenclature
bConstant reflecting the rate energy decrease from year to year (learning index)
cElasticity of learning by researching
KSKnowledge stock
RGas constant (8.3145 J/molK)
SEnergy slope expressed as a decimal value (learning rate)
T0Reference Temperature (298.15 K)
xSequential number of the unit for which the energy is to be computed
XcOre grade
xiMolar concentration of substance i
Y0Theoretical energy of the first production unit
YxEnergy required to produce the xth unit
Abbreviations
CIP Circuit in Pulp
CIL Circuit in Leach
HL Heap Leach
MIX Mixed (open pit and underground)
OP Open Pit
PR Progress ratio
UG Underground
UGt Underground tailings
[1] Placer Dome Asia Pacific (1998),Porgera Mine Sustainable Report, PDAP, Milton.
[2] Mudd, G. (2007), Global Trends in Gold Mining: Towards Quantifying Environmental and Resource Sustainability?,Resources Policy, 32, 42-56.
[3] Mudd, G. (2007), Gold Mining in Australia: Linking Historical Trends and Environmental and Resource Sustainability,Environmental science & policy, 10, 629-644.
[4] U.S. Geological Survey. USGS (2011), Mineral Commodities Summaries, U.S. Department of the Interior. Available at: <http://minerals.usgs.gov/minerals/pubs/mcs/2011/mcs2011.pdf > [accessed 18.1.2012].
[5] Ruth, M. (1993),Integrating Economics, Ecology and Thermodynamics, Kluwer Academic Publishers: The Netherlands.
[6] Soderholm, P. and Sundqvist, T. (2007), Empirical challenges in the use of learning curves for assessing the economic prospects of renewable energy technologies,Renewable Energy, 32, 2559-2578.
[7] Giurco, D., Prior, T., Mudd, G., Mason, L. and Behrisch J. (2010),Peak Minerals in Australia: A Review of Changing Impacts and Benefits, Technical Report, Institute for Sustainable Futures, University of Technology, Sydney and Department of Civil Engineering, Monash University, Australia.
[8] U.S. Geological Survey. USGS. (2011),Minerals Yearbook Gold, Technical Report.
[9] Yelle, L. (1979),The Learning Curve: Historical Review and Comprehensive Survey, University of Lowell, 10, 302-328.
[10] Ruth, M. (1995), Thermodynamic constraints on optimal depletion of copper and aluminum in the United States: A dynamic model of substitution and technical change,Ecological Economics, 15, 197-213.
[11] Kahouli-Brahmi, S. (2008), Technological learning in energy environmental economy modelling: A survey,Energy Policy, 36, 138-162.
[12] Weiss, M., Junginger, M., Patel, M. and Blok, K. (2010), A review of experience curve analyses for energy demand technologies,Technological Forecasting & Social Change, 77, 411-428.
[13] Jamasb, T. and Kohler, J. (2007),Learning Curves for Energy Technology and Policy Analysis: A Critical Assessment, University of Cambridge, UK.
[14] McDonald, A. and Schrattenholzer, L. (2001), Learning rates for energy technologies, Energy Policy, 29, 255-261.
[15] De Andrade, L. (2007), Dynamic simulation of the carbon-in-pulp and carbon-in-leach processes,Brazilian Journal of Chemical Engineering, 24(04), 623-635.
[16] Barrick Company. (2012), Available at: < http://www.barrick.com/GlobalOperations > [accessed 18.1.2012].
[17] Valero, Al., Valero, A. and Domínguez, A. (2011), Influence of technical development and declining ore grades on the availability of gold resources, SDEWES 2011, In:Proceedings of the 6th Dubrovnik Conference on Sustainable Development of Energy, Water and Environment Systems, Sept 25-29, Dubrovnik, Croatia.
[18] Mulligan, D. (1996),Environmental Management in the Australian Minerals and Energy Industries. Principles and Practices, Australia,Australia: University of New South Wales Press.
[19] Unity Mining Limited (2012), Available at: < http://www.unitymining.com.au/ > [accessed 7.5.2012].
[20] The Superpit (2012). Available at: < http://www.superpit.com.au/Production/MineralProcessing > [accessed 7.5.2012].
[21] Gold Fields (2011), Agnew Gold Mine Technical Short Form Report, Available at:< http://www.goldfields.co.za/pdfs/technical_short_forms_2011/agnew_mine.pdf > [accessed 7.5.2012].
[22] Gold Fields (2011), St Ives Gold Mine Technical Short Form Report, Available at:< http://www.goldfields.co.za/pdfs/technical_short_forms_2011/st_ives_mine.pdf > [accessed 7.5.2012].
[23] Mining Technology (2012), Available at: < http://www.mining-technology.com/projects/ > [accessed 18.1.2012].
[24] Normandy Mining Limited (1998), Environment Report, Mt Leyshon Operations, Available at:< http://www.corporateregister.com/a10723/nml-ml98-se-az.pdf > [accessed 18.1.2012].
[25] Normandy Mining Limited (1998) Environment Report, Tanami Operations, Available at:< http://www.corporateregister.com/a10723/nml-tan98-se-az.pdf > [accessed 18.1.2012].
[26] Evolution Mining (2012), Available at: < http://www.evolutionmining.com.au/ > [accessed 18.1.2012].
[27] AngloGold Ashanti (2012), Available at: < http://www.anglogold.co.za/Home > [accessed 18.1.2012].
[28] Minesite (2012), Available at: < http://minesite.com/ > [accessed 18.1.2012].
[29] Lloyd, P., Berthelsen, R. and Strom, E. (2009), Australia: New South Wales, Technical Report on Peak Gold Mines.
[30] Kinross (2012), Available at: < http://www.kinross.com/ > [accessed 18.1.2012].
[31] Newgold (2012), Available at: < http://newgold.com/ > [accessed 18.1.2012].
[32] Goldcorp (2012), Available at: < http://www.goldcorp.com > [accessed 18.1.2012].
[33] Global Infomine (2012), Available at: < http://www.infomine.com/minesite/ > [accessed 18.1.2012].
[34] Gold Fields (2012), Available at: < http://www.goldfields.co.za/ > [accessed 18.1.2012].
[35] McGuire, G. (2003),Managing Mine Closure Risks in Developing Communities - A Case Study, Kelian Equatorial Mining, Indonesia, Mining Risk Management Conference, Sept 9-12, Sydney, NSW.
[36] Minmetals Resources Limited (2012), Available at: < http://www.mmg.com/pages/828.aspx > [accessed 18.1.2012].
[37] IamGold Corporation (2012), Available at: < http://www.iamgold.com/English/Operations/default.aspx > [accessed 18.1.2012].
[38] RandGold Resources (2012), Available at: < http://www.randgoldresources.com/randgold/content/en/2009/randgold-home> [accessed 18.1.2012].
[39] Primero Mining (2012), Available at: < http://www.primeromining.com/Operations/San-Dimas-Mine/default.aspx > [accessed 18.1.2012].
[40] AditNow (2012), Available at: < http://www.aditnow.co.uk/ > [accessed 18.1.2012].
[41] Barrick Company (2012), Available at:< http://www.barrick.com/Theme/Barrick/files/docs_presentations/pr11_12_2003_weauau.pdf > [accessed 7.5.2012].
[42] Ausenco (2012), Available at: < http://www.ausenco.com/page/Our_Projects/Pierina_Gold_Mine/ >[accessed 18.1.2012].
[43] Harmony (2012), Available at: < http://www.harmony.co.za/ > [accessed 18.1.2012].
[44] Gold mining in Tanzania (2012), Available at: < http://www.tanzaniagold.com/ > [accessed 18.1.2012].
26 January 2013
†Corresponding author.
Email address: adrianad@unizar.es
ISSN 2325-6192, eISSN 2325-6206/$- see front materials © 2013 L&H Scientific Publishing, LLC. All rights reserved.
10.5890/JEAM.2013.01.007
Accepted 25 February 2013
Available online 2 April 2013
杂志排行

Journal of Environmental Accounting and Management的其它文章
- Carbon Footprint and Life Cycle Assessment of Organizations
- Environmental Performance and Biophysical Constrains of Italian Agriculture Across Time and Space Scales
- Analysis of the Scientific Collaboration Patterns in the Emergy Accounting Field: A Review of the Co-authorship Network Structure
- Keeping the Books for the Environment and Society: The Unification of Emergy and Financial Accounting Methods
- Multi-scale Input-output Analysis for Multiple Responsibility Entities: Carbon Emission by Urban Economy in Beijing 2007
- Sustainability Ethics and Metrics: Strategies for Damage Control and Prevention