Environmental Performance and Biophysical Constrains of Italian Agriculture Across Time and Space Scales
2013-06-15AmaliaZucaroSalvatoreMellinoPatriziaGhiselliniSilvioViglia
Amalia Zucaro, Salvatore Mellino, Patrizia Ghisellini, Silvio Viglia
1Department of Sciences for the Environment, Parthenope University of Naples, Centro Direzionale - Isola C4, 80143, Napoli, Italy
2Alma Mater Studiorum – University of Bologna, Department of Agricultural and Food Sciences, Viale G. Fanin, 50 (40127), Bologna, Italy
Environmental Performance and Biophysical Constrains of Italian Agriculture Across Time and Space Scales
Amalia Zucaro1†, Salvatore Mellino1, Patrizia Ghisellini2, Silvio Viglia1
1Department of Sciences for the Environment, Parthenope University of Naples, Centro Direzionale - Isola C4, 80143, Napoli, Italy
2Alma Mater Studiorum – University of Bologna, Department of Agricultural and Food Sciences, Viale G. Fanin, 50 (40127), Bologna, Italy
Submission Info
Communicated by Zhifeng Yang
Environmental performance
Emergy
Agricultural trends
Scenario Analysis
This paper evaluates the resource use and environmental performance of the Italian agricultural sector across levels, from local (selected olive, lemon and grape farms), through regional (Campania region) up to the national scale (whole Italy). An assessment over time (from 1985 to 2010) was performed in order to investigate how the demand for environmental support changed in the last twenty-five years. The performance indicators were calculated by using the Emergy Synthesis method in order to ascertain the emergy investment per unit of product (dry-mass, available energy, monetary value) as well as the overall sustainability of the process. Results point out both a decrease of renewability (%REN) and a higher dependence from imported resources (high Environmental Loading Ratio, ELR and low Emergy Yield Ratio, EYR) at all the scales investigated. The main factors affecting such indicators are the choice of crops mix, machinery use, climate conditions (mainly rainfall), market value of products, direct and indirect labor. A scenario analysis was implemented based on increased resource use efficiency in order to assess the sustainability improvement potential of the agricultural system.
© 2013 L&H Scientific Publishing, LLC. All rights reserved.
1 Introduction
The establishment of new patterns of socio-economic development is becoming, in recent years, a priority also in government policies at all scales. The main objective is to safeguard the productive sectors as well as to respect the environment and natural heritage, perceived as a real asset to be preserved also forthe benefit of future generations [1]. Agriculture is one of the sectors that require more attention, considering its fundamental task of meeting the nutrition needs of 7 billion humans on Earth. Moreover, the agricultural sector has a multifunctional role, also as a source of animal feed, fibers, construction materials and fuel, in addition to playing a key role in ensuring landscape control and rural jobs. Industrialized agricultural systems, such as Italy and most European countries, try to remain highly productive and competitive over time by increasing inputs of fertilizers, pesticides and irrigation [2,3]. It is day-by-day more evident that intensive agriculture has negative side effects on soil fertility, groundwater quality, biodiversity and food quality. Most often, the increase of agricultural production gives rise to loss of soil fertility and unsustainable production and consumption patterns. As a consequence, the environmental performance of an agricultural system cannot only be assessed based on direct energy consumption (machinery, fuels and electricity) and the amount of product delivered. Focus is also required on other kinds of resources involved, such as topsoil and ground water, as well as indirect resource use for goods, machinery and labor invested. This can be accomplished by means of a comprehensive accounting tool, the emergy synthesis method, capable to include in the assessment non-monetary and indirect resource flows [4-6]. The emergy evaluation is applied in this study to understand what main environmental driving forces are and what the interplay of environment and economy is in agricultural systems. The study also points out the dynamics and performance of the Italian agricultural sector across time and spatial scales and the importance of labor (activity directly applied to a process) and services (activities indirectly applied to a process from the larger scale of the economy) that contribute vital knowledge and information to the production process [7].
2 Materials and methods
2.1 The system(s)
The assessment of the resource use and environmental performance of the Italian agricultural system is evaluated in this paper at three different levels (Figure 1):
· the Italian agricultural sector as a whole, hereafter referred to aslevel n+1;
· the Campania region (southern Italy), hereafter referred to aslevel n;
· selected individual farms in the Campania region, hereafter referred to aslevel n-1.
For levelsnandn+1 the evaluation is performed over time, i.e. monitoring the performance over selected years, based on official agricultural and economic statistics [8-12]. For leveln-1 such a monitoring was not possible, because statistical offices do not provide annual records of environmental and energy data at the individual farm level.
Collected data refer to the total product of national, regional and local agriculture, quantified as dry mass, energy content and economic value as well as to the main input flows (renewables, fertilizers, machinery, fuels, water for irrigation, electricity, direct labor, indirect labor) supporting the agricultural systems in the investigated years.
2.1.1 The national agricultural system(level n+1)
Italian agriculture is highly developed, thanks to the high soil fertility, proper climate conditions and abundance of water, thus enabling a mixed variety of high-quality fruit and vegetable products. The northern part of Italy produces primarily grains, sugar beets, soybeans, meat, and dairy products, while the southern part specializes in fruits, vegetables, olive oil, wine, and durum wheat.
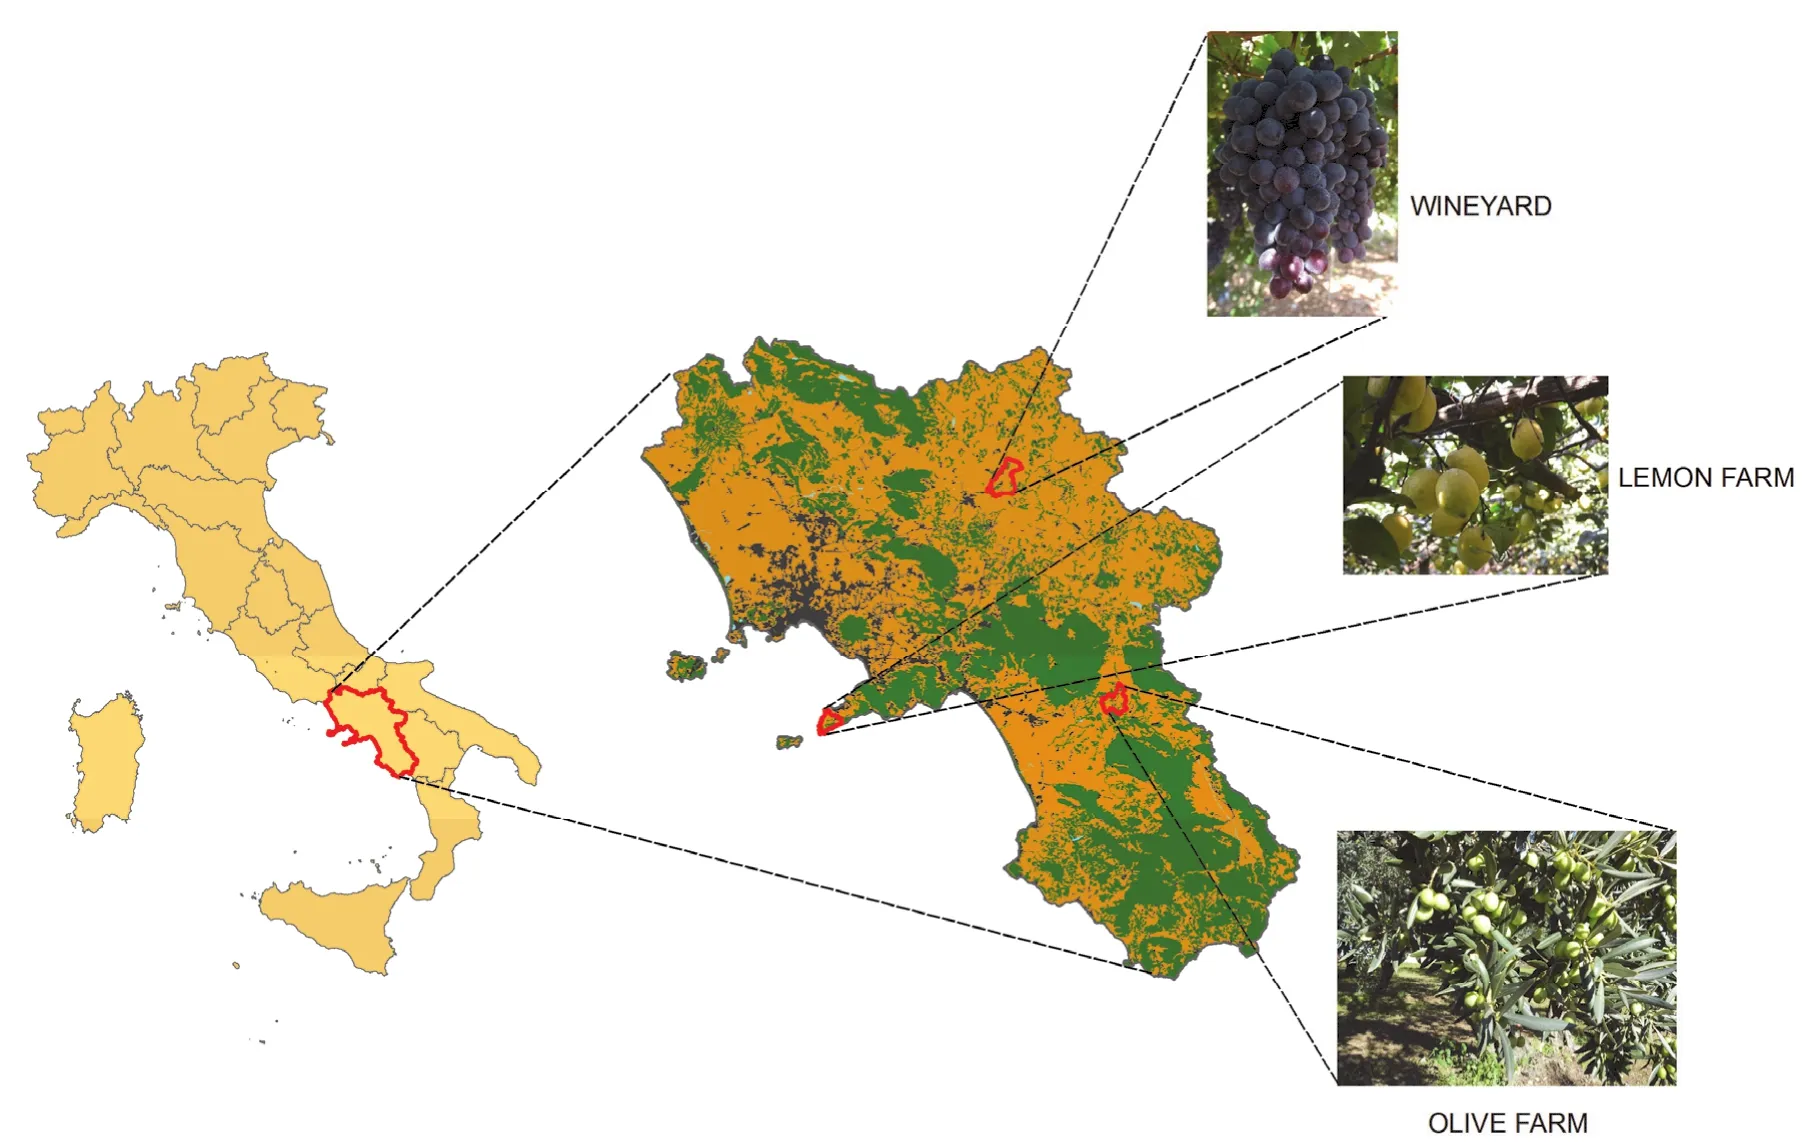
Fig. 1 The investigated agricultural system, at three different scales: national (Italy), regional (Campania) and farm level (grape, olive and lemon farms).
About 50% of the total agricultural area in Italy is covered by forage crops, out of which 30% permanent and 15% temporary, for livestock feed. The remaining land is covered by cereals (30%) and arboricultural crops (20%), among which the most important are olive (8%) and grape (6%) farms. Some farms also generate other typologies of product (e.g.: agro-tourism activities, biomass energy); however, these were not included in the assessment and therefore, the additional inputs of labor and resources for these activities were also not included. Ulgiatiet al.[13] investigated the livestock sector, pointing out that it used about 37% of total emergy input to the agricultural sector, leaving the 63% to more conventional crops.
The average farmland size is about seven hectares [11], and most farms are still run as family enterprises. Agricultural work-force in Italy is relatively large (about 1 million employed in farming, accounting for approximately 4% of total national work-force, in the year 2006) [11].
The profile of Italian agriculture (productivity, energy intensity, machinery use, etc.) is in line with most Western European countries, because of the effects of the Common Agricultural Policy (CAP) of the European Union (EU). The CAP was not very successful in Italy in its initial stages because subsidies did not cover several traditional Mediterranean products such as olives, tomatoes, oranges, and lemons. When these crops were finally included, some positive aspects of the supporting policy emerged, together with conflicting interests deriving from market expansion and aggressive competition. Firstly, CAP provided the necessary capital for improvement of agricultural mechanization; second, it offered an incentive to merge too small farms and thus enlarge the average farm size. Finally, it ensured that most traditional Italian agricultural products were relatively protected in the economic global competition. Italy, also due to its climate and soil conditions, is a world leader in olive oil production and a major exporter of rice, tomatoes, and wine. The worldwide recognized quality of Italian food products, acknowledged and rela-tively protected by European regulations, is still an important driver of market leadership (for example, many Southern Italy wines expanded their markets thanks to improved production infrastructures and are now appreciated in Italy and abroad).
Although in the last twenty-five years the agricultural sector in Italy has been characterized by an increase of agricultural GPV (Gross Production Value; about 28% increase over the investigated period) and energy consumption (about 37% increase), yet at national level agriculture still plays a less important role compared to other economic sectors, contributing to only 6% of the national GDP [11].
2.1.2 Campania region agriculture (level n)
Campania is one of the most populous regions of Italy, well known worldwide for the ancient and rich history of its cities and the beauty of its landscape1http://ac-support.europe.umuc.edu/~jmatthew/naples/index.html. It covers an area of 13,595 square kilometers and it is among the widest regions of Italy. The region is divided into five provinces: Napoli, Avellino, Benevento, Caserta and Salerno.
The most suitable land for agriculture is located near the coast (Tyrrhenian sea). These areas present favorable agricultural conditions and water availability, good rainfall rates and temperate climate (temperature from 0° to 30°C). The soils are volcanic and highly fertile. Due to fertile soil, water availability and favorable climate, Campania ranks among the Italian regions characterized by highest agricultural productivity and quality. Our case study includes all the land cropped in Campania region (9.49 E+05 ha in 1985 and a lower 6.51 E+05 ha in 2010, including land used for animal fodder) with important land use oscillations in the 25 years investigated, mainly due to the urbanization process and the abandonment of rural areas.
The agricultural land of Campania region was 4.4% of total arable land of Italy (1.37E+07 ha) in the year 2006, used in this paper as the reference year for comparison across spatial scales. Productivity in terms of dry matter (g d.m./ha/year) was 20% higher in the regional agriculture than in Italian one, which translates into a 17% higher energy content of crop production as a whole (J/ha/year) of the delivered product and a gross production value that is about twice the average value per hectare in Italy [8-12]. This can be attributed to the favorable conditions previously referred to (volcanic soil, warm climate, abundant rainfall) and to a crop mix characterized by high market value (wine, oil, lemon, among others).
Forage production accounted for about 35% of the total land cropped in 1985, 44% in 2002 and seems to have stabilized around 43% in 2006 and later. Cereals (mainly wheat and corn) accounted for an average, slightly declining fraction of 22% of total cropped land. Olive production was about 9% of total agricultural land in 1985 with an increasing trend up to 11.6%. All kinds of fruit, citrus and nut trees globally accounted for about 12.2% in 1985, slowly declining to 11% in the following years. Other nonnegligible sub-sectors are grape production (averaging 5% in the investigated period), tobacco (from 3.5% in 1985 to 1.6%), potatoes (from 3% in 1985 to 1.7%) and tomatoes (from 3% in 1985 to 0.9%). Forage provides support to the livestock sector, which is an important economic activity at the regional level. However, the livestock sector also imports feedstock from outside the region.
2.1.3 Agricultural production in selected local farms (level n-1)
The Campania region is known for high quality production of grapes, olives and lemon. These crops are important from two different points of view: economic production value (“limoncello” from lemon farm, olive oil from olive farm and wine from wineyard) and amount of land used. In fact the land cropped dedicated for these crops is, more or less, 20% of the total cropped area in Campania region.
Furthermore, many quality labels are assigned to these products or their derivatives. Special quality labels (PGI, Protected Geographical Indication) are assigned by the European Union to the Sorrento“limoncello”, a traditional liquor exported worldwide. The DCO (Denomination of Controlled Origin) and CGDO (Controlled and Guaranteed Denomination of Origin) are assigned to many Campania wines (Aglianico, Sangiovese, Piedirosso, Falanghina among others). Olive oil production is identified by the PDO (Protected Designation of Origin) with special focus on the production occurring in the Sorrento Peninsula and the Salerno Province. The investigated lemon, olive and grape farms are located respectively in the municipality of Massa Lubrense (Sorrento peninsula, province of Napoli), in the municipality of Contursi Terme (province of Salerno) and the last one in the province of Benevento.
2.2 The Emergy Method
In order to assess the sustainable use of natural capital (storage of materials and energy) and ecosystem services (flows of environmental resources from the environmental systems to human society) within the Italian agricultural sector, the Emergy Synthesis method [4,14-16] was applied at local, regional and national scales. Such an approach, a biophysical and environmental accounting tool based on concepts of energy quality, focuses on the study of natural and human-dominated ecosystems from a “donor-side”(supply-side) point of view [5,6], where the value of a resource is placed on what it takes (time, space, driving forces) to generate it within the biosphere dynamics.
According to the emergy theory different forms of energy, materials, human labor and economic services are all evaluated on the common basis of biosphere by converting them into equivalents of only one form of energy, the solar kind, expressed as solar equivalent Joule (seJ) [7]. All inputs are accounted for in terms of their solar Emergy defined as “the total amount of available energy(exergy)of one kind(most often of the solar kind)that is used up directly or indirectly in a process to deliver an output product, flow, or service’’ [4]. The amount of emergy that was originally required to provide one unit of each input is referred to as its specific emergy (seJ/g) or transformity (seJ/J), and can be considered a “quality”factor which functions as a measure of the intensity of the support provided by the biosphere to the input under study [17]. Emergy synthesis is organized as a top-down approach where first a system diagram of the process is drawn in order to account for all input and output flows. After all flows of materials, energy, labor and services are quantified. The final step of the emergy evaluation is the calculation and the interpretation of emergy extensive (like Renewable resources R, Nonrenewable resources N, Total Emergy used U, etc.) and intensive (like the Emergy Yield Ratio EYR, Environmental Loading Ratio ELR, Emergy Sustainability Index ESI, the fraction of renewable emergy %REN, etc.) indicators.
According to the Emergy procedures an energy system diagram was drawn to model each investigated system (Figure 2a) using the symbols of the energy language of systems ecology (Figure 2b, [4,15]). The diagram describes a generic agricultural system as well as the entire sector. Based on the system diagram, tables of the input and output flows were constructed for the three investigated levels (national, regional and local). All data about local processes were collected on field by means of direct interviews based on farm accounting records, on a yearly basis, in order to account for the matter, energy and money flows supporting the systems. Data about regional and national sectors were extracted from economic and agricultural statistical handbooks. The total emergy with and without labor and services (L&S), as well as the transformity (seJ/J), the emergy intensities (seJ/g of dry matter of product, seJ/euro generated), the empower density (seJ/ha/yr) and performance indicators were calculated for all systems. A special focus was placed on the evaluation of Emergy Yield Ratio (EYR), Environmental Loading Ratio (ELR) and performance and cost indicators. Each of them provides information about specific aspects of the investigated processes. Since most of them are composite indicators, their values can be affected even by small changes occurring to the numerator or to the denominator of the calculation fraction or by changes to one of the components of the formula used, with likely non-linear results. The analyst should always keep into proper account not only the final value of the indicator, but also the individual trend of each compo-nent of the formula.
Results are organized in Tables and radar diagrams, where indicators are shown and compared. In order to compare data with different orders of magnitude in the same radar diagram, we applied normalization procedures in relation to different datasets (different years or different systems):
· Normalization with reference to the original dataset: all values are divided by the value of the original dataset (first year of investigation or reference scenario, Figures 3, 4, and 6).
· Normalization based on the standard score: each indicator calculated is subtracted by the arithmetic mean (µ) and divided by the standard deviation (σ) (Figure 5).
After the normalization procedure, the indicators can be displayed in a radar diagram, in such a way that a larger area in the diagrams suggests a higher relative impact. Data used in this study were provided by ISTAT (National Italian Statistical yearbooks for the years 1985, 1993, 2002, 2006, and 2010) as well as by local and regional agencies and statistical surveys as indicated by references [8-11].
3 Results
3.1 The “n+1” level (national agricultural sector)
The agricultural land in Italy decreased steadily (about 22%), from 1985 (1.70E+07 ha) to 2010 (1.33E+07 ha). The total mass of agricultural product (as dry matter) also decreased, by about 37%%, from 1.25E+08 tons/yr (1985) to 7.84+07 tons/yr (2010). The productivity per hectare of Italian agriculture slightly oscillates over time around a value of 7.00 ton/ha/yr. This productivity is mainly due to the implementation of intensive practices (mechanization, fertilization, etc.) in the Italian agriculture, thus compensating the decrease of agricultural land. An inventory of input flows in the year 2006, based on the diagram of Figure 2 is shown in Table 1. All flows are converted to emergy values, by means of suitable conversion factors (Unit Emergy Values, UEV) from literature or from our previous studies. After a similar calculation is performed over a selected set of years, a performance comparison can be carried out. The variation of the sector’s performance over time is clearly affected by a mix of factors: rainfall oscillations and related variation of irrigation practices, decreased amount of arable land actually cropped, variation of the mix of crops, change in technology (increased agricultural machinery), decrease of labor, increased use of fertilizers and other chemicals. A large fraction of emergy costs is due to the resource investment in support to labor and services, i.e. to the direct and indirect activities displayed over the entire supply chain and societal network of infrastructures in order to make the process possible. Of course, the higher the standard of living in a society, the higher the emergy of labor and services [7].
The radar diagram in Figure 3 provides a picture of increasing demand for environmental support over time and decreasing performance.
The most important changes over the investigated period at the national level (Table 2), can be identified as:
▪ Increased use of fuels (23% in emergy units, from 1985 to 2010) and electricity (75% from 1985 to 2010), and consequent increase of local non-renewable emergy use, N (by 61%);
▪ Small increase of renewable emergy use (4%);
▪ Decrease of EYR from 1.14 in the year 1985 to 1.10 in the year 2010; increase of the ELR from 8.40 to 13.11; decrease of the ESI from 0.14 to 0.08; increase of all the emergy intensities (emergy/GPV, emergy/land, emergy/mass, emergy/energy) in the same period;

Fig. 2 a) System diagram showing the environmental and economic input flows to and from a generic agricultural system. b) Energy systems symbols from [4].
▪ Increase of the emergy associated to labor and services by 91%, as a clear link to improved standard of living.
图4b为浮标站2016年各月小时极大风速≥5级的频次分布情况,冬春转换时节以及台汛期出现5级以上阵风概率会明显增加。日常预报工作中,当出现5级及以上阵风时,监测责任区就要进入关注状态。
The importance of labor and services as key factors of production processes is crucial and most often disregarded. For this reason, all the indicators are displayed in Table 2 also without L&S. The inclusion of L&S may hide the actual biophysical performance, namely the appropriateness of use of resources other than L&S (e.g., diesel, electricity, fertilizers). As a consequence it is always very useful to compare indicators with and without L&S, in order to point out performance differences and oscillations.
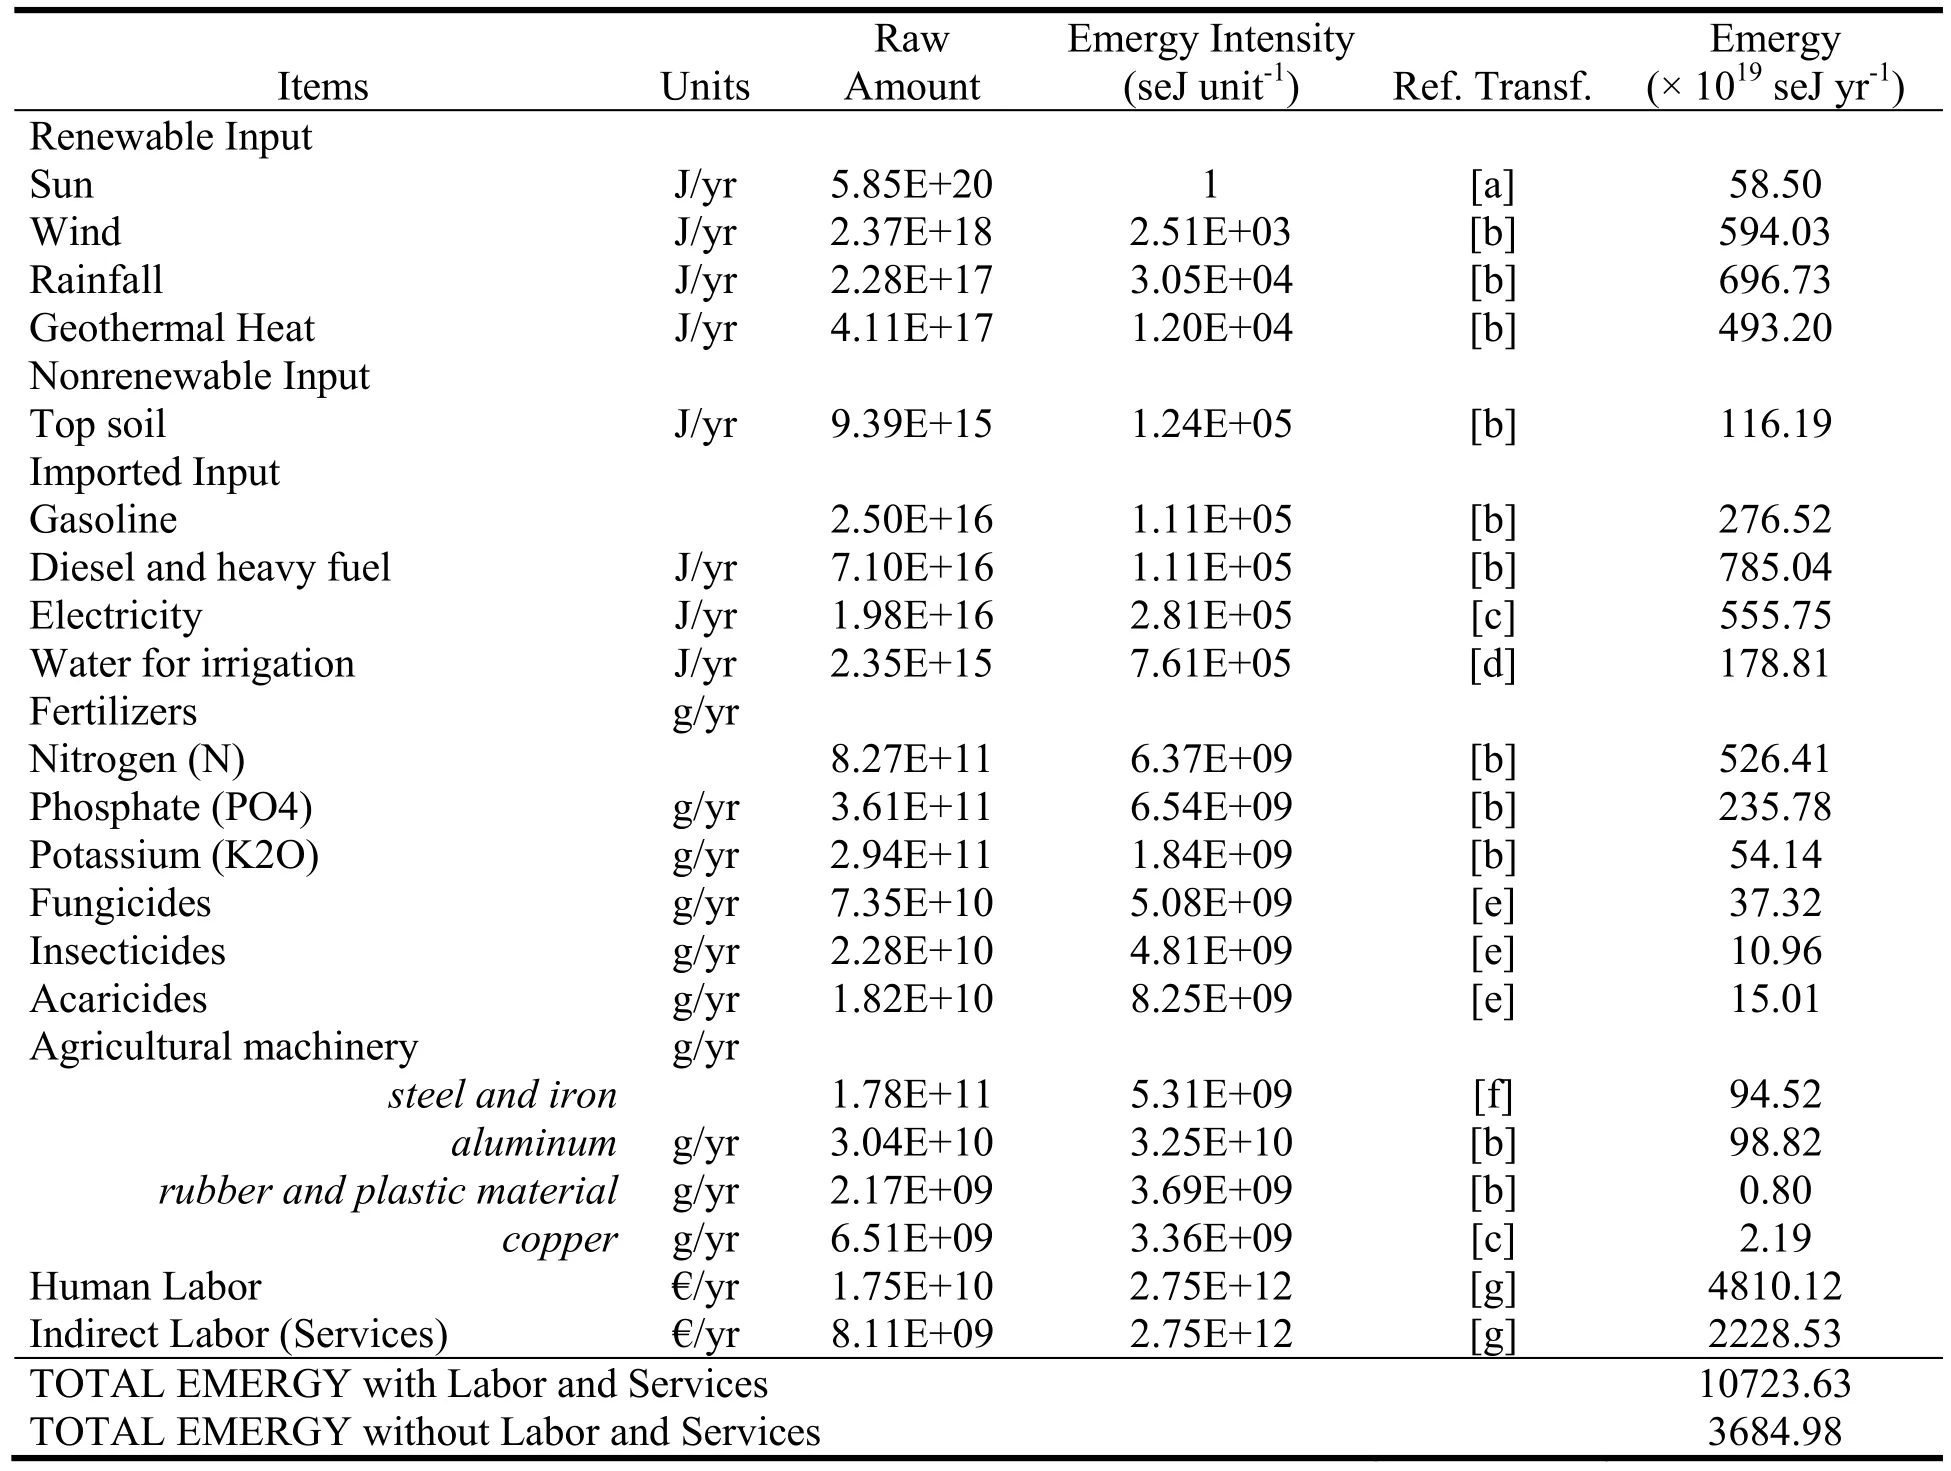
Table 1 Emergy Evaluation of Italian agriculture in 2006
3.2 The “n” level (regional agricultural sector)
The agricultural sector of the Campania region can be compared with the national agricultural sector in order to better understand how its performance is related to the local climatic factors (rain, solar irradiation, geothermal heat, soil quality), to the local mix of crops and agronomic practices, and finally how the emergy approach is capable to perceive and express the local variability of performance by means of its very diverse set of indicators.
Table 3 and Figure 4 show emergy indicators for the whole system of regional agriculture. In Table 3 the indicators are respectively calculated with and without accounting for the emergy that supports labor and services provided to the system. The performance values of the regional agriculture show a relative stability over the investigated period, with small oscillations. The agricultural sector had better indicators in the year 1985, with declining values up to the year 2006 and finally recent improvements back to the value of the 1985 again. The Emergy Yield Ratio declined from 1.16 to 1.10 in 2006, to rise again to 1.16 in 2010, The ELR increased from 7.37 in 1985 up to 11.68 in 2006, to decrease again to 7.39 in 2010.Similar behavior was shown by the Emergy Sustainability Index (ESI), with values from 0.16 (1985) to 0.09 in 2006 and then 0.16 again in 2010.
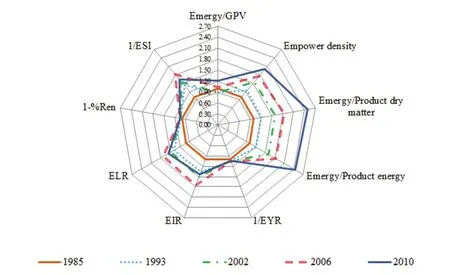
Fig. 3 Aggregated diagram of emergy-based environmental performance indicators of the national agricultural sector of Italy. Values in the diagram are normalised according to the first investigated year (chosen as reference). Real values and units are listed in Table 2.
3.3 The “n-1” level: selected local farms
The emergy indicators calculated for lemon, olive and grape farms, underline a higher global environmental impact of the lemon farm compared to the others.
Table 4 lists the main emergy indicators for one hectare of the investigated arboriculture calculated for the year 2006. All the indicators are calculated with and without labor and services in order to underline the importance of direct and indirect labor for the products of these particular crops. Moreover, the extensive emergy indicators of renewable input (R), nonrenewable (N), imported (F), direct labor (work force) and indirect labor (cost of all purchased input), are also presented in the Table.
4 Discussion
This study provides a complete and consistent picture of the driving forces supporting the agricultural sector in Italy, thus allowing a better understanding of its performance and main sources of emergy including areas of inefficiency. Italian agriculture is day-by-day more heavily dependent on fossil fuels and other nonrenewable input sources which affects its sustainability to a very large extent.
The comparison of national, regional and local levels does not only aim at suggesting specific variation of cropping practices, but also at testing the ability of the emergy method to properly account for even very specific aspects at local level. A proper set of emergy indicators may become a powerful tool to assess the performance of a production sector trough time and space, thus providing deep insight into the resource use dynamics at multiple scales. Moreover, the comparison of a large number of indicators and case studies also allows simulation of optimization strategies based on selective improvement of one or more input flows or processes.

Table 2 Trends of extensive and intensive emergy indicators of the agricultural system of Italy
4.1 Comparison across Levels: Country-Region-Farm
A comparison among the performances of the national, regional and local agricultural sectors is provided in Figure 5 and Table 4, for better understanding of the meaning of the calculated indicators. For the sake of clarity, we refer to a functional unit of one ha of cropped land in the year 2006. Of course, while at the national and regional level such a functional unit refers to an average mix of different crops, at the local level it refers to very specific crops and production practices.

Table 3 Trends of intensive and extensive emergy indicators of the agricultural system of Campania region
Areas in the diagram of Fig.5 suggest that the local farms investigated are impacting more than the average national and regional agricultural sectors, on one-hectare basis. This can be explained by the fact that the three investigated farms are very small and do not benefit from any scale factor. Moreover, they are arboricultural farms, requiring more support infrastructure (e.g. the lemon farms require a highly impacting woody structure named “pergolato”) and much more care than cereals and forage farms.

Fig. 4 Aggregated diagram of emergy-based environmental performance indicators of the agricultural sector of Campania region. Values in the diagram are normalised according to the first investigated year (chosen as reference). Real values and units are listed in Table 3.
Emergy results for arboricultural farms show a higher demand for environmental support, a higher ELR and a higher reliance on imported resources, than the average values for Italy and Campania region. In particular, if we look at raw values without accounting for labor and services, fertilizers and pesticides (respectively 29% and 23% of total emergy) appear to be very intensively used for olive farm; energy consumption (24%) and fertilization (28%) also affect the wineyard performance, while infrastructure is crucial for lemon farming (44%) due to the need for the “pergolato” shading structure. The latter is characterized by the use of a woody and galvanized steel support infrastructure, that is economically expensive and emergy intensive (although allocated to 30 life-time years and partially recycled).
While the comparison between regional and national level points out (Tables 2 and 3) that the Italian agriculture as a whole is more emergy intensive than Campania regional agriculture. The Environmental Loading Ratio (ELR) in the year 1985 was 7.37 for Campania agriculture, while it was 8.40 for the Italian agricultural sector. From 1985 to 2010 the regional ELR increased till the year 2006 and then decreased back to the 1985 value; instead, the ELR of Italian agriculture increased by 56% in the same years, from 8.40 (1985) to 13.11 (2010). The Emergy Yield Ratio (EYR) of Italian agriculture decreased from 1.14 (1985) to 1.10 (2010), while it decreased from 1.16 (1985) to 1.10 (2006) to increase again to 1.16 (2010) at the regional level. The two parameters combined together generated an Emergy Sustainability Index (ESI) that is higher for the Campania region (0.16 in 2010) than for Italy (0.08 in the same year).
At the farm level, results are of course affected by local specificity in resource use, management, environmental conditions and individual crops. The three case studies investigated in the year 2006 (lemon, olive and grape farms) show the same values of the EYR (1.02), while their ELRs were equal to 62.11, 56.02, and 50.69 respectively, all much higher than for the average agricultural national and regional sectors.
Intensity indicators are relatively independent on the physical size, and provide a measure of efficiency or performance of the agricultural production at different scale (e.g., more or less material or energy used per unit of product or per unit of time). The calculated values (emergy/GPV, emergy/land; emergy/product mass; emergy/product energy) suggest a higher efficiency for the two “average hectares” of regional and national scales compared to the local farms (Table 4), by also pointing out that the regional sector is more efficient than the national one.
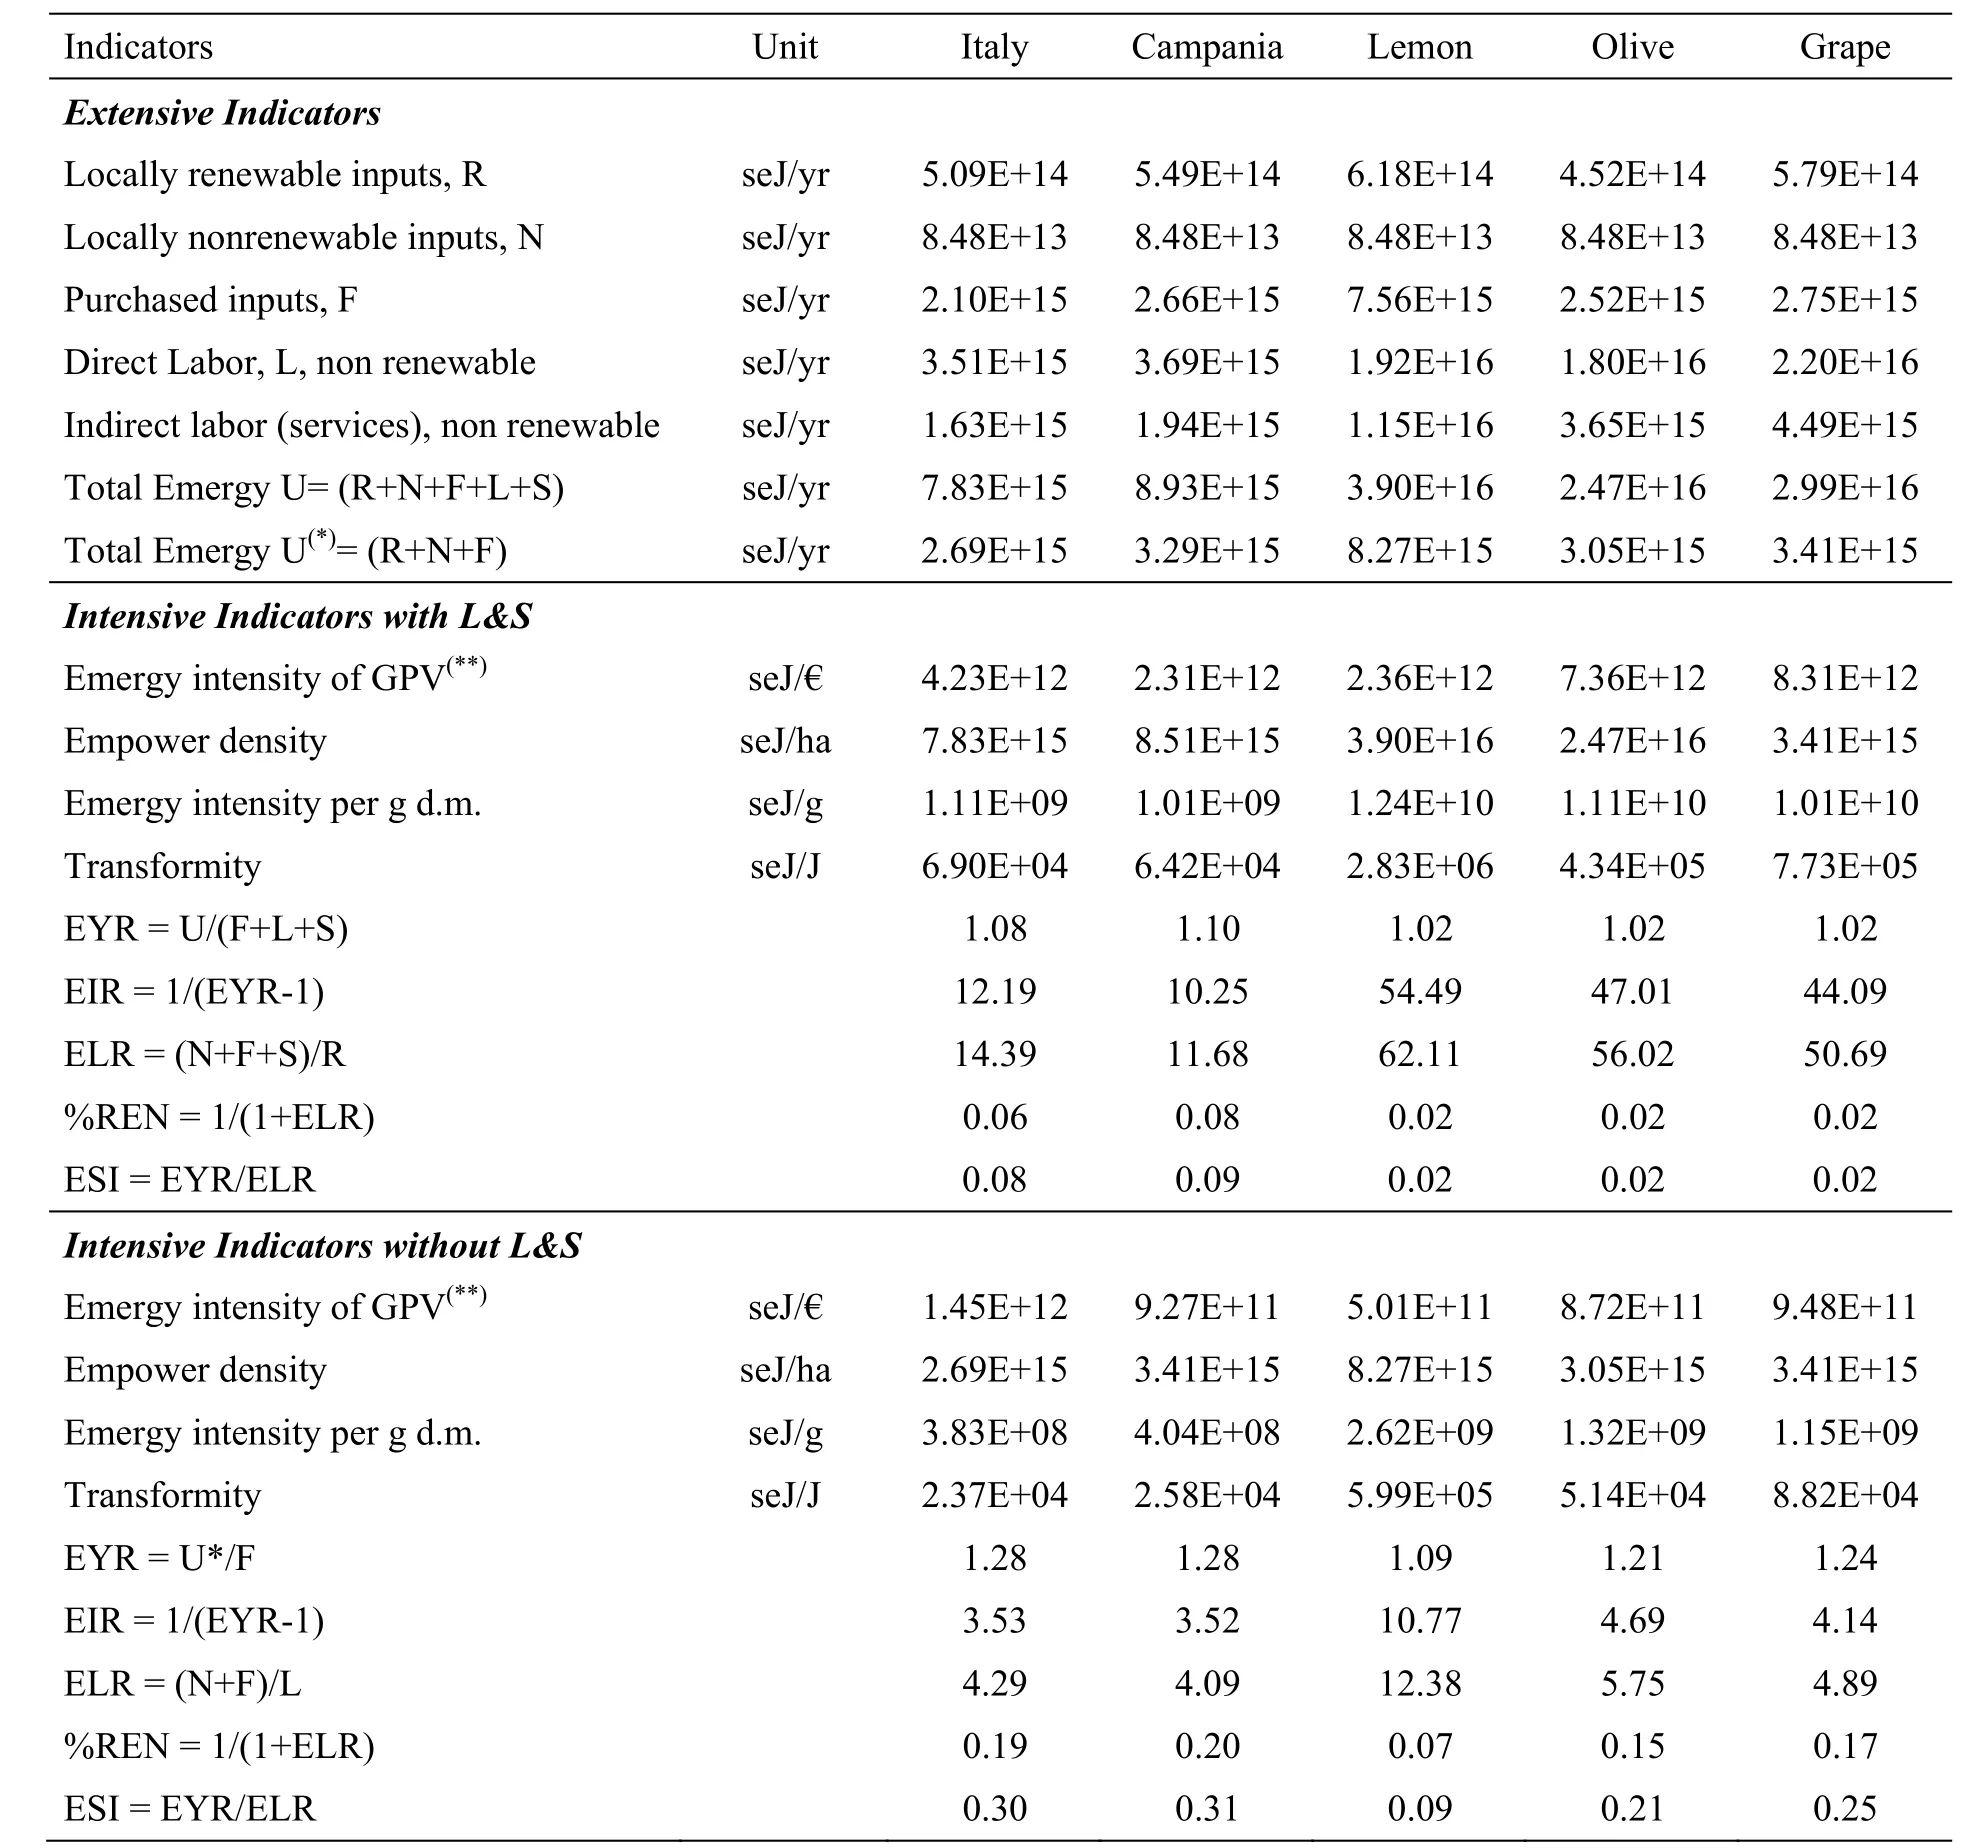
Table 4 Emergy indicators per hectare of the agricultural sectors of Italy and Campania region compared to three local farms in the same region (data refer to the year 2006)
All the values above include the emergy supporting labor and services (L&S) in the process. If L&S are not included, variations in the range 30% - 50% are calculated, as a consequence of the special laborintensive structure of Italian and regional agricultural sectors.
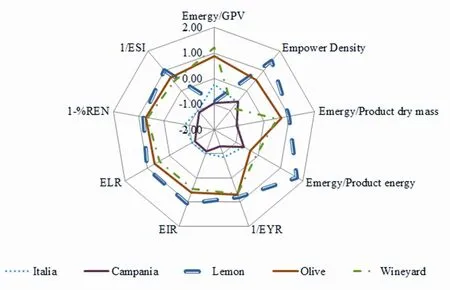
Fig. 5 Comparison of the performance indicators of national, regional and local scale agricultural systems in the year 2006. Values in the diagram are normalised according to the standard score normalization. Real values and units are listed in Table 4.
4.2 Expectations on agriculture
The climate and energy strategy of the European Union is a set of binding legislation which aims to ensure the European Union meets its ambitious climate and energy targets for 2020. These targets, known as the "20-20-20" targets, set three key objectives for 2020:
a) A 20% reduction in EU greenhouse gas emissions from 1990 levels;
b) Raising the share of EU energy consumption produced from renewable resources to 20%;
c) A 20% improvement in the EU's energy efficiency.
Climate and energy targets were set by EU leaders in March 2007, when they committed Europe to become a highly energy-efficient, low carbon economy, and were enacted through the climate and energy package in 2009 [23].
An important share of the EU strategy is made up with increased use of biofuels in transportation patterns (10% of total use), through implemented non-food crops and improved conversion of secondgeneration biomass substrates (lignocellulosic residues, non food oil-crops, etc).
The G8 Summit 2009 stated the commitment of the world leading economies to address the climate change issue by adopting global solutions. According to the final Summit document the world leaders“…reiterate our willingness to share with all countries the goal of achieving at least a 50% reduction of global emissions by 2050, recognising that this implies that global emissions need to peak as soon as possible and decline thereafter. As part of this, we also support a goal of developed countries reducing emissions of greenhouse gases in aggregate by 80% or more by 2050 compared to 1990 or more recent years” [24].
Finally, the Vision 2050 document issued by the World Business Council for Sustainable Development, “a CEO-led organization of forward-thinking companies that galvanizes the global business community to create a sustainable future for business, society and the environment” [25], highlights the needfor secure and sufficient supply of low-carbon energy, 50% decrease of CO2emissions, and low-carbon transportation patterns, and commits member Companies towards increased efforts to such sustainability target.
No doubt, these statements by political and economic leaders call for an increased role of agriculture, as potential supplier of low-carbon bioenergy and biomaterials, in addition to food production. This is because of the expected depletion of fossil resources and the restrictions imposed by environmental concerns. The agricultural sectors of all nations will have to become able to provide increased amounts of non-food substrates as the starting point for a biofuel/biomaterial production to replace at least a fraction of the shrinking fossil resources. In order not to compete with food production, agricultural sectors will have to generate large amounts of non-food biomass in marginal land and also make available a large fraction of agricultural residues for bioconversion purposes. For this to be possible, world agriculture will also have to become self-sufficient in terms of direct and indirect energy requirement (fuels, fertilizers, etc), in addition to deliver energy and material resources to other sectors. A very radical roadmap was suggested by the International World Wide Fund for Nature [26] in its Energy Report 2050. By stopping food waste and by halving the excess meat consumption in western countries, more land can be diverted from fodder production and pasture grazing to sustainable, second-generation non-food biomass. In so doing, in a worldwide scenario that foresees 261 EJ/yr of energy consumption in the year 2050, compared to the 327.6 EJ/yr of the year 2010, biomass would be able to provide 50.8 EJ/yr of transport fuels (19.4% of total energy use), 34.8 EJ/yr for heat and fuel energy needs of the industrial sector (13.3%), 16.2 EJ/yr for electricity production (6.2%), plus minor contributions to other sectors, in addition to food provision to the expected population of over 9 billion people. Biomass energy would account for about 40% of total low-carbon energy use worldwide, in a scenario of no fossil fuel use in the year 2050. In spite of worldwide concerns about the actual feasibility of such a biomass-intensive energy roadmap [27], there is no doubt that this strategy would require a huge change in the production patterns of worldwide agricultural sectors, and Italian agriculture as well.
Our results concerning national, regional and local agricultural systems in Italy raise significant concern of the feasibility of such target. Although the present design of these agricultural systems mainly is food-production oriented, without much attention to energy or chemical use of residues, it clearly appears that the Italian agricultural system would have to shift to increased efficiency, less fodder and pasture land allocation (presently accounting for about 40% of total land use), optimization of resource use (fertilizers, water, among others), better use of marginal land, energy self-sufficiency, in order to meet the future increased expectations. Results point out that the agricultural sector is still too much reliant on nonrenewable resources and therefore unlikely to fulfill the new expectations. Innovative policies need therefore to be implemented for sustainable and multifunctional agriculture.
4.3 Scenarios Analysis
In order to evaluate strategies and scenarios for innovative patterns in agriculture, selected opportunities and alternatives are explored by making use the most crucial parameters (e.g. fertilizers, machinery and fuels). In this study a scenario analysis was performed in the case of Campania Region agriculture by assuming percent changes of direct input flows (e.g. more or less nitrogen fertilizer) and indirect input flows (e.g. more or less efficient industrial production of nitrogen fertilizer, translating into a lower or higher emergy intensity value), in order to explore the consequences of efficiency changes on calculated indicators [28,29]. Assumptions are related to specific policy or technical actions applied to the situation of the year 2006 as the starting point:
a) decreased amount of input flows due to more efficient use (e.g. more accurate spread of fertilizers, better irrigation devices; good maintenance of machinery for fuel conservation and longer lasting);
b) increased use of renewable sources of energy and materials (e.g. solar modules for water heating; photovoltaic electricity; woody structures; etc) instead of fossil fuels, iron and concrete;
c) replacement of input flows by means of co-products of the process (e.g. less energy input and more use of biogas from anaerobic digestion of residues from agriculture or food industry; less nitrogen and more fertilizer from composting of residues; etc);
d) improvement of the technical performance of the upstream production chain, in order to decrease the material, energy and emergy production costs of the input flows (e.g. different production patterns; technological innovation; conservation measures applied to the production chain; etc);
e) increased output, thanks to the production and market valorization of value-added products (chemicals, bioenergy, biomaterials, cosmetics, fibers, food integrators, etc) that increase the output (GDP, energy content, mass) and affect the performance indicators per unit of output.
It clearly appears that the choices in points (a) to (e) above translate into variations of input and output flows or intensities in scenario analysis, that in turn translate into quantified changes of the impacts. The input flows to Campania regional agriculture, responsible for the largest environmental impact, were identified from a reference scenario (Scenario A, business as usual): diesel, machinery, fertilizers (nitrogen) and labor. The application of scenario analysis consisted in selected variations of such input flows by assuming selected percentages of change: -20% of diesel, machinery and nitrogen input flows; -50% of electricity input and, from -10% to -20% of the emergy intensities. Of course, the decrease of purchased inputs also entails a decrease of the related services.
Results obtained from the combination of the above changes are shown in the radar diagram of Fig.6, according to the following scenarios:
· Scenario A: business as usual;
· Scenario B: -20% of diesel, machinery and nitrogen input flows;
· Scenario C: -20% of diesel, machinery and nitrogen emergy intensities;
· Scenario D: -10% of diesel, machinery and nitrogen emergy intensities, -50% of electricity intensities, -10% of diesel, machinery and nitrogen input flows;
· Scenario E: -20% of diesel, machinery and nitrogen emergy intensities, -50% of electricity emergy intensity, -20% of diesel, machinery and nitrogen input flows.
Variations of performance indicators are assumed to be generated by an improvement of technologies (agricultural machinery as well as improved production chains of input flows used) or by a more efficient use of local resources, in order not to alter the final agricultural production. The scenario results applied to the performance indicators of regional agriculture in the year 2010 suggest that non-negligible improvements can be achieved (scenario E versus Scenario A-Business as Usual) by improving the efficiency of supply and use process chains by small percentages, without affecting the final yield. Reuse of residues for energy, implementation of solar thermal and photovoltaic energy, replacement of conventional irrigation by means of drip irrigation, increase of machinery efficiency are likely to provide much better opportunities for energy and material resource savings, thus increasing the overall sustainability.

Fig. 6 Emergy indicators calculated for different scenarios in Campania region (reference year: 2010). Values in the diagram are normalised with reference to scenario A (business as usual). Real values and units are listed in Table 5.
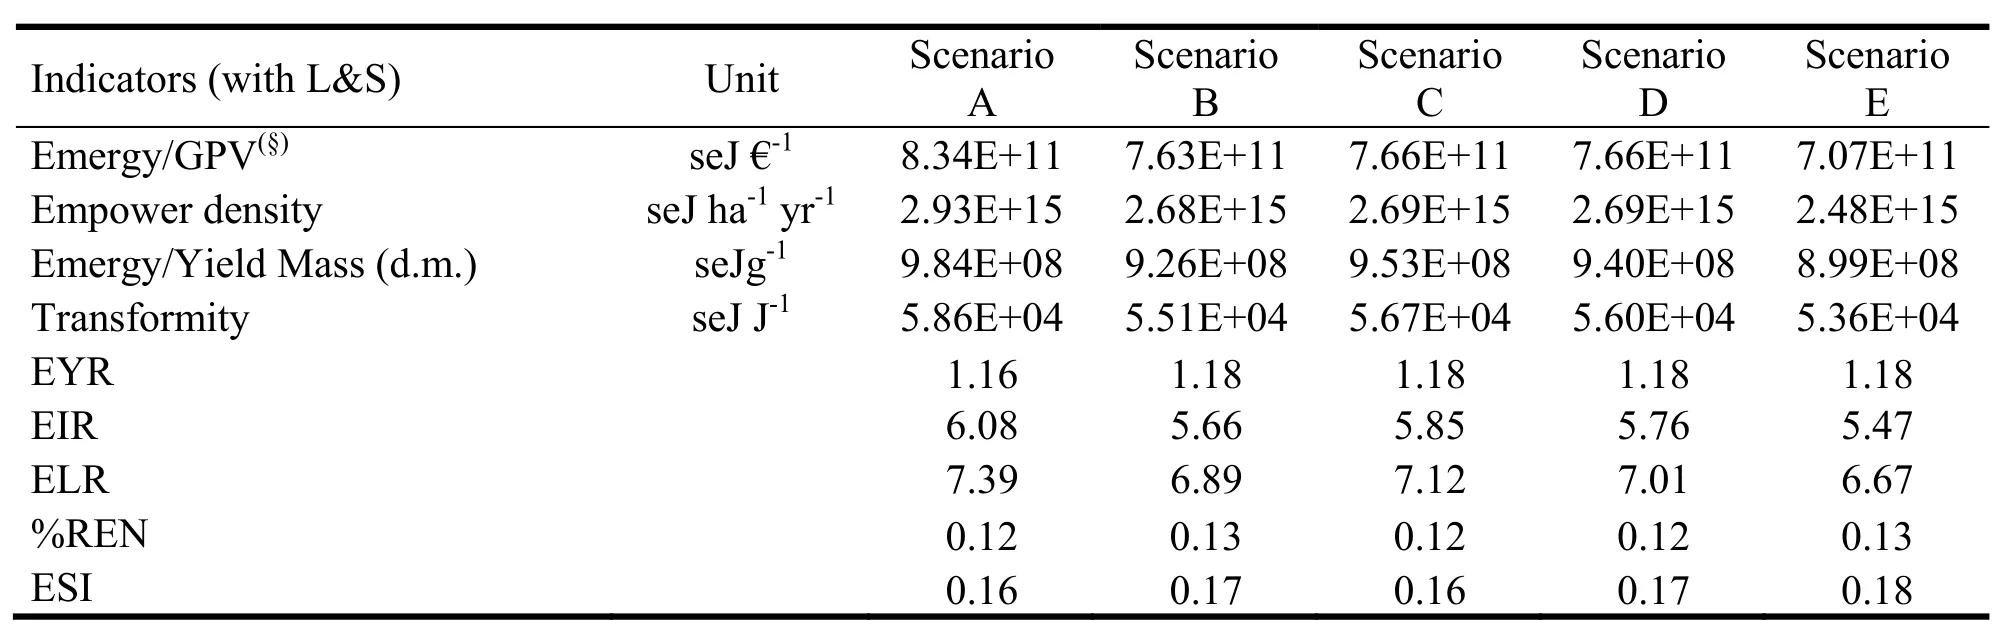
Table 5 Indicators of environmental performance and sustainability of Campania region agriculture, calculated under five different scenario assumptions(*).
5 Conclusions
Three different hierarchical levels of Italian agriculture were investigated and their performances across scales quantitatively assessed. The decreasing renewability of the agricultural sector and the main factors of its unsustainability and resilience (ability to face perturbations in the surrounding environment, in order to decrease vulnerability: e.g. increased oil scarcity) were pointed out. The application of the emergy method was proved to be an effective tool to quantify the development potential achievable as a consequence of efficiency or technological improvement.
In order to generate a clear picture of the investigated system it was fundamental to identify the crucialsteps and the main input and output flows, i.e. those steps and those flows that affected more heavily the process performance. In so doing it was possible to focus on them in order to understand their importance to the global dynamics of the investigated process, suggest changes capable of improving performance and draw scenarios of systems’ response to oscillations of production factors.
The emergy approach and the related scenario analysis allow to investigate if and how some steps might be replaced by alternative patterns, some input flows be decreased by means of more efficient machinery or sub-processes, and finally some input flows simply be avoided without any important consequence for the final product. Therefore, when a calculated performance indicator is not satisfactory, the analyst can go back to the calculation procedure in order to identify the input items that are more responsible for a performance drop and may suggest to decrease their amount by applying more efficient resource use and technological changes to the process (e.g., use of a different source of energy or crop rotation or decreased amount of fertilizer or recycling patterns). After the suggested changes are implemented (or their adoption simulated), the analyst is able to recalculate the unsatisfactory indicator and assess the potential for performance improvement.
The whole assessment procedure was made possible, at all scales, by the use of the emergy synthesis approach. The latter proved to be capable of combining:
i. different kinds of renewable and nonrenewable as well as local and imported input flows (fertilizers, fuels, machinery and so on, including the emergy associated to labor and services);
ii. different production strategies;
iii. spatial and time scales; and finally
iv. planned or undesired time oscillations of combined sets of parameters,
in order to generate performance indicators, evaluations of past trends, and design of scenarios for sound agricultural policy making.
[1] MEA, Millennium Ecosystem Assessment. (2005),Ecosystems and Human Well-being: Synthesis, Island Press, Washington D.C, 138 pp.
[2] IAASTD, International Assessment of Agricultural Knowledge. (2008),Science and Technology for Development Agriculture at a Crossroads: Global Report, Island press, Washington DC, 590 pp.
[3] Conforti, P. and Giampietro, M. (1997), Fossil energy use in agriculture: an international comparison.Agriculture, Ecosystems & Environment, 65, 231-243.
[4] Odum, H.T. (1996),Environmental Accounting: Emergy and Environmental Decision Making, John Wiley and Sons. New York, 370 pp.
[5] Brown, M.T. and Ulgiati, S. (2004),Emergy Analysis and Environmental Accounting, In: Encyclopedia of Energy, Elsevier, Oxford, UK: 329-354.
[6] Brown, M.T. and Ulgiati, S. (2004), Energy quality, emergy, and transformity: H. T. Odum’s contribution to quantifying and understanding systems,Ecological Modeling, 178, 201-213.
[7] Franzese, P.P., Rydberg, T., Russo, G.F. and Ulgiati, S. (2009). Sustainable biomass production: A comparison between Gross Energy Requirement and Emergy Synthesis methods.Ecological Indicators, 9, 959-970.
[8] ISTAT, National Institute of Statistics. (1985), Agricultural statistics handbook, Roma, Italy. www.istat.it.
[9] ISTAT, National Institute of Statistics. (1993), Agricultural statistics handbook, Roma, Italy. www.istat.it.
[10] ISTAT, National Institute of Statistics. (2002), Agricultural statistics handbook, Roma, Italy. www.istat.it.
[11] ISTAT, National Institute of Statistics. (2006), Agricultural statistics handbook, Roma, Italy. www.istat.it.
[12] ISTAT, National Institute of Statistics. (2012), Agricultural statistics handbook, Roma, Italy. www.istat.it.
[13] Ulgiati, S., Odum, H.T. and Bastianoni, S. (1993), Emergy Analysis of Italian Agriculture System. The role of Energy Quality and Environmental Inputs.In “Trends in Ecological Physical Chemistry”; L. Bonati, U. Cosentino, M. Lasagni, G. Moro, D. Pitea and A. Schiraldi Editors, Elsevier Science Publishers, Amsterdam, the Nederlands, 187-215.
[14] Odum, H.T. (1988), Self-organization, transformity and information,Science, 242, 1132-1139.
[15] Odum, H.T. (1994),Ecological and General Systems, University Press of Colorado, USA, 644 pp.
[16] Odum, H.T. (2007),Environment, Power and Society for the Twenty-First Century: The Hierarchy of Energy, Columbia University Press, USA, 432 pp.
[17] Ulgiati, S., Ascione, M., Bargigli, S., Cherubini, F., Franzese, P.P., Raugei, M., Viglia, S. and Zucaro, A. (2011), Material, energy and environmental performance of technological and social systems under a Life Cycle Assessment perspective,Ecological Modelling, 222, 176-168.
[18] Odum, H.T. (2000),Handbook of Emergy Evaluation Folio 2: Emergy of Global Processes, Centre for Environmental Policy, University of Florida, Gainesville, http://www.emergysystems.org/folios.php.
[19] Buenfill A.A. (2000), Sustainable use of potable water in Florida: An emergy analysis of water supply and treatment alternativesIn: Brown M.T., Brandt-Williams S., Tilley D., Ulgiati S. (Eds.), EMERGY SYNTHESIS. Theory and Applications of the Emergy Methodology. H.T. Odum Center for Environmental Policy, University of Florida, Gainesville, Florida, USA.
[20] Biondi, P., Panaro, V. and Pellizzi, G. (1989),Le richieste di energia del sistema agricolo italiano, CNR, Consiglio Nazionale delle Ricerche, Progetto Finalizzato Energetica, Sottoprogetto Biomasse ed Agricoltura, Report LB-20, Roma,Italia, 389 pp. (in Italian).
[21] Bargigli, S. and Ulgiati, S. (2003), Emergy and life-cycle assessment of steel production in Europe.In: Emergy Synthesis 2. Theory and Applications of Emergy Methodology–. M.T. Brown, H.T. Odum, D. Tilley, and S. Ulgiati (Editors), published by the Center for Environmental Policy, University of Florida, Gainesville, FL, 2003, ISBN 0-9707325-1-1, 141-155.
[22] Cialani, C., Russi, D. and Ulgiati, S. (2005), Investigating a 20-year national economic dynamics by means of emergybased indicators, In: Brown, M.T., Campbell, D., Comar, V., Haung, S.L., Rydberg, T., Tilley, D., Ulgiati, S. (Eds.), Emergy Synthesis, 401-416.
[23] EU. (2009), European Commission. Commissioner for Climate Action. http://ec.europa.eu/clima/policies/package/index_en.htm.
[24] G8 Summit. (2009), Responsible Leadership for a Sustainable Future. World G8 Summit, L’Aquila, Italy. http://www.g8italia2009.it/static/G8_Allegato/G8_Declaration_08_07_09_final%2c0.pdf.
[25] WBCSD. (2010), World Business Council for Sustainable Development, http://www.wbcsd.org/Pages/Adm/Download.aspx?ID=320&ObjectTypeId=7. Last retrieved 20 February.
[26] WWF. (2011),The Energy Report. 100% Renewable Energy by 2050, ISBN 978-2-940443-26-0. P. 256. http://wwf.panda.org/what_we_do/footprint/climate_carbon_energy/energy_solutions/renewable_energy/sustainable_energ y_report/.
[27] Pimentel, D. (2008),Biofuels, Solar and Wind as Renewable Energy Systems Benefits and Risks. Springer Science+Business Media B.V. ISBN: 978-1-4020-8653-3, pp. 513.
[28] Pereira, L., Zucaro A., Ortega, E. and Ulgiati, S. (2011),Wealth, Trade and Environment in Brazil and Italy: An emergybased comparison of carrying capacity, economic performance and wellbeing, In: Jesús Ramos-Martín, Mario Giampietro, Sergio Ulgiati, and Sandra G.F. Bukkens (Editors). Can We Break the Addiction to Fossil Energy? Proceedings of the 7th Biennial International Workshop Advances in Energy Studies, Barcelona, Spain, 19-21 October 2010. UAB, Barcelona, pp. 685-694.
[29] Zucaro, A. (2010),Assessing the performance of agricultural systems across time and spatial scales: An extended LCA approach. A dissertation presented to the Graduate School of the University of Napoli “Parthenope” in partial fulfillment of the requirements for the requirements for the degree of Doctor of Philosophy in “Environment, Resources and Sustainable Development”.
19 January 2013
†Corresponding author.
Email address: amalia.zucaro@uniparthenope.it
ISSN 2325-6192, eISSN 2325-6206/$- see front materials © 2013 L&H Scientific Publishing, LLC. All rights reserved.
10.5890/JEAM.2013.01.006
Accepted 25 February 2013
Available online 2 April 2013
猜你喜欢
杂志排行
Journal of Environmental Accounting and Management的其它文章
- Global Gold Mining: Is Technological Learning Overcoming the Declining in Ore grades?
- Multi-scale Input-output Analysis for Multiple Responsibility Entities: Carbon Emission by Urban Economy in Beijing 2007
- Keeping the Books for the Environment and Society: The Unification of Emergy and Financial Accounting Methods
- Analysis of the Scientific Collaboration Patterns in the Emergy Accounting Field: A Review of the Co-authorship Network Structure
- Carbon Footprint and Life Cycle Assessment of Organizations
- Sustainability Ethics and Metrics: Strategies for Damage Control and Prevention