Smallest bitter taste receptor (T2Rs) gene repertoire in carnivores
2012-12-25LingLingHUPengSHI
Ling-Ling HU, Peng SHI
1. State Key Laboratory of Genetic Resources and Evolution, Kunming Institute of Zoology, Chinese Academy of Sciences, Kunming 650223, China;2. University of Chinese Academy of Sciences, Beijing 100049, China
Smallest bitter taste receptor (T2Rs) gene repertoire in carnivores
Ling-Ling HU1,2, Peng SHI1,*
1.State Key Laboratory of Genetic Resources and Evolution,Kunming Institute of Zoology,Chinese Academy of Sciences,Kunming 650223,China;2.University of Chinese Academy of Sciences,Beijing100049,China
Bitter taste reception is presumably associated with dietary selection, preventing animals from ingesting potentially harmful compounds. Accordingly, carnivores, who encounter these toxic substances less often, should have fewer genes associated with bitter taste reception compared with herbivores and omnivores. To investigate the genetic basis of bitter taste reception, we confirmed bitter taste receptor (T2R) genes previously found in the genome sequences of two herbivores (cow and horse), two omnivores (mouse and rat) and one carnivore (dog). We also identified, for the first time, the T2R repertoire from the genome of other four carnivore species (ferret, giant panda, polar bear and cat) and detected 17-20 bitter receptor genes from the five carnivore genomes, including 12-16 intact genes, 0-1 partial but putatively functional genes, and 3-8 pseudogenes. Both the intact T2R genes and the total T2R gene number among carnivores were the smallest among the tested species, supporting earlier speculations that carnivores have fewer T2R genes, herbivores an intermediate number, and omnivores the largest T2R gene repertoire. To further explain the genetic basis for this disparity, we constructed a phylogenetic tree, which showed most of the T2R genes from the five carnivores were one-to-one orthologs across the tree, suggesting that carnivore T2Rs were conserved among mammals. Similarly, the small carnivore T2R family size was likely due to rare duplication events. Collectively, these results strengthen arguments for the connection between T2R gene family size, diet and habit.
T2R; Bitter taste; Carnivores; Duplication
Bitter taste perception is important for the survival of animals in the wild. In nature, a variety of toxic substances have a bitter taste. Given that bitter perception has been shown to induce animals to display aversion behavior (Garcia & Hankins, 1975; Glendinning, 1994), perception of this taste has potentially evolved as a defense mechanism against ingesting toxic compounds. A decade ago, two groups independently identified a novel family of seven-transmembrane G protein-coupled receptors (GPCRs) as candidate bitter taste receptors (T2Rs) responsible for detection of bitter tastes (Adler et al, 2000; Chandrashekar et al, 2000). The coding regions of T2R genes are ~900 bp long and intronless. Subsequent studies expanded these findings and showed that bitter tastants bind to T2Rs and trigger the bitter taste perception signal transduction pathway (Behrens et al, 2007; Behrens & Meyerhof, 2006, 2009; Chandrashekar et al, 2006; Mueller et al, 2005).
The macroevolution of T2Rs has been well elaborated among several vertebrates, featured by the dynamic change of gene birth and death (Dong et al, 2009; Go, 2006; Go et al, 2005; Shi & Zhang, 2006; Shi et al, 2003). Interestingly, there are ~20 T2R genes in the carnivorous dog (Canis familiaris), which is the smallest known T2R gene family in terrestrial mammals discovered to date, with the exception of the dolphin (Jiang et al, 2012). It has been hypothesized that T2R family size in carnivores is smallest, while herbivores possess an intermediate size and omnivores possess the largest, with gene family size related to the amount of bitter toxic compounds they encounter (Shi & Zhang, 2006). To test the accuracy of this hypothesis, we analyzed several carnivore species to accurately investigate the evolutionary pattern of the T2R gene family among the carnivore lineage.1
The mammalian order Carnivora includes ten families divided into two monophyletic super-families, Caniformia and Feliformia (Yu et al, 2004), which each consist of five families. In the present study, we included five carnivore species from both super-families: the domestic dog, giant panda, domestic ferret, polar bear and domestic cat. Domestic dogs are primarily omnivorous, including both animal and plant foods in their diet (Bhagat, 2002). Giant pandas (Ailuropoda melanoleuca) are primarily herbivores, but also include animal foods in their diets (Bies, 2002). The domestic ferret (Mustela putorius furo), polar bear (Ursus maritimus), and domestic cat (Felis catus) are all carnivores with primary diets consisting of terrestrial vertebrates (Anna Toenjes, 2011; Duda, 2003; Gunderson, 2009). The easy availability of the giant panda, domestic ferret, domestic cat, and polar bear genome sequences provides an opportunity to identify the intact carnivorous T2R repertoire, shedding light on the evolutionary mechanism of bitter tastes and the evolutionary adaptations necessary for carnivore survival. To this end, we first identified the T2R genes from these five carnivores and then chose another five mammalian herbivores and omnivores—cow, horse, mouse, rat and human—with different dietary preferences, to compare their T2R genes with those of carnivores in a phylogenetic analysis.
MATERIALS AND METHODS
Data
The genome version for each species was as follows: domestic cat (Felis-catus-6.2, Sep 2011), domestic dog (CanFam 3.1, Sep 2011), giant panda (ailMel1, Jul 2009), domestic ferret (MusPutFur 1.0, Jun 2011), polar bear (BGI-Shenzhen, 2010), cow (UMD 3.1, Nov 2009), horse (EquCab2, Sep 2007), mouse (NCBI 37, April 2007) and rat (RGSC 3.4, Dec 2004).
Detection of T2R genes
Beginning with the human T2R protein sequences reported in our previous paper (Shi & Zhang, 2006), TblastN (Altschul et al, 1997) was used to obtain corresponding T2R sequences from each candidate genome using an E-value less than le-5. All obtained sequences were used to blast the NR database, with the sequence discarded when the best hit was not T2R. To further confirm the results, a tree for all T2R sequences was constructed via the neighbor-joining method, using V1R sequences as the out group. When the T2R sequence was not clustered with candidate T2R genes but was clustered outside of the out-group V1R sequences, the sequence was discarded. We predicted the ORFs for the remaining sequences, and when an ORF was found longer than 800 bp, we assumed it to be an intact T2R gene. If there was a stop codon, we then defined it as a pseudogene. When an ORF was found to be less than 800 bp in length, we assumed it to be a partial gene.
Phylogenetic tree analysis
The translated amino acid sequences of T2R genes in human, mouse, rat, cow, horse, dog, ferret, giant panda, polar bear and cat were aligned using ClustalW (Thompson et al, 1994) with default parameters. The phylogenetic tree was constructed in Mega5 (Tamura et al, 2011) using the neighbor-joining method (Saitou & Nei, 1987) with protein Poisson correction distances (Masatoshi & Sudhir, 2000). The bootstrap values of the tree were evaluated with 1,000 replications (Felsenstein, 1985). The nucleotide sequences of eight dog and polar bear non-functional T2R genes along with eight intact T2R genes were aligned by ClustalW with default parameters. The phylogenetic tree was constructed with Mega5 using the neighbor-joining method with pdistances. Two cow V1R genes were used as an out group.
RESULTS AND DISCUSSION
Carnivore T2R gene repertoires
To characterize the T2R gene repertoire in carnivores, we searched genome sequences from the five selected carnivore species—dog, ferret, giant panda, polar bear and cat—with previously reported human T2R genes as queries. There were three kinds of newly identified genes: intact genes (full-length ORF); putative genes (partial sequences with undisruptive ORF due to incomplete genome sequences); and pseudogenes (sequences with premature stop codons). We ultimately detected the T2R repertoires of the five carnivores, consisting of 12-16 intact genes, 0-1 partial genes, and 3-8 pseudogenes in each species (Table 1). The average fraction of pseudogenes in the five carnivore genome sequences was 27%. All amino acid sequences of intact T2R genes from dog, ferret, giant panda, polar bear, and cat are available in the supplementary data set. The average number of T2R genes among carnivores was 19.4, including 14 intact T2R genes (Table 1).
We chose five other mammals with different dietary preferences to compare their T2R genes with those of the carnivores. The analysis of human, mouse, rat, and cow were performed previously by Shi & Zhang (2006) and Dong et al (2009), but were updated in the present study with high-coverage genomes, with 42, 41, 29 and 45 total T2R genes identified among mouse, rat, cow and horse genomes, respectively (Table 1). Our results were almost identical to those previously reported, with the slight differences likely attributable to different calculation methods. The average numbers of T2R genes detected in genomes of herbivores and omnivores were 37.0 and 39.7, respectively, (Table 1) and both were higher than that of carnivores. A similar pattern was found in the average number of intact T2R genes.
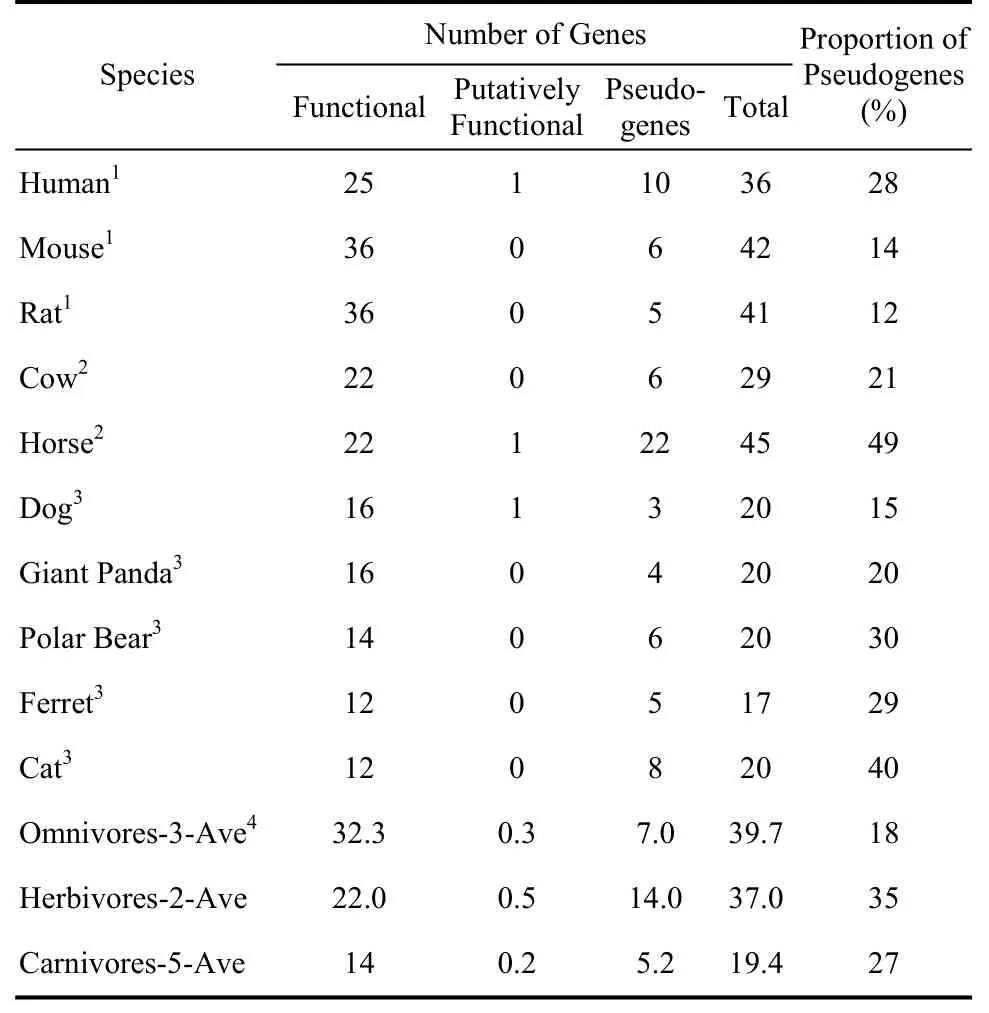
Table 1 Number of genes and pseudogenes in vertebrate T2R gene family
Bitter compounds are more common in plant than in animal tissue, and as such herbivores are expected to encounter more bitter substances than carnivores (Glendinning, 1994). As expected, the average number of total T2R among the five carnivores (19.4) was smaller than that present in both the herbivores and omnivores (Table 1). This was consistent with our hypothesis that carnivore species (including dogs) should have smaller T2R gene repertoires, on average, compared with herbivores or omnivores. This assumption was further supported by the lower average number of intact T2Rs found in carnivores (14) than in the two herbivore (22) and three omnivore (32.3) species. The smaller number of intact carnivore T2Rs was unsurprising, given their dietary habit adaptations that tend to involve fewer foods with bitter tastants compared with the diets of herbivores and omnivores. Subsequently, as omnivores encounter more bitter tastants than do herbivores (Shi & Zhang, 2006), omnivores should—as we observed—have more intact T2Rs and a larger entire T2R gene family than herbivores.
However, mismatches do exist between feeding ecology and taste receptor evolution (Zhao & Zhang, 2012). For example, the loss of T1R2 in vampire bats may be related to the narrowness of their diet rather than specific diet. Bats with different feeding habits also have pseudogenization or loss of T1R1. However, we are not able to extend this rule in vertebrates. For example, chickens only harbor three T2Rs (Shi & Zhang, 2006) although it is a herbivore and insectivore (Gautier, 2002).
Independent loss of carnivore one-to-one T2R genes
We conducted a phylogenetic analysis based on the alignment of nine intact genes from the five carnivores and the corresponding functional genes from human, mouse, rat, cow and horse. Pseudogene sequences were excluded from analysis. The resulting phylogenetic tree illustrated how the T2R genes of the five carnivores were grouped into one-to-one orthologs and multiple-tomultiple orthologs, consistent with our previous conclusion that T2R genes among humans and mice were grouped into one-to-one and multiple-to-multiple orthologs (Shi et al, 2003).
Among carnivore T2R intact genes, we detected five strict one-to-one orthologs due to frequent gene birth/death in the five carnivores, a main feature of T2R genes among vertebrates (Dong et al, 2009; Go et al, 2005; Shi & Zhang, 2006; Shi et al, 2003). These five strict one-to-one orthologs were separated with the criteria that each gene had one ortholog sequence in each of the five carnivores. For example, the one-to-one ortholog gene tree for the dogT2R1-ortholog cluster (Figure 1) was consistent with the species tree. The other four strict one-to-one orthologs are shown in Figure S1. The strict one-to-one ortholog T2R genes were the most conserved T2R genes among all tested carnivore animals, compared with other T2R orthologs, suggesting that these were crucial for the survival of carnivores, perhaps even for mammals in general (Go et al, 2005; Shi et al, 2003).
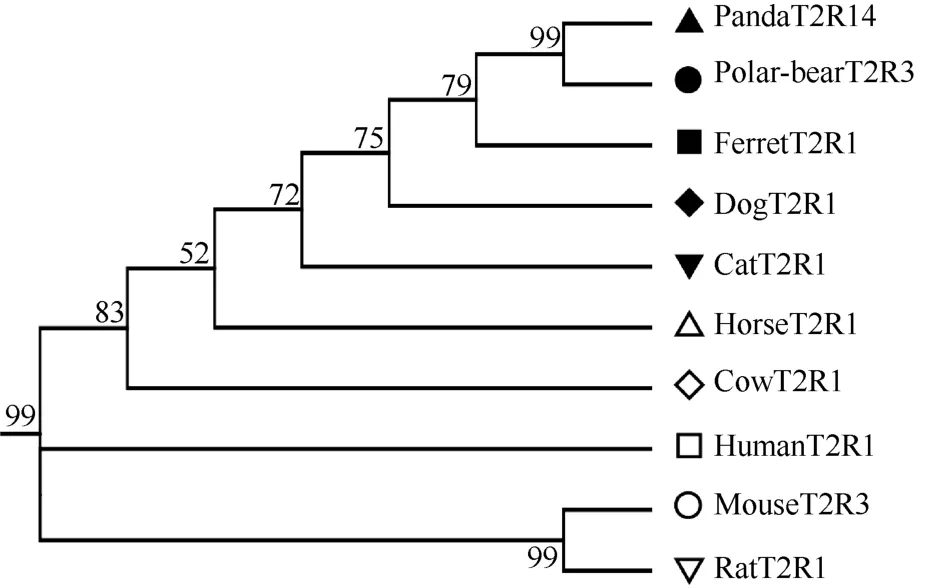
Figure 1 Sub-tree of one strict one-to-one T2R orthologs among ten mammal species
Except for the strict one-to-one orthologs present in all five carnivores, there were nine one-to-one orthologs lost in one or more of the carnivore species. To exclude low quality genome sequences, we used the intact genes as queries to blast each carnivore genome sequences that had lost the ortholog T2R gene and found the corresponding lost T2R pseudogene. We then used the pseudogene to re-blast the query T2R genome to ensure the best hit was the queried T2R. If a species lost one intact T2R gene, we found the lost pseudogene in that genome sequence due to the small evolutionary scale among carnivores. As expected, we searched the candidate genome sequences for the lost intact T2R gene and found each lost pseudo T2R gene for each carnivore, with the exception of the ferret due to low coverage genome quality. For example, for the dogT2R3-ortholog cluster (Figure 2), only one carnivore (polar bear) among the ten species lost this gene. For the dogT2R13-ortholog cluster, three carnivores (cat, ferret and polar bear) lost these genes, along with the horse. Overall, nine one-to-one ortholog genes were lost in different combinations among the different carnivore species. Interestingly, the loss of these particular T2R genes did not occur in the ancestor of the carnivore super-families, Caniformia and Feliformia. This loss of one-to-one ortholog was not lineage-specific, suggesting that the loss of the T2R intact genes among carnivores was species-independent. These incomplete one-to-one ortholog genes showed that these genes were lost randomly in different carnivore species, indicating that the functional T2R genes were important for some species but relaxed in others, likely due to the specific environment in which each species evolved to inhabit.
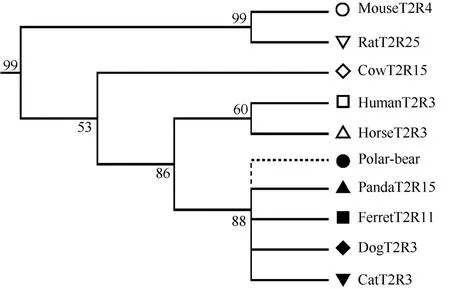
Figure 2 Sub-tree of one-to-one T2R orthologs for the ten species
Rare duplication events among carnivore T2R genes
There were three gene clusters with only one ortholog gene in carnivores, which were duplicated in some non-carnivore species. This kind of T2R genes did not expand in any carnivores and demonstrated a high degree of conservation among these species. For example, in the dogT2R10-ortholog cluster, carnivores had only one copy while mice and rats had five copies. Such an expansion is part of the reason carnivores have such a small T2R family. Conservation of this kind of carnivore T2R gene is likely to maintain the important role they play in the life of carnivores and the increased T2R orthologs among non-carnivore species associated with bitter tastants emerging in their foods compared with carnivore foods. The only exception to this trend was a gene duplicated in cats, giant pandas and ferrets, as well as in all five of the non-carnivore species we investigated. Even for these three carnivores, there were only two copies of the duplicated gene, but in horses and cows there were three and in humans up to eight, which may be responsible for the detection of human-specific tastants (Shi et al, 2003). This similar lack of expansion further explained why carnivores harbored a small T2R family. We considered that after the initial duplication event of T2Rs among carnivores, it did not continue further; but the duplication event continued in noncarnivores after its initial occurrence.
Our results suggested that gene duplication events were virtually non-existent in carnivores. Even though duplication occurred in ferrets, cats and pandas, it did not occur in either dogs or polar bears due to the detection of only one copy of this gene in these two species. The most likely explanation was that one copy was lost independently in both species. To test this possibility, we used all dog and polar bear non-intact T2Rs and all ortholog genes in this duplicated cluster to reconstruct the gene tree in MEGA 5.0. The lost copy of the duplicated cluster in dogs and polar bears was dogps4 and polar bear pseudo3 (Figure 3). This result verified our assumption that both the dog and polar bear each lost one copy of the duplicated gene independently. The pseudogenization of the lost copy of this cluster in dogs and polar bears suggested that the function of this gene was no longer needed or was replaced by other T2R genes as a result of diet and habit adaptation. Further research and comparisons may yield a more complete answer to these types of specific genetic adaptations to dietary needs and to the environment.
The remaining T2R gene clusters were speciesspecific duplicated genes, most of which were rodents and human specific duplicated genes (Conte et al, 2003; Shi et al, 2003). For this kind of T2R genes, carnivores did not possess any orthologs, though some noncarnivores gained some T2R genes. For example, for this kind of T2R genes, mice and rats gained 16 and 17 T2R genes, respectively (Figure 4), which increased the total number of intact T2R family sizes for those species. For the other three non-carnivores, each gained 3 T2R genes in a similar manner. This increase was further reason for the relatively small size of the T2R family among carnivores, as carnivores simply did not have orthologs for the genes among non-carnivores. As they do not encounter as many bitter and potentially toxic substances as omnivores or herbivores, carnivores simply do not need to develop sensitivities to such substances. In this scenario, T2R genes likely correspond to species-specific food habits and could be regarded as a molecular adaptation marker to the environment and diet of a specific species.
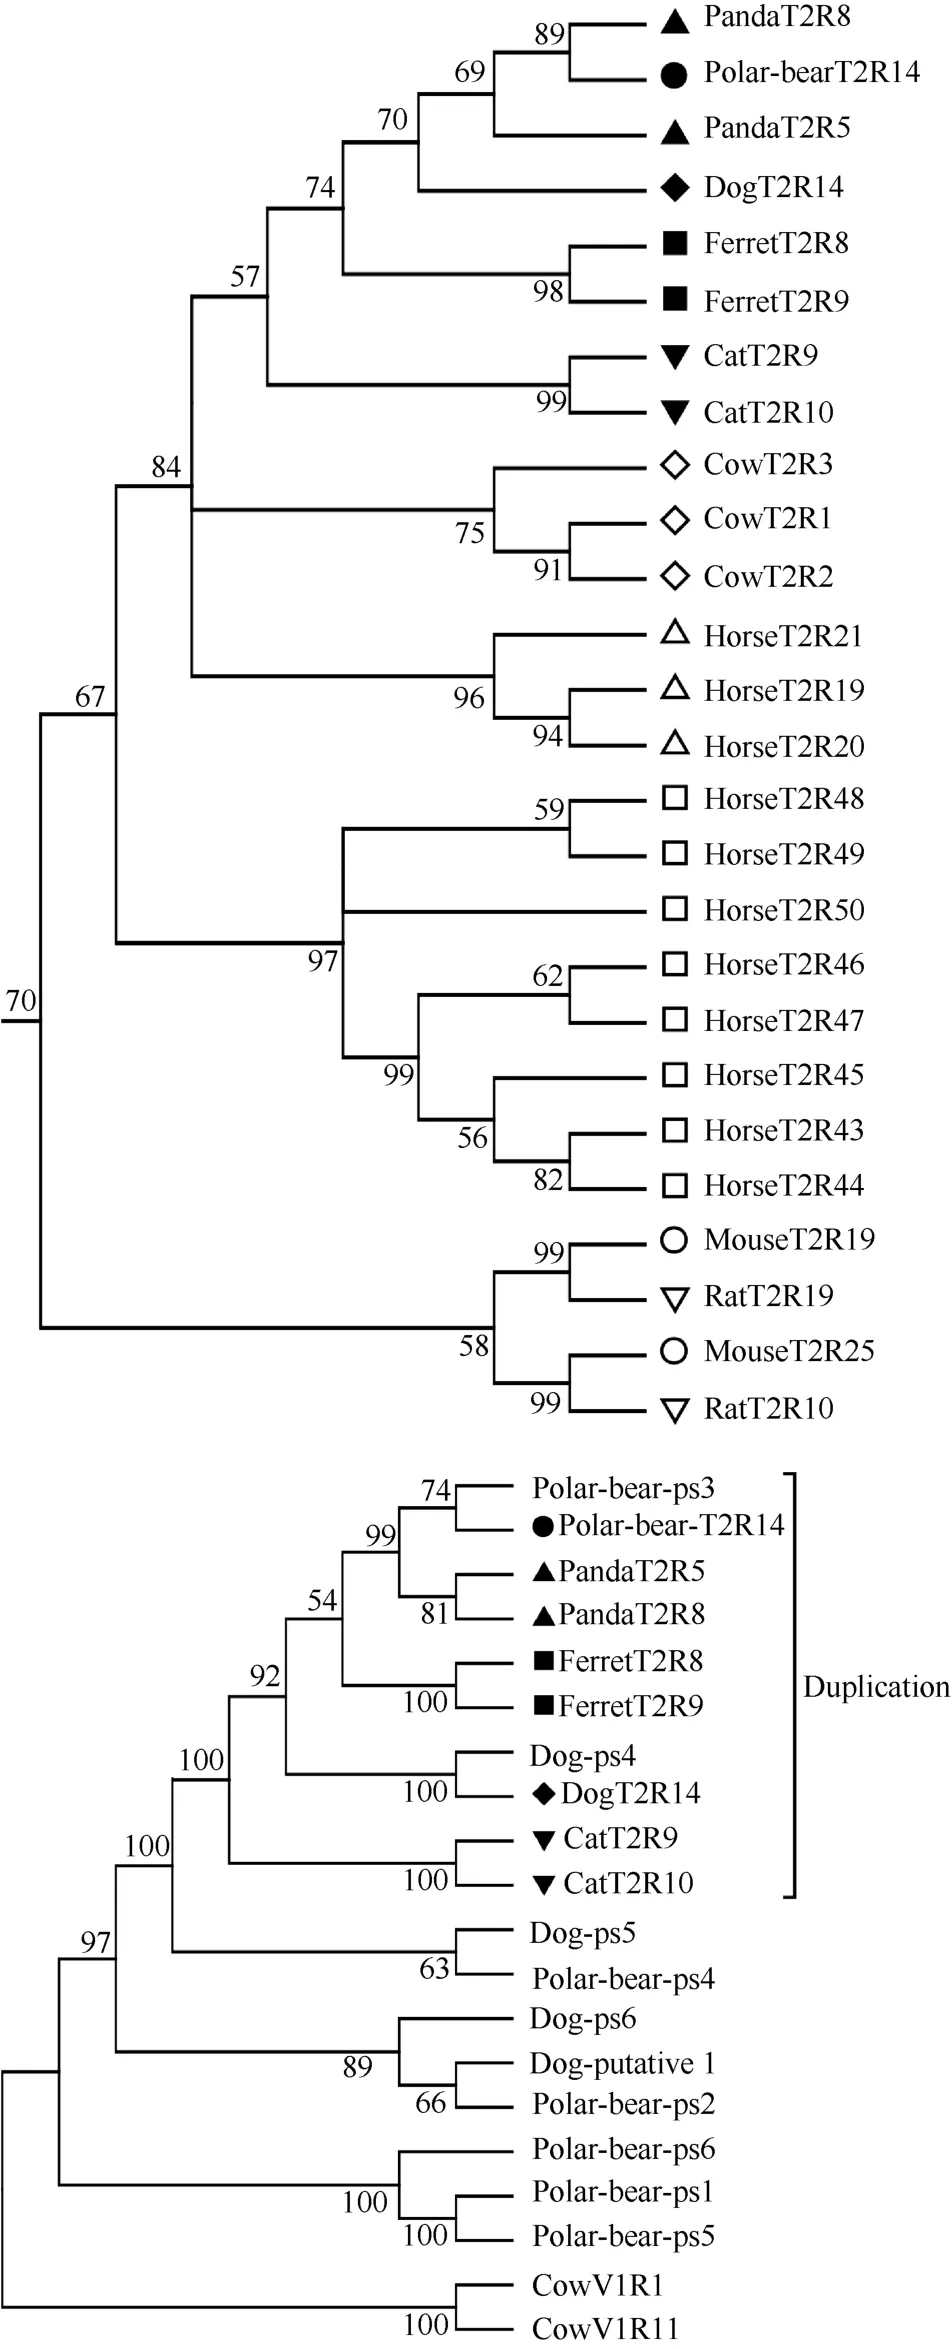
Figure 3 Sub-tree of T2R duplication orthologs for the ten species (3a) and five carnivores (3b)
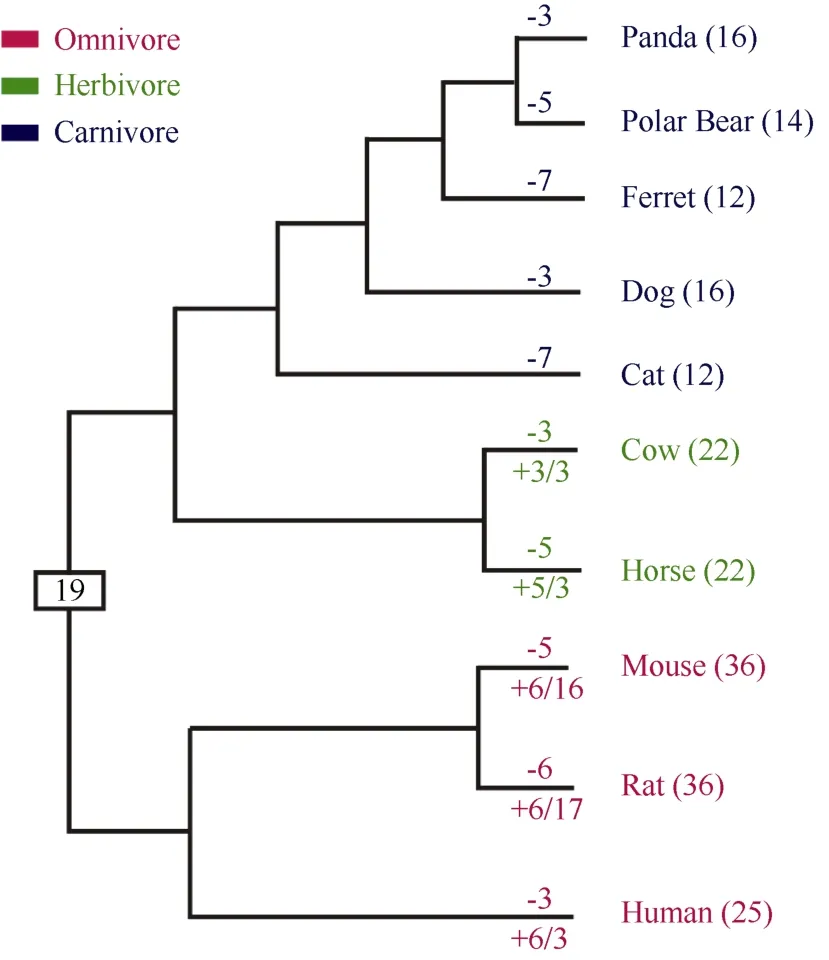
Figure 4 Evolutionary changes in number of intact T2R genes among mammals
In short, our findings confirmed that carnivorous mammals, in general, had the smallest T2R family among the three kinds of mammals (carnivores, herbivores and omnivores), which was likely a result of adaptation to the environment. This difference in size was attributable to the fact that a vast majority of carnivore T2Rs were one-to-one orthologs. Even for these conserved T2R genes, some carnivores lost a gene. Overall, carnivores lost 3-7 intact T2R genes (Figure 4), while non-carnivores lost 3-6 intact T2R genes (Figure 4). Both carnivores and non-carnivores lost a similar number of one-to-one T2R ortholog genes. Nevertheless, duplication events occurred only once for one gene cluster in carnivores, while duplication events occurred more than once among non-carnivores. For this category of T2R genes, which had orthologs in some carnivores, non-carnivores gained 3-6 intact T2R genes (Figure 4). The expanded T2R genes were species-specific gene duplicated genes, especially those in mice and rats, which did not have ortholog genes in any of the five carnivores. The non-carnivore species gained 3-17 intact T2R genes (Figure 4) through this kind of gene duplication. In fact, the five carnivores gained no intact T2R genes, while non-carnivores did. Overall, the small size of the carnivore T2R gene family was due to the relative rarity of gene duplication events in carnivores, while for non-carnivores gene duplication events were the main route for the expanded T2R gene family size.
Adler E, Hoon MA, Mueller KL, Chandrashekar J, Ryba NJP, Zuker CS. 2000. A novel family of mammalian taste receptors.Cell,100(6): 693-702.
Altschul SF, Madden TL, Schaffer AA, Zhang JH, Zhang Z, Miller W, Lipman DJ. 1997. Gapped BLAST and PSI-BLAST: a new generation of protein database search programs.Nucleic Acids Research,25(17): 3389-3402.
Anna Toenjes N. 2011. "Felis catus" (On-line), Animal Diversity Web. Accessed April 09, 2013 at http://animaldiversity.ummz.umich.edu/ accounts/Felis_catus/.
Behrens M, Meyerhof W. 2006. Bitter taste receptors and human bitter taste perception.Cellular and Molecular Life Sciences,63(13): 1501-1509.
Behrens M, Foerster S, Staehler F, Raguse JD, Meyerhof W. 2007. Gustatory expression pattern of the human TAS2R bitter receptor gene family reveals a heterogenous population of bitter responsive taste receptor cells.Journal of Neuroscience,27(46): 12630-12640.
Behrens M, Meyerhof W. 2009. Mammalian bitter taste perception.In:Korsching S, Meyerhof W. Chemosensory Systems in Mammals, Fishes, and Insects. Berlin Heidelberg: Springer, 47: 77-96.
Bhagat S. 2002. "Canis lupus familiaris" (On-line), Animal Diversity Web. Accessed April 09, 2013 at http://animaldiversity.ummz.umich. edu/accounts/Canis_lupus_familiaris/.
Bies L. 2002. "Ailuropoda melanoleuca" (On-line), Animal Diversity Web. Accessed April 09, 2013 at http://animaldiversity.ummz.umich. edu/accounts/Ailuropoda_melanoleuca/.
Chandrashekar J, Mueller KL, Hoon MA, Adler E, Feng LX, Guo W, Zuker CS, Ryba NJP. 2000. T2Rs function as bitter taste receptors.Cell,100(6): 703-711.
Chandrashekar J, Hoon MA, Ryba NJP, Zuker CS. 2006. The receptors and cells for mammalian taste.Nature,444(7117): 288-294.
Conte C, Ebeling M, Marcuz A, Nef P, Andres-Barquin PJ. 2003. Evolutionary relationships of the Tas2r receptor gene families in mouse and human.Physiological Genomics,14(1): 73-82.
Dong D, Jones G, Zhang SY. 2009. Dynamic evolution of bitter taste receptor genes in vertebrates.BMC Evolutionary Biology,9(1): 12.
Duda J. 2003. "Mustela putorius furo" (On-line), Animal Diversity Web. Accessed April 09, 2013 at http://animaldiversity.ummz.umich.edu/ accounts/Mustela_putorius_furo/.
Felsenstein J. 1985. Confidence-limits on phylogenies: an approach using the bootstrap.Evolution,39(4): 783-791.
Garcia J, Hankins WG. 1975. The evolution of bitter and the acquisition of toxiphobia. In: Denton DA, Coghlan JP. Olfaction and Taste V. Proceedings of the 5th International Symposium in Melbourne, Australia. New York: Academic Press, 39-45.
Gautier Z. 2002. "Gallus gallus" (On-line), Animal Diversity Web. Accessed April 09, 2013 at http://animaldiversity.ummz.umich.edu/ accounts/Gallus_gallus/.
Glendinning JI. 1994. Is the bitter rejection response always adaptive?Physiology & Behavior,56(6): 1217-1227.
Go Y, Satta Y, Takenaka O, Takahata N. 2005. Lineage-specific loss of function of bitter taste receptor genes in humans and nonhuman primates.Genetics,170(1): 313-326.
Go Y. 2006. Proceedings of the SMBE Tri-National Young Investigators' Workshop 2005. Lineage-specific expansions and contractions of the bitter taste receptor gene repertoire in vertebrates.Molecular Biology and Evolution,23(5): 964-972.
Gunderson A. 2009. "Ursus maritimus" (On-line), Animal Diversity Web. Accessed April 09, 2013 at http://animaldiversity.ummz.umich. edu/accounts/Ursus_maritimus/.
Jiang PH, Josue J, Li X, Glaser D, Li WH, Brand JG, Margolskee RF, Reed DR, Beauchamp GK. 2012. Major taste loss in carnivorous mammals.Proceedings of the National Academy of the Sciences of the United States of America,109(13): 4956-4961.
Masatoshi N, Sudhir K. 2000. Molecular Evolution and Phylogenetics. New York: Oxford University Press.
Mueller KL, Hoon MA, Erlenbach I, Chandrashekar J, Zuker CS, Ryba NJ. 2005. The receptors and coding logic for bitter taste.Nature,434 (7030): 225-229.
Saitou N, Nei M. 1987. The neighbor-joining method: a new method for reconstructing phylogenetic trees.Molecular Biology and Evolution,4(4): 406-425.
Shi P, Zhang JZ, Yang H, Zhang YP. 2003. Adaptive diversification of bitter taste receptor genes in Mammalian evolution.Molecular Biology and Evolution,20(5): 805-814.
Shi P, Zhang J. 2006. Contrasting modes of evolution between vertebrate sweet/umami receptor genes and bitter receptor genes.Molecular Biology and Evolution,23(2): 292-300.
Tamura K, Peterson D, Peterson N, Stecher G, Nei M, Kumar S. 2011. MEGA5: molecular evolutionary genetics analysis using maximum likelihood, evolutionary distance, and maximum parsimony methods.Molecular Biology and Evolution,28(10): 2731-2739.
Thompson JD, Higgins DG, Gibson TJ. 1994. Clustal-W: Improving the sensitivity of progressive multiple sequence alignment through sequence weighting, position-specific gap penalties and weight matrix choice.Nucleic Acids Research,22(22): 4673-4680.
Yu L, Li QW, Ryder OA, Zhang YP. 2004. Phylogenetic relationships within mammalian order Carnivora indicated by sequences of two nuclear DNA genes.Molecular Phylogenetics and Evolution,33(3): 694-705.
Zhao HB, Zhang JZ. 2012. Mismatches between feeding ecology and taste receptor evolution: an inconvenient truth.Proceedings of the National Academy of Sciences of the United States of America,109(23): E1464; author reply E1465.
10.11813/j.issn.0254-5853.2013.E3.E75
19 March 2013; Accepted: 10 April 2013
s: This work was supported by the Key Project (30930015) and General Project (31271329) from National Natural Science Foundation of China
*Corresponding author, E-mail: ship@mail.kiz.ac.cn
杂志排行
Zoological Research的其它文章
- Bacterial expression and purification of biologically active human TFF2
- 香鱼补体成分C9基因的克隆、序列分析及表达
- A new spider species of the genus Sudharmia from Sumatra, Indonesia (Araneae, Liocranidae)
- Complete mitogenome of the Lesser Purple Emperor Apatura ilia (Lepidoptera: Nymphalidae: Apaturinae) and comparison with other nymphalid butterflies
- Acute lesions of primary visual cortical areas in adult cats inactivate responses of neurons in higher visual cortices
- Cranial morphometric study of four giant flying squirrels (Petaurista) (Rodentia: Sciuridae) from China
