Fe-P体系热力学再优化
2012-12-05曹战民王昆鹏乔芝郁杜广巍
曹战民 王昆鹏 乔芝郁 杜广巍
(北京科技大学,钢铁冶金新技术国家重点实验室,冶金与生态工程学院,北京100083)
Fe-P体系热力学再优化
曹战民*王昆鹏 乔芝郁 杜广巍
(北京科技大学,钢铁冶金新技术国家重点实验室,冶金与生态工程学院,北京100083)
基于最新的实验热力学数据和相图数据,采用CALPHAD技术对Fe-P体系进行热力学再优化.其中,溶液相(液相、α-Fe和γ-Fe)的Gibbs自由能用替换溶液模型描述,其余化合物(Fe3P、Fe2P、FeP、FeP2和FeP4)看作严格计量比化合物.整个优化过程在Thermo-Calc®软件包中完成,优化所得热力学数据和相图信息与实验信息吻合较好,为Fe基合金和含P多元合金体系的进一步优化提供了一组自洽可靠的热力学参数.
Fe-P体系;CALPHAD技术;相图;热力学优化
1 Introduction
Fe-P is a fundamental binary system of the Fe-based and P-containing multicomponent alloys,which are of great importance for the advanced metallurgy and materials,such as stainless steel,ultra-pure steel refining,and materials design and processing.From thermodynamic point of view,the best optimized parameters of the Fe-P binary system are a quite important basis for thermodynamic optimization of the Fe-based and P-containing multicomponent systems.Also,thermodynamic data of the Fe-P system with strong interactions advance a better understanding of the nature of chemical bonding and interaction mechanism.As pointed out by Okamoto1in a critical assessment of the Fe-P system,the assessed Fe-P phase diagram was accepted primarily from Kubaschewski2in 1982.Recently, Ohtani et al.3in 2006 and Tokunaga et al.4in 2009 evaluated thermodynamic parameters and calculated phase diagram of the Fe-P system in the thermodynamic analysis of the Fe-Ti-P and Fe-Nb-P systems,respectively.But,in both evaluations the valuable thermodynamic properties in the Fe-P system measured by Zaitsev et al.5using differential scanning calorimetry and Knudsen effusion method with mass-spectrometric analysis of the gaseous phase were omitted.In order to obtain a set of self-consistent and reliable thermodynamic description for this binary system,it is necessary to reoptimize the Fe-P system with all available thermodynamic and phase equilibria data using CALPHAD approach6,7and Thermo-Calc®software package.8
2 Experimental phase diagram data
Due to the practical and theoretical importance many authors investigated the phase equilibria of the Fe-P system. Saklatwalla9firstly published the phase relationship of the Fe-P(0%-24%P,mass fraction)system.Then,Konstantinow10and Haughton11measured the phase diagram of the Fe-P system up to 24%P and 32%P,respectively,and showed the existence of liquid(L)phase and α-Fe,γ-Fe,Fe3P,Fe2P,FeP phases.The solubility of P in γ-Fe was measured by several investigators,including Vogel12and Roquet et al.13using metallography as well as Lorenz14and Fisher15et al.using magnetic measurements,respectively.The assessed maximum solubility of P in γ-Fe is ca 0.56%at 1423 K.2,12The liquidus and solidus of α-Fe were measured by many researchers.9,11,16-19The quantitative values of solid solubility of P in α-Fe were obtained by using metallography,11,12,17,20X-ray analysis,21,22precipitation hardening,23lattice parameter measurements,24electron probe analysis,25microprobe and micro-hardness tests,26and X-ray microanalyzer.27The experimental results obtained from different investigators established that three invariant reactions exist in the Fe-P system,i.e.,L⇌α-Fe+Fe3P,L+Fe2P⇌Fe3P,and L⇌Fe2P+ FeP.But,as shown in Table 1 there are small differences for the temperature and composition of the invariant points.Franke et al.,28Meisel,29and Heimbrecht et al.30revealed the existence of FeP2by use of density and X-ray diffraction measurements. Holseth et al.31measured the maximum homogeneity range of FeP2from 65.6%P to 66.9%P and from 66.2%P to 67.1%P, respectively.Jeitschko et al.32synthesized monoclinic FeP4from the elements at 927 to 627°C using iodine as a catalyst and tin as a flux.Up to now,no experimental information about the phase relationship of the Fe-P(0%to 100%P)system was reported.
3 Experimental thermodynamic property data
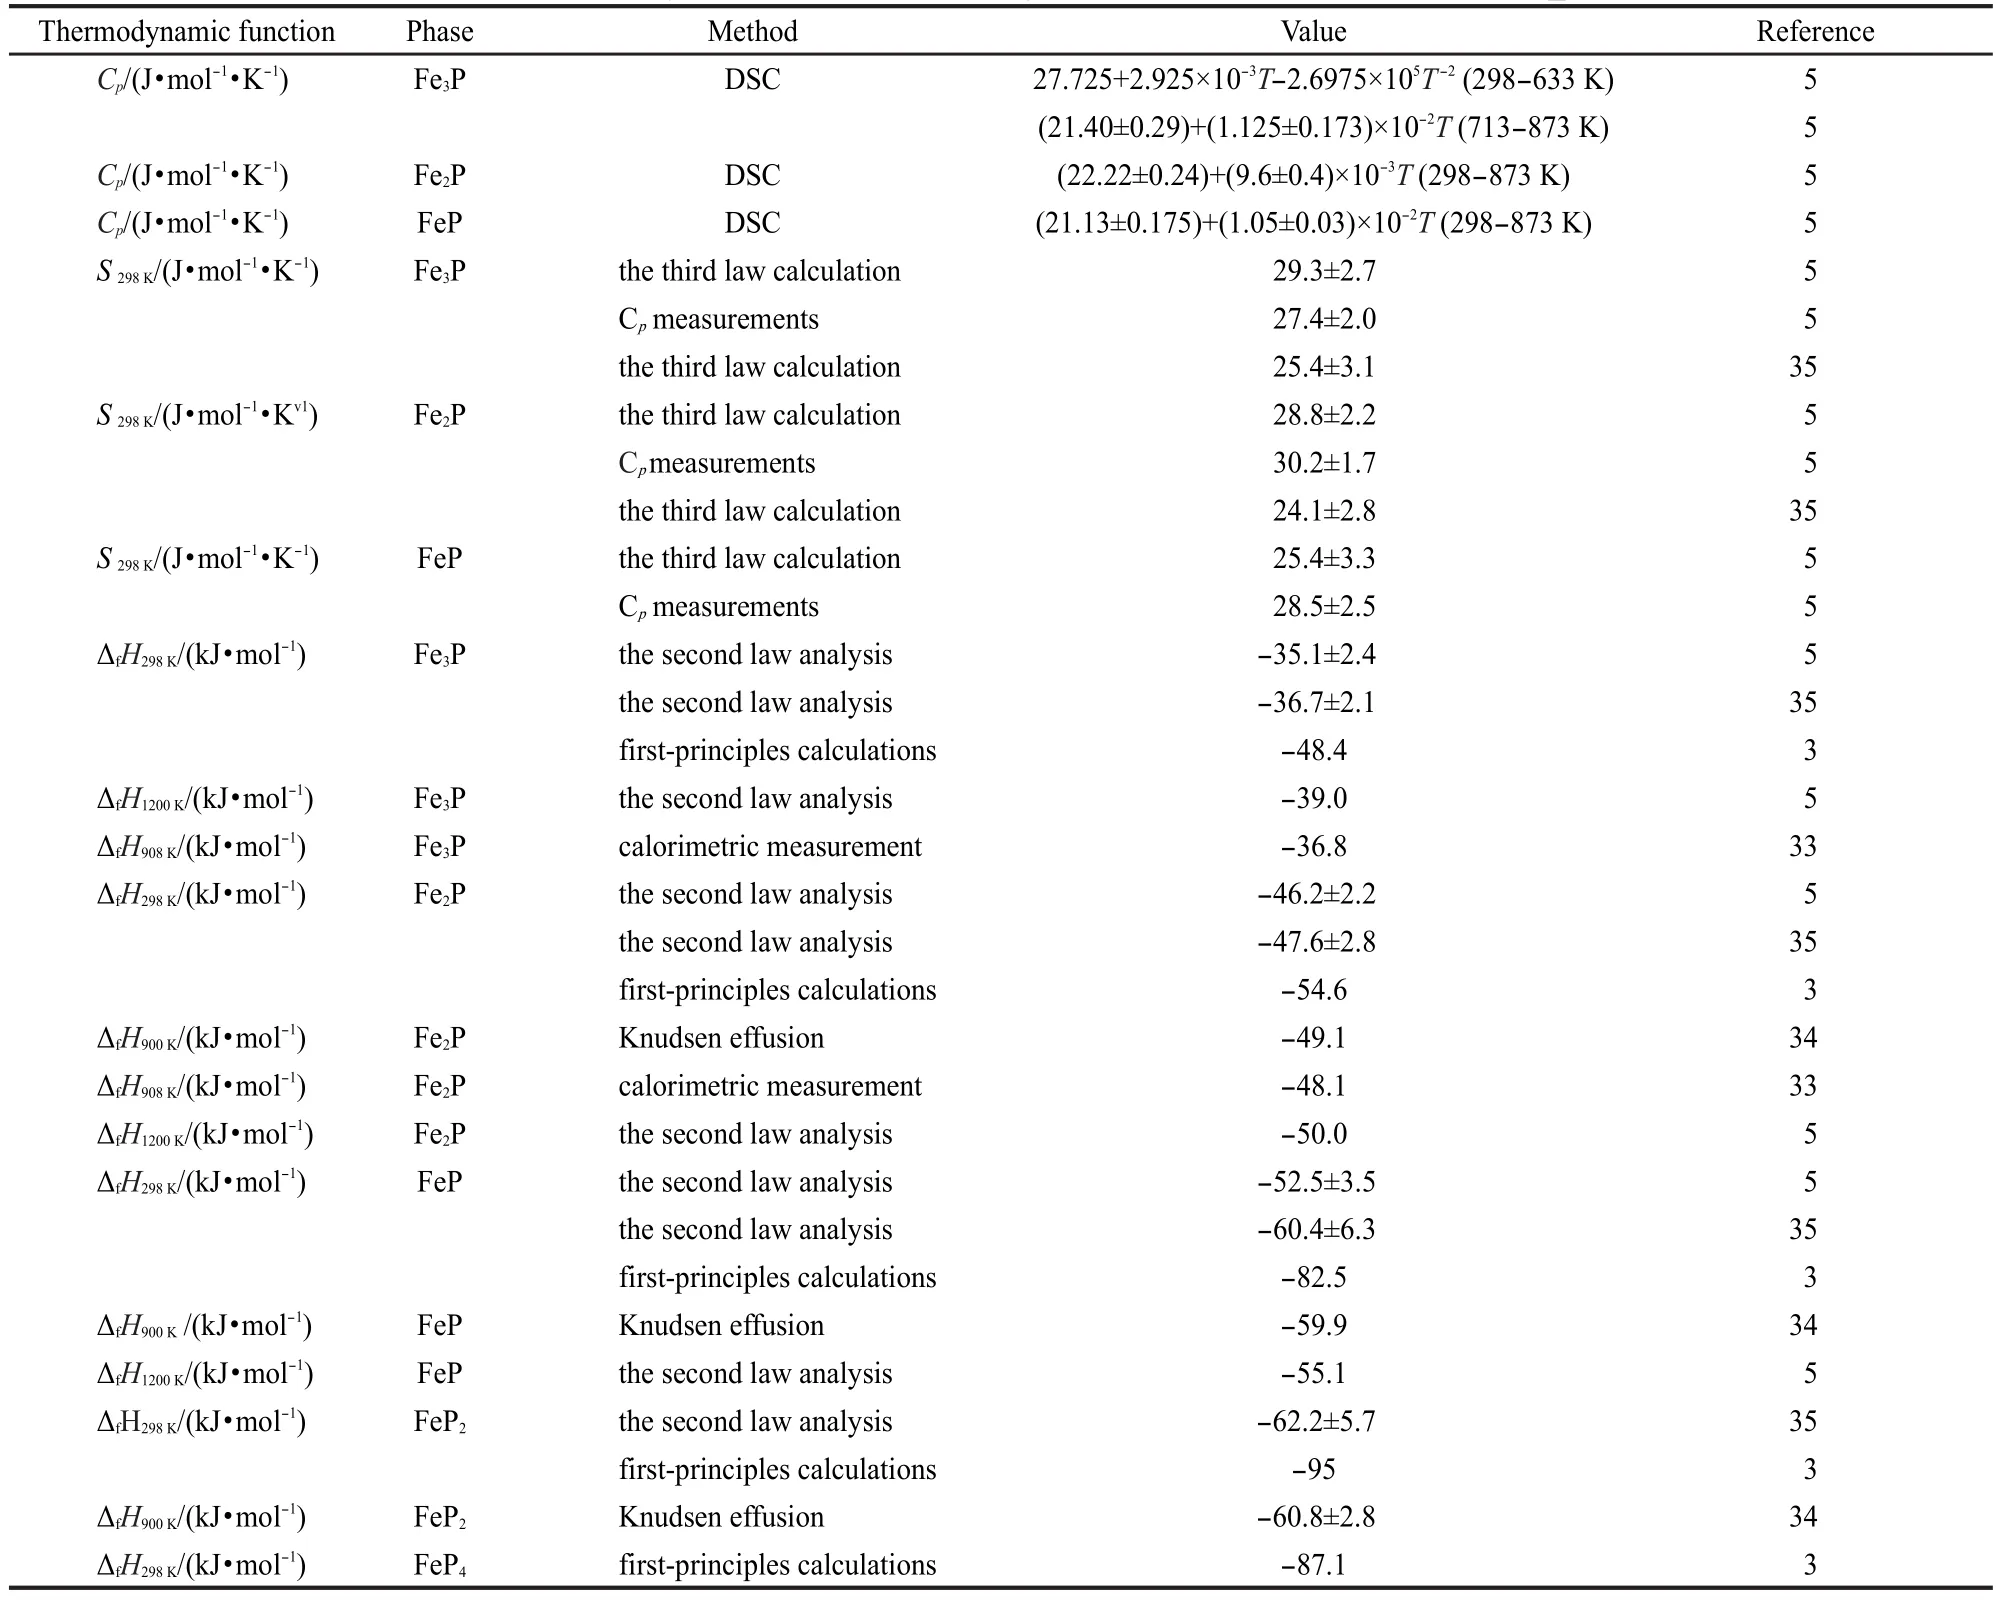
Weibke et al.33experimentally measured the formation enthalpies(ΔfH)of Fe3P and Fe2P at 908 K by using an adiabatic calorimeter as well as Lewis et al.34calculated formation enthalpies of Fe2P,FeP,FeP2at 900 K from their temperature dependences of the dissociation pressures measured by Knudsen effusion method.Based on the available thermodynamic and phase equilibria data,Spencer et al.35evaluated the thermodynamic properties of Fe3P,Fe2P,FeP,and FeP2,including heat capacity(Cp),mixing enthalpy(ΔmixH),formation entropy(ΔfS), formation enthalpy(ΔfH),and Gibbs energy of formation (ΔfG).As mentioned,Zaitsev et al.5measured the heat capacities of iron phosphides Fe3P,Fe2P,and FeP in the temperature range of 113-873 K and investigated the thermodynamic properties of iron phosphides(1041-1549 K),bcc solid solution Fe-P(1384-1619 K),and Fe-P liquid alloys(1349-1811 K) by means of Knudsen effusion method with mass-spectrometric analysis of the gaseous phase.Then,based on the experimentally measured results and the second and third thermodynamic laws,ΔfG-T relationships of the Fe3P,Fe2P,and FeP at 1230-1530 K,ΔfH,ΔfS,and S⇌(absolute entropy)at 298 K,as well as activities of P in liquid phase and in α-Fe were determined.Little experimental thermodynamic data of FeP2and FeP4and phase relation information concerning the Fe-P (50%-100%)system existed in literature due to high volatility of phosphorus at elevated temperature.Therefore,the calculated formation enthalpies of FeP2and FeP4in the Fe-P system at 298 K by first-principles method3were used as initial values in the present optimization.All thermodynamic data used in the present optimization are summarized in Table 2.
4 Thermodynamic models and optimization
4.1 Reference states
As reference states for the investigated system,the pure solid elements in their stable states at 298.15 K and 105Pa(stable element reference,SER)were chosen.The Gibbs energy of the element i with Φ phase appears in the following form:

4.2 Stoichiometric intermetallic compounds
In the Fe-P system intermetallic compounds Fe3P,FeP,and FeP4belong to the stoichiometric phases.Even small solubility of P in Fe2P and FeP2was reported,31,37Fe2P and FeP2were also approximately treated as intermetallic compounds.The Gibbs energy per mole Fe3P,Fe2P,and FeP is given as:

where Cpis isobaric molar heat capacity,the coefficients of a and b will be optimized usingas initial values. The measured values of Cpreported by Zaitsev et al.5were also used in the present optimization.
The Gibbs energy per mole FeP2and FeP4can be expressed as follows:


Table 1 Invariant reactions of the Fe-Psystem

where the parameters a and bwere to be evaluated in the present work.
4.3 Solution phases
There are three solution phases in the Fe-P system,i.e.,liquid phase,bcc(α-Fe),and fcc(γ-Fe).The Gibbs energy of the solution phase in the Fe-P system is described as follows:


where Li(i=0,1,2,…)are the i-order interaction parameters of liquid phase in the Fe-P system and are expressed as temperature dependent terms as follows:

Table 2 Thermodynamic data in the Fe-Psystem(reference states:α-Fe and red_P)

Table 3 Lattice stability parameters used in the present optimization

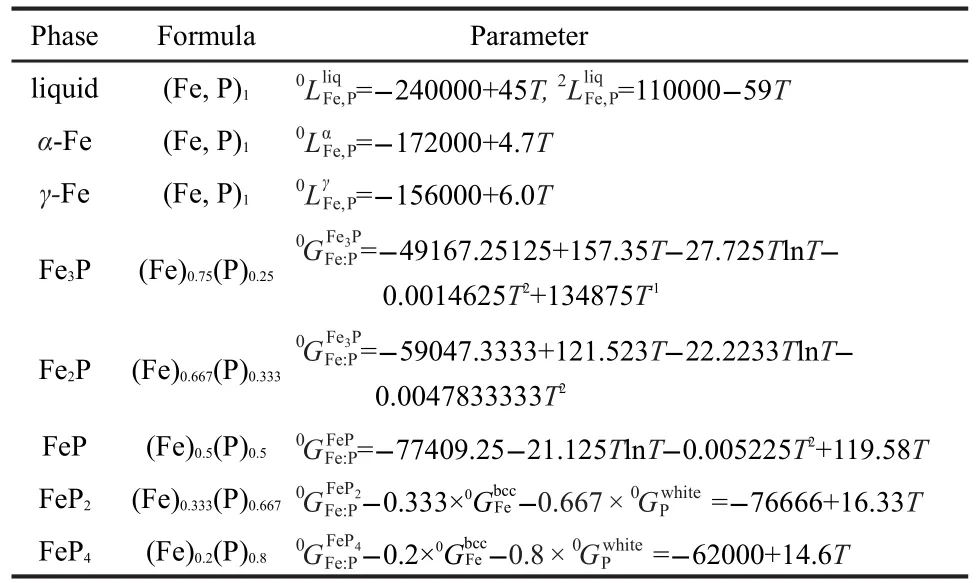
Table 4 Optimized thermodynamic parameters of the Fe-Psystem

where ai,bi,and ciare model parameters to be optimized based on the experimental data in this study.
5 Optimization procedure and results
Based on the lattice stability parameters of Fe and P in Table 3 cited from references36as well as the experimental phase diagram and thermodynamic property data summarized in Tables 1 and 2,all the values of the model parameters for the phases in this system were optimized by use of the PARROT module,which works by minimizing the square sum of the differences between the experimental data and calculated values, in the Thermo-Calc®software package developed by Sundman et al.8In the optimization procedure,each selected experimental value has been given a weight according to the reliability and compatibility of the experimental data.The weight can be changed to achieve a satisfactory description of most of the experimental data.The optimized thermodynamic parameters for all condensed phases in the Fe-P system are summarized in Table 4.The calculated temperatures and compositions of all invariant reactions in this system are compared with the experimental data in Table 1.

Fig.1 Fe-Pphase diagram calculated by the present thermodynamic description with the experimental data

Fig.2 Calculated standard formation enthalpy at 298 K(a) and 900 K(b)in the Fe-Psystem and comparison with the literature data
As shown in Fig.1 and Table 1,Schürmannʹs experimental result19of the reaction L⇌α-Fe+Fe3P are lower than othersʹ. Haughton11pointed that in the low-phosphorous alloys under-cooling of the eutectic was very marked,and this may account for the extraordinary shape given to the eutectic line by Schurmann.19Therefore,the calculated liquidus and solidus as well as temperatures and compositions of all invariant reactions in the Fe-P(0%-50%P)system agree well with the experimental data,especially reported in some references11,18,26,27and the previous results assessed by Okamoto1and Ohtani et al.3As the part of Fe-P(50%-100%P),there is no experimental information compared with calculated phase diagram.But, if compared the present calculated phase diagram with the previous assessed one,3the former is a little more reasonable than the latter.

Fig.3 Calculated mixing enthalpy of liquid at 1809 K in the Fe-Psystem with the literature data

Fig.4 Calculated heat capacity of Fe3P(a),Fe2P(b),and FeP(c)with the literature data

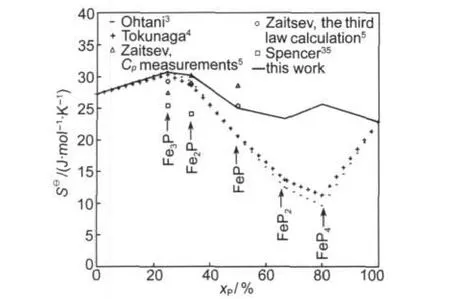
Fig.5 Calculated absolute entropy in the Fe-Psystem with the literature data
Fig.2 compares the calculated values of formation enthalpies of the Fe-P system at 298 and 900 K in this study with the literature data.Obviously,the present calculated values are in good agreement with measured5and evaluated35data at 298 K as well as with measured data at 900 K.33,34However,the values evaluated by Ohtani et al.3and Tokunaga et al.4and predicted using first-principles calculations3are more negative than the experimental measured data.5
Fig.3 presents the calculated ΔmixH of liquid Fe-P system at 1809 K compared with the experimental data.3,4,35It is clear that the present calculated values agree well with evaluated data by Spencer et al.35
It can be seen from Fig.4 and Fig.5 that agreement between present calculated heat capacities and absolute entropies of Fe3P,Fe2P,and FeP with measured data5is better than the one between previous evaluated data3,4with measured data.5
6 Conclusions
Based on all available experimentally measured thermodynamic properties and phase diagram data,the Fe-P system, which is a significant binary one of the Fe-based and P-containing multicomponent alloys,was reoptimized by CALPHAD approach and Thermo-Calc®software package.The agreement between the optimized Fe-P(0%-50%P)phase diagram and experimentally measured data is good enough.The calculated Fe-P(50%-100%P)phase diagram is a little more reasonable than previously assessed one.The comparison of calculated formation entropies of the Fe-P system at 298 and 900 K,calculated mixing entropies of the Fe-P system at 1809 K as well as calculated heat capacities of Fe3P,Fe2P,and FeP in this study with the measured data available from literature remains fairly good.An obtained thermodynamic description with self-consistency describing all the phases in the Fe-P system is better than that of the previous assessment.
(1) Okamoto,H.Bulletin of Alloy Phase Diagrams 1990,11,404.
(2) Kubaschewski,O.Iron-Binary Phase Diagrams; Springer-Verlag:Berlin,1982;pp 84-86.
(3)Ohtani,H.;Hanaya,N.;Hasebe,M.;Teraoka,S.;Abe,M. CALPHAD 2006,30,147.
(4)Tokunaga,T.;Hanaya,N.;Ohtani,H.;Hasebe,M.ISIJ International 2009,49,947.
(5) Zaitsev,A.I.;Dobrokhotova,Z.V.;Litvina,A.D.;Mogutnov, B.M.J.Chem.Soc.Faraday Trans.1995,91,703.
(6) Kaufman,L.;Bernstein,H.Computer Calculation of Phase Diagrams;Academic Press:New York,1970.
(7)Saunders,N.;Modwnik,A.P.CALPHAD-a Comprehensive Guide;Pergamon,Lausanne:Switzerland,1998.
(8)Sundman,B.;Jansson,B.;Anderson,J.O.CALPHAD 1985,9, 153.
(9) Saklatwalla,B.J.Iron Steel Inst.1908,77,92.
(10) Konstantinow,N.Z.Anorg.Chem.1910,66,209.
(11) Haughton,J.L.J.Iron Steel Inst.1927,115,417.
(12) Vogel,R.Arch.Eisenhüttenwes.1929-1930,3,369.
(13) Roquet,P.;Jegaden,G.Rev.Metall.1951,48,712.
(14) Lorenz,K.;Frabritius,H.Arch.Eisenhüttenwes.1962,33,269.
(15) Fisher,W.A.;Lorenz,K.;Fabritius,H.;Hoffmann,A.;Kalwa, G.Arch.Eisenhüttenwes.1966,37,79.
(16) Gercke,E.Metallurgie 1908,5,604.
(17)Hanemann,H.;Voss,H.Zentr.Hutten.Walzwerke 1927,31,245.
(18) Wachtel,E.;Urbain,G.;Ubelacker,E.Compt.Rend.1963,257, 2470.
(19) Schürmann,E.;Kaiser,H.P.;Hensgen,U.Arch. Eisenhüttenwes.1981,52,51.
(20) Kaneko,H.;Nishizawa,T.;Tamaki,K.;Tanifuji,A.Nippon Kinzoku Gakkai-Shi 1965,29,166.
(21) Kreutzer,C.Z.Phys.1928,48,556.
(22) Oberhoffer,P.;Kreutzer,C.Arch.Eisenhüttenwes.1929,2,449.
(23) Yensen,T.D.Trans.Am.Inst.Elec.Eng.1924,43,145.
(24) Svechnikov,V.N.;Pan,V.M.Phys.Met.Metallogr.1958,6,80.
(25) Doan,A.S.,Jr.;Goldstein,J.I.Metall.Trans.1970,1,1759.
(26) Hofman,H.P.;Lohberg,K.;Reif,W.Arch.Eisenhüttenwes. 1970,41,975.
(27) Ko,M.;Nishizawa,T.J.Jpn.Inst.Met.1979,43,118.
(28) Franke,W.;Meisel,K.;Juza,R.Z.Anorg.Chem.1934,218,346.
(29) Meisel,K.Z.Anorg.Chem.1934,218,360.
(30)Heimbrecht,M.;Biltz,W.Z.Anorg.Chem.1939,242,233.
(31) Holseth,H.;Kjekshus,A.Acta Chemica Scandinavica 1968,22, 3273.
(32) Jeitschko,W.;Braun,D.J.Acta Crystallogr.B 1978,34,3196.
(33) Weibke,F.;Schrag,G.Elektrochemische Kinetik 1941,47,222.
(34)Lewis,G.;Myers,C.E.J.Phys.Chem.1963,67,1289.
(35) Spencer,P.;Kubaschewski,O.A.Arch.Eisenhüttenwes.1978, 49,225.
(36)Dinsdale,A.T.CALPHAD 1991,15,317.
(37) Carsson,B.;Golin,M.;Rundqvist,S.J.Solid State Chem.1973, 8,57.
(38) Redlich,O.;Kister,A.T.Ind.Eng.Chem.1948,40,345.
October 8,2011;Revised:November 14,2011;Published on Web:November 17,2011.
Thermodynamic Reoptimization of the Fe-P System
CAO Zhan-Min*WANG Kun-Peng QIAO Zhi-Yu DU Guang-Wei
(State Key Laboratory of Advanced Metallurgy,School of Metallurgical and Ecological Engineering, University of Science&Technology Beijing,Beijing 100083,P.R.China)
The Fe-P binary system was reoptimized by means of the CALPHAD approach.The Gibbs energy descriptions of every phase in the Fe-P binary system were optimized based on the latest experimental thermodynamic and phase diagram data.The solution phase(liquid,α-Fe,and γ-Fe)was described by the substitutional solution approximation and the other phases(Fe3P,Fe2P,FeP,FeP2,and FeP4)were treated as the stoichiometric compounds.The optimization was carried out using the Thermo-Calc®software package.The agreement of the optimized phase diagram and thermodynamic data with experimental results is good,and a self-consistent and reliable thermodynamic dataset is obtained to allow further optimization of Fe-based,P-containing multicomponent alloy systems.
Fe-P system;CALPHAD approach;Phase diagram;Thermodynamic optimization
10.3866/PKU.WHXB201111172www.whxb.pku.edu.cn
*Corresponding author.Email:zmcao@ustb.edu.cn;Tel:+86-13671040866.
The project was supported by the National Natural Science Foundation of China(50934011).
国家自然科学基金(50934011)资助项目
O642
