Adsorptive Removal of Para-chlorophenol Using Stratified Tapered Activated Carbon Column
2012-10-31SzeandMcKay
M.F.F. Sze and G. McKay*
Department of Chemical and Biomolecular Engineering, the Hong Kong University of Science and Technology,Hong Kong, China
Adsorptive Removal of Para-chlorophenol Using Stratified Tapered Activated Carbon Column
M.F.F. Sze and G. McKay*
Department of Chemical and Biomolecular Engineering, the Hong Kong University of Science and Technology,Hong Kong, China
The feasibility of adsorptive removal of single component organic compound (para-chlorophenol) by Calgon Filtrasorb 400 (F400) carbon was investigated. The Redlich-Peterson equation was found to be the best fit model for describing the equilibrium relationship between the para-chlorophenol adsorption onto F400 carbon. Four adsorption columns with different column geometry and adsorbent particle stratification were used to examine the adsorption kinetics onto F400 carbons. The Bed Depth Service Time (BDST) model was applied and modified to analyse the performance of the columns and the effect of different operating variables. When combining the effects of adsorption efficiency and the associated pressure drop of each type of adsorption columns tested, the carbon stratified tapered column has been determined to be the most efficient engineering option for removing organics, in which the enhancement of the adsorbent bed in terms of longer breakthrough time and higher saturation percentage is the greatest amongst the four types of columns with reasonably small pressure drop across the fixed-bed column.
adsorption, para-chlorophenol, activated carbon, tapered column, bed depth service time model, pressure drop
1 INTRODUCTION
1.1 Application and toxicity of chlorophenol
Chlorophenols (a total of 19 congeners exist) are a large category of chemicals with chlorine atoms(between one and five) attached to the phenolic structure.They are normally used in herbicides [1], insecticides [2],wood preservatives and industries as synthesis intermediates or as raw materials in the manufacturing of pharmaceuticals and dyes [3]. According to Pera-Titus et al. [3], the world market of chlorophenols is fairly stable and is ca. 100 kilo-tones per year, in which the production of heavy and light chlorophenols is ca.25-30 and 60 kilo-tones per year respectively.
Not only because of the taste and odour problems even at concentrations below 0.1 μg·L−1[4], chlorophenols cause severe adverse effects such as toxicity,carcinogenicity [5, 6] and degradation of the water quality for consumptive use. Some phenolic compounds are listed as a group of toxic pollutants by the US Environmental Protection Agency (USEPA) [7]and by the European Decision 2455/2001/EC [8].
1.2 Adsorptive removal of chlorophenol
In the past few years, more researches have focused on the development of modified activated carbon to enhance the adsorption effectiveness (adsorption capacity and kinetic) towards organic adsorbates,for example, Przepiórski [9] reported the enhanced adsorption of phenol from water by ammonia-treated activated carbon. However, just a few researches focused on the enhancement of efficiency and utilisation for the adsorption process when used in industrial scale.Hence one of the main objectives of this research is to explore this aspect in depth.
1.3 Fixed-bed adsorption column
Fixed-bed carbon adsorption columns are commonly used in industrial wastewater treatment systems.Industrial effluents flow through a vertical column packing with activated carbons at a constant rate which adsorb organics onto the highly porous surface. Once the column operation commenced, the carbon bed eventually lost its function and the effluent concentration from the column approached that of the influent,indicating that the column is breakthrough and carbon is spent. However, as to fulfil the stringent legislation set for water pollution standards, adsorption column would never operate until the full saturation of the carbon bed. The column operation would be stopped prior to a point—breakthrough point (where the exit concentration of the solutes being removed starts to increase sharply to some predetermined level [10]),which is the maximum tolerance limit of the standards,the continuous operation of carbon adsorption column after this point would not meet the legislative standards.
The adsorption column process is terminated upon reaching its breakthrough capacity, but the whole adsorbent bed is not completely loaded, especially the adsorbent at the outlet of the column. This inefficient use of adsorbent will lead to the high inventory of adsorbent and hence increase the operating cost. Hence the principal focus of this research is to enhance theadsorbent bed utilisation, which may lengthen the adsorbent bed service time and reduce the adsorbent regeneration frequency.
1.4 Cylindrical column and tapered column operation
The conventional cylindrical fixed-bed column is commonly used in industries. Basmadjian [11] proposed a reverse stratified tapered adsorber (RSTA)with varying cross-sectional area and different adsorbent particles arranged in a reverse layering of adsorbent size. This bed geometry provides a unique superficial velocity profile for the adsorbate solution,which influences the residence time of adsorbate and the extent of the external mass transfer film thickness around the adsorbent particles.
1.5 Stratification of adsorbent particle in fixed-bed column
It is advantageous to use finer adsorbent particles in packed bed adsorption column, however the excessive pressure drop associated hinders its feasibility.With a particle arrangement, powdered particles could be used as a portion in adsorbent bed, without increasing the pump power tremendously. Mathews [12]and Pota and Mathews [13] both demonstrated that adsorption columns with particle layering/stratification perform better than columns using uniform particle size.
2 THEORY
2.1 Equilibrium isotherm modelling
2.1.1 Langmuir model
The Langmuir [14] isotherm model is written as
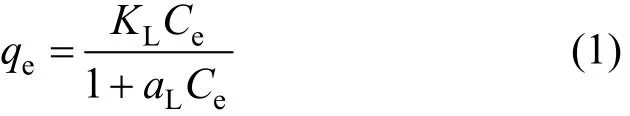
where qeis the amount of adsorbate being adsorbed per adsorbent mass at equilibrium, Ceis the equilibrium liquid phase adsorbate concentration.
The ratio of KL/aL(qm) accounts for the maximum adsorption capacity defined by Langmuir isotherm, and is also called the monolayer adsorption capacity.
2.1.2 Freundlich Model
Freundlich [15] proposed the adsorption equilibrium data could be described by the following relationship

where KFand 1/nFare characteristic constants.
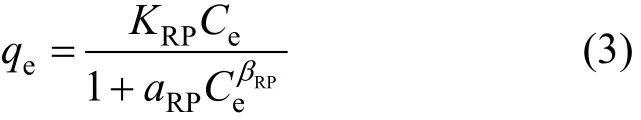
2.1.3 Redlich-Peterson model
The Redlich-Peterson isotherm is a three-parameter isotherm proposed by Redlich and Peterson [16]:
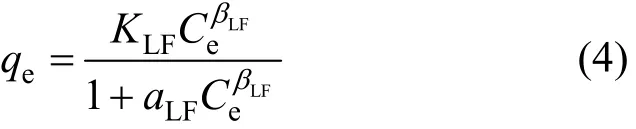
2.1.4 Sips model
The Sips isotherm [17] is a combination of Langmuir and Freundlich isotherms and is given as:
2.2 Adsorption column modelling
Bed depth service time model
Bohart and Adams [18] developed an equation describing the relationship between service time (t)and bed height (Z) for a fixed-bed adsorber. The Bed Depth Service Time (BDST) model has been successfully applied for para-chlorophenol adsorption [19, 20]onto activated carbon. The BDST method can be used to predict the effects of different feed concentrations,flowrates or effluent compositions to the operation for fixed-bed column [21]. The traditional BDST model has not yet been applied for tapered adsorption columns, either with uniform particle size packing or stratification of particle size packing, in literature.Besides, the effect of the adsorbent particle size has not been incorporated in the model and hence could not be investigated.
In the BDST model, the service time and bed height are correlated with the process parameters (N0and k) and initial feed concentration, feed volumetric flowrate and effluent composition.
The adsorption capacity of a fixed amount of adsorbents diminishes at a rate given as:
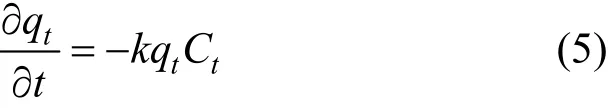
where k is the rate constant of adsorption.
The solute concentration is diminishing at a rate as:
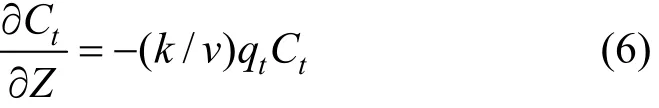
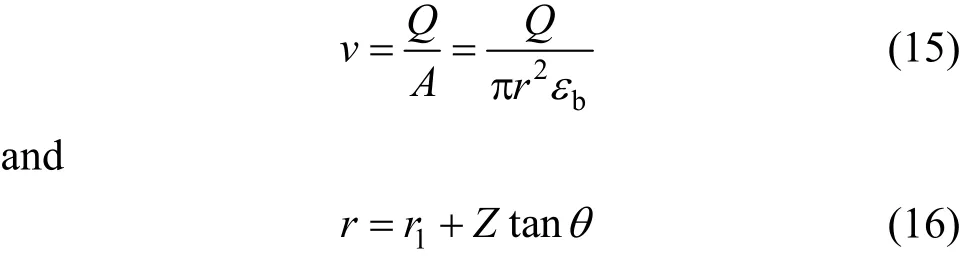
where v is the solute velocity.
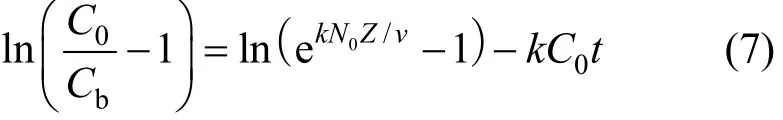
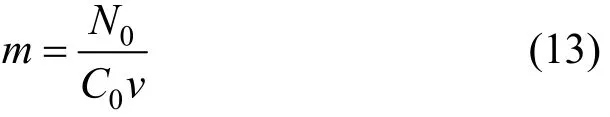
As the volumetric sorption capacity of the bed is given as Noqe, and by integrating Eqs. (5) and (6),the proposed relationship between bed depth and service time would become Eq. (7).
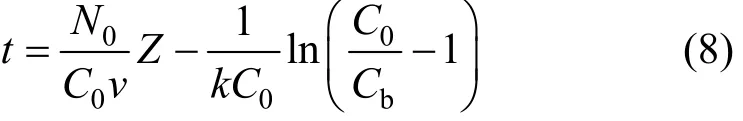
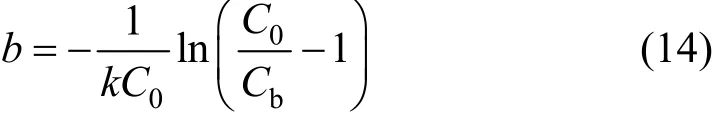
The service time was related to adsorption operating conditions as:
where Cbis the adsorbate concentration at breakthrough and N0is the adsorption capacity of bed (bed capacity), k is the BDST adsorption rate constant, v is the interstitial velocity of adsorbate and C0is the initial adsorbate concentration.
As the exponent term kN0Z/v is usually largerthan unity, hence Hutchins [21] proposed a linear relationship to this equation gives:

Table 1 Textural properties of F400 activated carbon
where t represents the breakthrough time at the bed depth Z reaching the breakthrough concentration Cb.The service time and bed height are correlated with the process parameters (N0and k) and initial pollutant concentration and volumetric flowrate of pollutant.
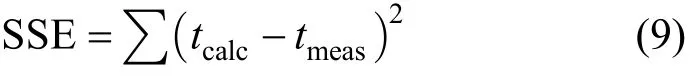
The N0and k are optimised from Eq. (7) or Eq. (8)by minimising the SSE (sum of squared error) function between the experimental data and BDST model predicted values,
Service time is referring to the time utilised by the adsorption column to reach the breakthrough point with a specific saturation percentage. The principal objective of fixed-bed adsorption column operation is to purify industrial effluents so that the effluent concentration is well below a predefined breakthrough value (Cb), in order to fulfil the legislation. Hence, the incipient 10%, 20% and 30% breakthrough percentage are selected and used in the BDST modelling for para-chlorophenol/F400 carbon systems.
3 EXPERIMENTAL MATERIALS AND METHODOLOGY
3.1 Materials
3.1.1 Adsorbent
The commercial Calgon Filtrasorb 400 (F400)activated carbon was purchased from the Calgon Carbon Corporation and was selected as the adsorbent for this research, because it is one of the most widely used adsorbents for water treatment. The virgin F400 carbons were crushed by a hammer mill, sieved and divided into different portions with specific particle size ranges, namely 125-150, 150-250, 250-355, 355-500,500-710 and 710-1000 μm. Each sieved portion was washed using deionised water, and was then dried thoroughly in an oven at 105 °C and stored individually in airtight containers to minimise the adsorption of volatile organic compounds and moisture.
3.1.2 Adsorbates
Para-chlorophenol (p-CP) with purity greater than 99% was purchased from the Aldrich Chemical.It was used as the single component adsorbate in this research. The molecular structure of p-CP (created by the ChemSketch software) is shown in Fig. 1. Table 2 shows some physical properties of the p-CP.
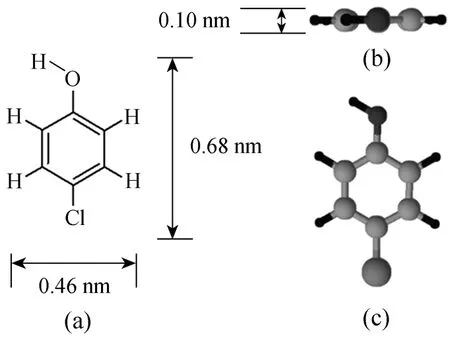
Figure 1 Molecular structure of para-chlorophenol: (a)general structure; (b) and (c) spatial arrangements of the atoms in space showing the length, width and height of the molecule
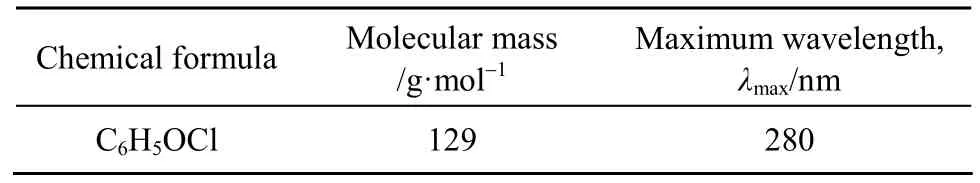
Table 2 Physical properties of para-chlorophenol
3.2 Experimental setup and procedures
3.2.1 Equilibrium adsorption isotherm studies
A stock solution with a concentration of 250 mg·dm−3was prepared. A specific amount of adsorbate was weighed and added into a 2 dm3volumetric flask, deionised water was then added until the meniscus reached the graduated mark. This stock solution was used as a root for preparing a series of standard solutions with equal volume of 0.25 dm3. The concentrations of standard solutions and corresponding volumes of stock solution required in the isotherm study are shown in Table 3.
A series of fixed volume (0.05 dm3) of standard solutions with known initial adsorbate concentrations were prepared and then pipetted to glass bottles,which contained 0.05 g of F400 carbon with respective particle size. The bottles were then sealed and agitated at a constant shaking rate of 200 r·min−1in a thermostatic shaker for 21 days to reach equilibrium.Afterwards, each sample was analysed using the Varian Cary 1E UV/Vis-spectrophotometer.
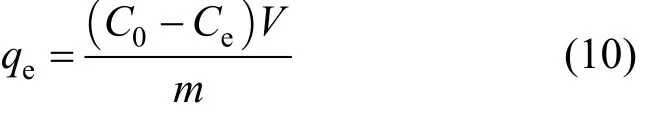
Considering the mass balance on the adsorbents, theamount of adsorbate adsorbed, qe, can be calculated as:where C0and Ceare the initial and equilibrium adsorbate concentrations in solution respectively, V is the volume of the aqueous solution and m is the mass of dried F400 activated carbon.
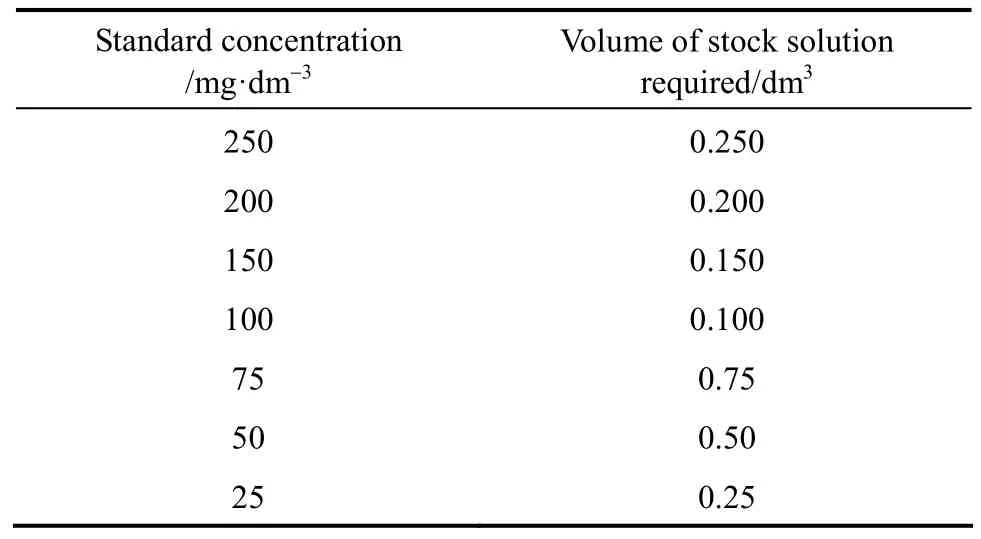
Table 3 Volume of stock solution required for each standard solution
3.2.2 Fixed-bed adsorption column studies
A pilot-scale adsorption column rig was constructed to carry out fixed-bed adsorption column studies. The schematic diagram for the adsorption column rig is shown in Fig. 2.
The deionised water used was from the main supply and it was fed into a 50 dm3plastic container(T1). The deionised water then flowed into a similar tank (T2) by gravity feed. A known amount of adsorbate was added to this batch of 50 dm3of water and the solution was pumped into another bigger tank (T3).The pumps used (P1 and P2) and all the components which came into contact with process solution were made of inert plastic materials. The overflow solution was fed back into (T2) and this served to maintain constant agitation of the solutions.
Samples were taken from a sampling point (S1)as well as from sampling point (S2) to record the initial value of pollutant concentration used in each experimental run. Influent to the adsorber columns was pumped via (P2) and a three-way valve (V6) served to control the recycle feedback to the tank (T3). Calibrated rotameters (F1) were used to control the adsorbate flowrate through the columns (C1). Finally, the effluent was collected in a waste disposal container which is designated for handling all kinds of final effluents.
Rotameters (F1) were calibrated to give the correct flowrate and were maintained constant throughout each experimental run. At time zero, a step input in the adsorbate concentration was introduced to the flowing stream. Samples were taken at selected time interval until the adsorbate concentration was at the breakthrough point at the top of the bed. The samples were taken at various bed heights and were measured using the Varian Cary 1E UV/Vis-spectrophotometer.
3.2.3 Classification of adsorption columns investigated
Four types of fixed-bed adsorption columns with different column geometry and different carbon particle size packing are used to study the dynamic adsorption of para-chlorophenol onto F400 activated carbons under various operating conditions. Fig. 3 illustrates these four types of fixed-bed adsorption columns, namely,
Type 1—cylindrical column with uniform particle size packing;
Type 2—tapered column with uniform particle size packing;
Type 3—cylindrical column with particle stratification packing; and
Type 4—tapered column with particle stratification packing.
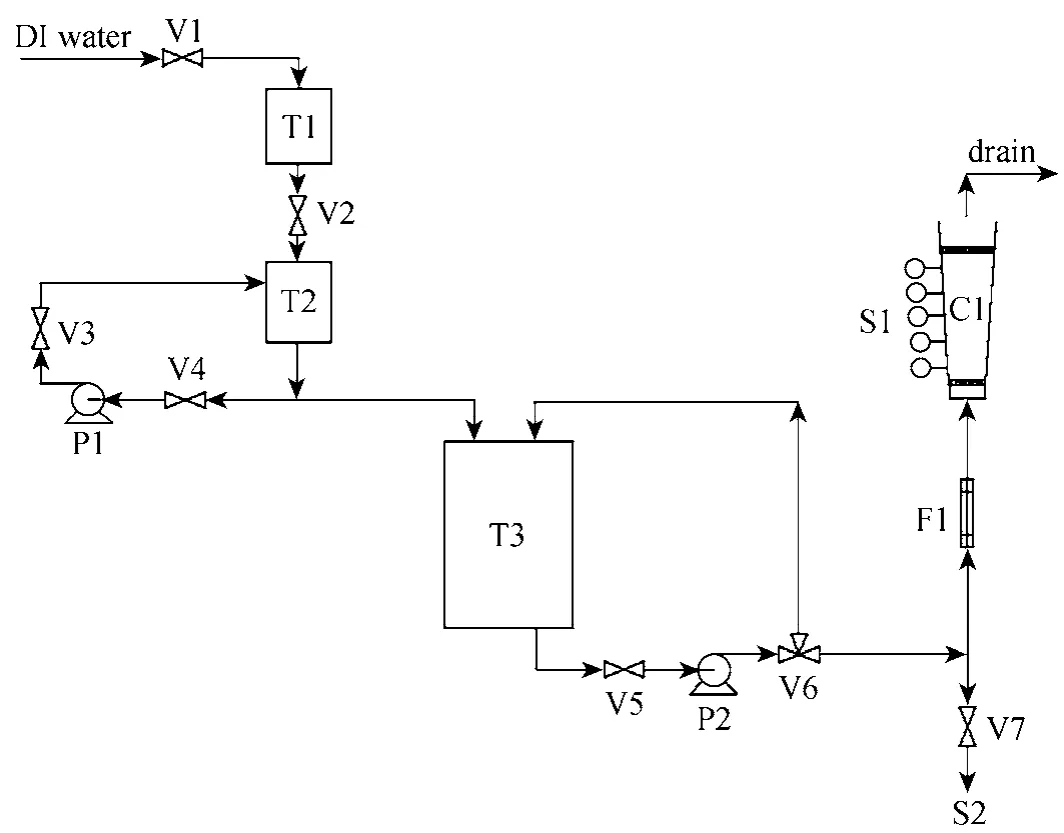
Figure 2 Schematic diagram of pilot plant adsorption column rig
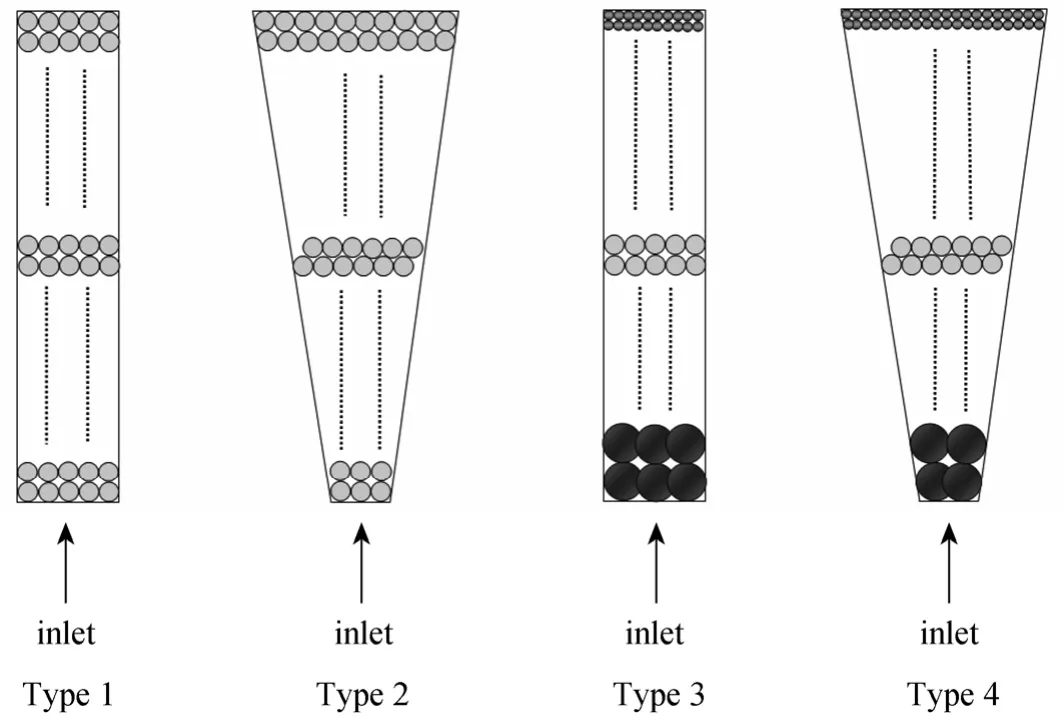
Figure 3 Classifications of adsorption columns investigated
F400 carbons with a single particle size range of 500-710 μm are used in Types 1 and 2 columns. Since only one particle size is involved, the packing density(bulk bed density) of the carbons is constant and hence the total bed heights of Types 1 and 2 columns employed are the same, i.e. 25 cm in total. However,the total bed heights in Types 3 and 4 columns are different from the first two types.
Five stratified layers of carbons are packed in Types 3 and 4 columns for investigating the adsorption column operation to remove para-chlorophenol. Basically, the total mass of carbon used is the same for every adsorption column regardless of the column types. 215 g of F400 carbon with a uniform particle size of 500-710 μm is used for Types 1 and 2 columns,this mass basis is kept for Types 3 and 4 columns as well. Therefore, 43 g of each F400 carbon layer (with five different particle size range, namely 710-1000,500-710, 355-500, 250-355 and 150-250 μm) are used for para-chlorophenol systems. The coarsest F400 activated carbon was packed at the bottom part of the tapered column, while the finest was put on the top. Due to the variation of packing density of different portion of particle sizes, the overall bed height of the stratified columns used for para-chlorophenol is different. Since the total bed heights of both Types 3 and 4 columns are shorter than 25 cm, the last sampling point at 25 cm is able to represent the whole carbon bed in each column with a total mass of 215 g.
4 RESULTS AND DISCUSSION
4.1 Equilibrium adsorption isotherm studies
A series of glass bottles containing same amount of para-chlorophenol solutions and same mass of F400 carbon, but with different initial adsorbate concentrations, was shaken at constant speed of 200 r·min−1and temperature of 25 °C. To ensure the adsorption process has reached equilibrium, all samples were collected and the adsorbate concentrations were measured after being shaken for 21 days.
The solid phase adsorbate concentrations of each sample (qe,meas) were determined experimentally using Eq. (10). Theoretical solid phase adsorbate concentrations (qe,calc) were calculated using Eqs. (1) to (4). The isotherm constants of each single component isotherm model were determined using the Sum of Squared Error (SSE) analysis. Isotherm constants in each model were optimised by minimising the values of the SSE function, which is represented mathematically as
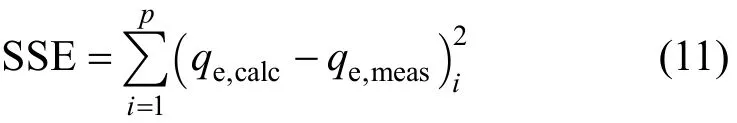
where p is the total number of equilibrium adsorption isotherm data points.
The experimental data points and four isotherm models for para-chlorophenol are plotted in Fig. 4. The isotherm parameters are summarised in Table 4. Based on the SSE values, the Redlich-Peterson isotherm model gives the lowest error value for para-chlorophenol(SSE 1412) adsorption onto F400 carbon. The Redlich-Peterson equation often describes the isotherm better than the classical equations because of its mathematical flexibility.
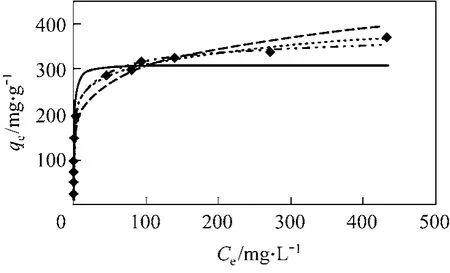
Figure 4 Four equilibrium isotherm plots for adsorption of para-chlorophenol and Acid Blue 25 onto F400 carbon(carbon particle size 500-710 μm, shaking speed=200 r·min−1,solution temperature 25 °C)◆ Experimental; Langmuir; Freundlich; RP;Sips
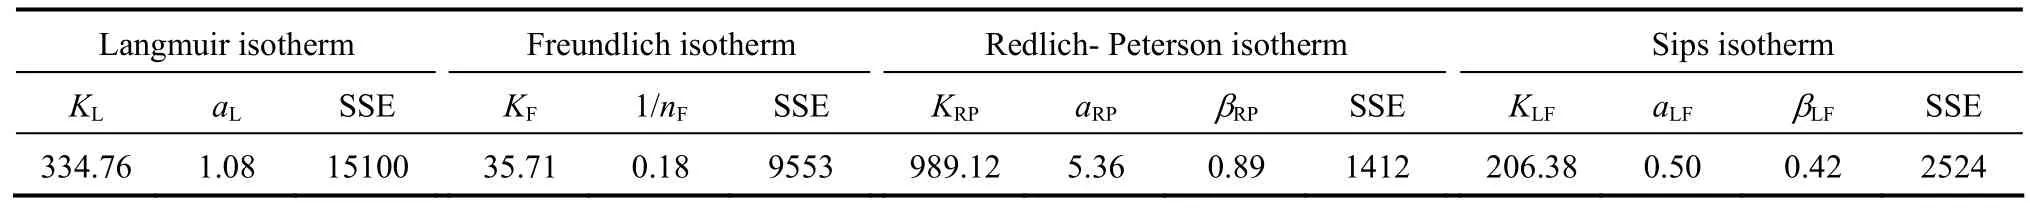
Table 4 Equilibrium isotherm parameters for adsorption of para-chlorophenol and onto F400 carbon
4.2 Adsorption fixed-bed column studies
4.2.1 BDST model prediction of para-chlorophenol/F400 carbon adsorption column system
Since the linear BDST model equation does not include the particle size variation, hence the analysis could be separated into two main groups, i.e. cylindrical adsorption columns (Types 1 and 3 columns) and tapered adsorption columns (Types 2 and 4 columns).
For cylindrical adsorption columns (Types 1 and 3 columns), Eq. (8) has the linear form as:

with the slope of this equation:
and the intercept of this equation represents:
Tapered columns (Types 2 and 4 columns) possess a different configuration compared to conventional constant diameter columns. The diameters of tapered columns are varied at different bed depths (or termed as bed heights). Hence the original BDST model would not be applicable in tapered columns directly as the interstitial velocity of adsorbate is changing along the columns.
By simple geometry, the interstitial velocity of adsorbate (v) at different bed heights (Z) could be defined as a function of bed height, as shown in Fig. 5.
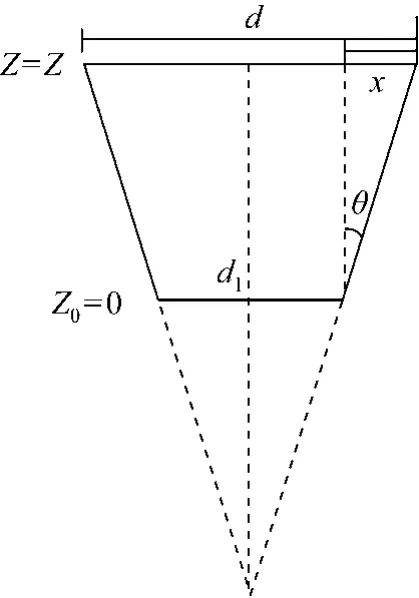
Figure 5 Schematic diagram of the transverse section of a tapered column
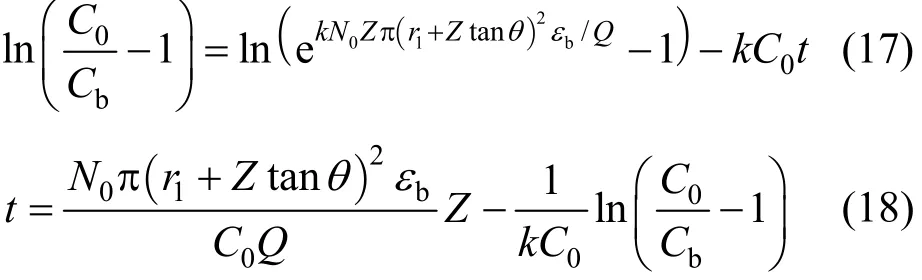
The interstitial velocity of adsorbate (v) in the tapered column at bed height Z is calculated as:
where r is the column radius at bed height Z, r1is the column radius at inlet bed height (Z=0), εbis the bed porosity and θ is the tapered angle.
For tapered adsorption columns (Types 2 and 4 columns), therefore, the original BDST and linearised BDST model become Eqs. (7) and (8) respectively.
The original BDST model is fitted for para-chlorophenol/F400 carbon column studies first to check if the value of the exponent term kN0Z/v is larger than unity, and the simpler linearised BDST model is consequently done. The parameters N0and k in both models are optimised by minimising the SSE function of Eq. (9). Table 5 summarizes the optimised N0and k of the original BDST model for para-chlorophenol/F400 carbon adsorption column studies.
The exponent term, which is calculated as kN0Z/v,is varying with bed heights for cylindrical columns(Types 1 and 3 columns), and it is changing with the bed heights and interstitial velocity of adsorbate in tapered columns (Types 2 and 4 columns). As a result,there is a range of the exponent values in each adsorption column for para-chlorophenol/F400 carbon system. The exponent terms in the original BDST model for para-chlorophenol/F400 carbon system (shown in Table 5) are much larger than unity, hence the linear form of the BDST proposed by Hutchins is valid to be used.
Figure 6 illustrates both predictions from the original BDST and linearised BDST models for Type 1 column removing para-chlorophenol, it is obvious that both models give the exact simulated plot to the experimental data points. Besides, the experimental data points of cylindrical columns are exhibiting a linear relationship between the bed depth and service time, which is in accordance with Eq. (8). The high R2value of 0.9999 indicates the bed depths are well in a linear relationship with experimental service time.
The linearised BDST model described in Eqs. (8)and (18) are used for the cylindrical columns (Types 1 and 3 columns) and tapered columns (Types 2 and 4columns) respectively. The Z0, N0and k values of each column are summarised in Table 6. The optimised N0and k values using the original BDST and linearised BDST models are almost identical, which indicate that the linearised BDST model is valid and appropriate to predict the para-chlorophenol/F400 carbon adsorption column system, with less complexity and good accuracy in fitting the experimental data. Hence, linearised BDST model equations represented by Eqs. (8) and(18) are used for predicting para-chlorophenol/F400 carbon system.
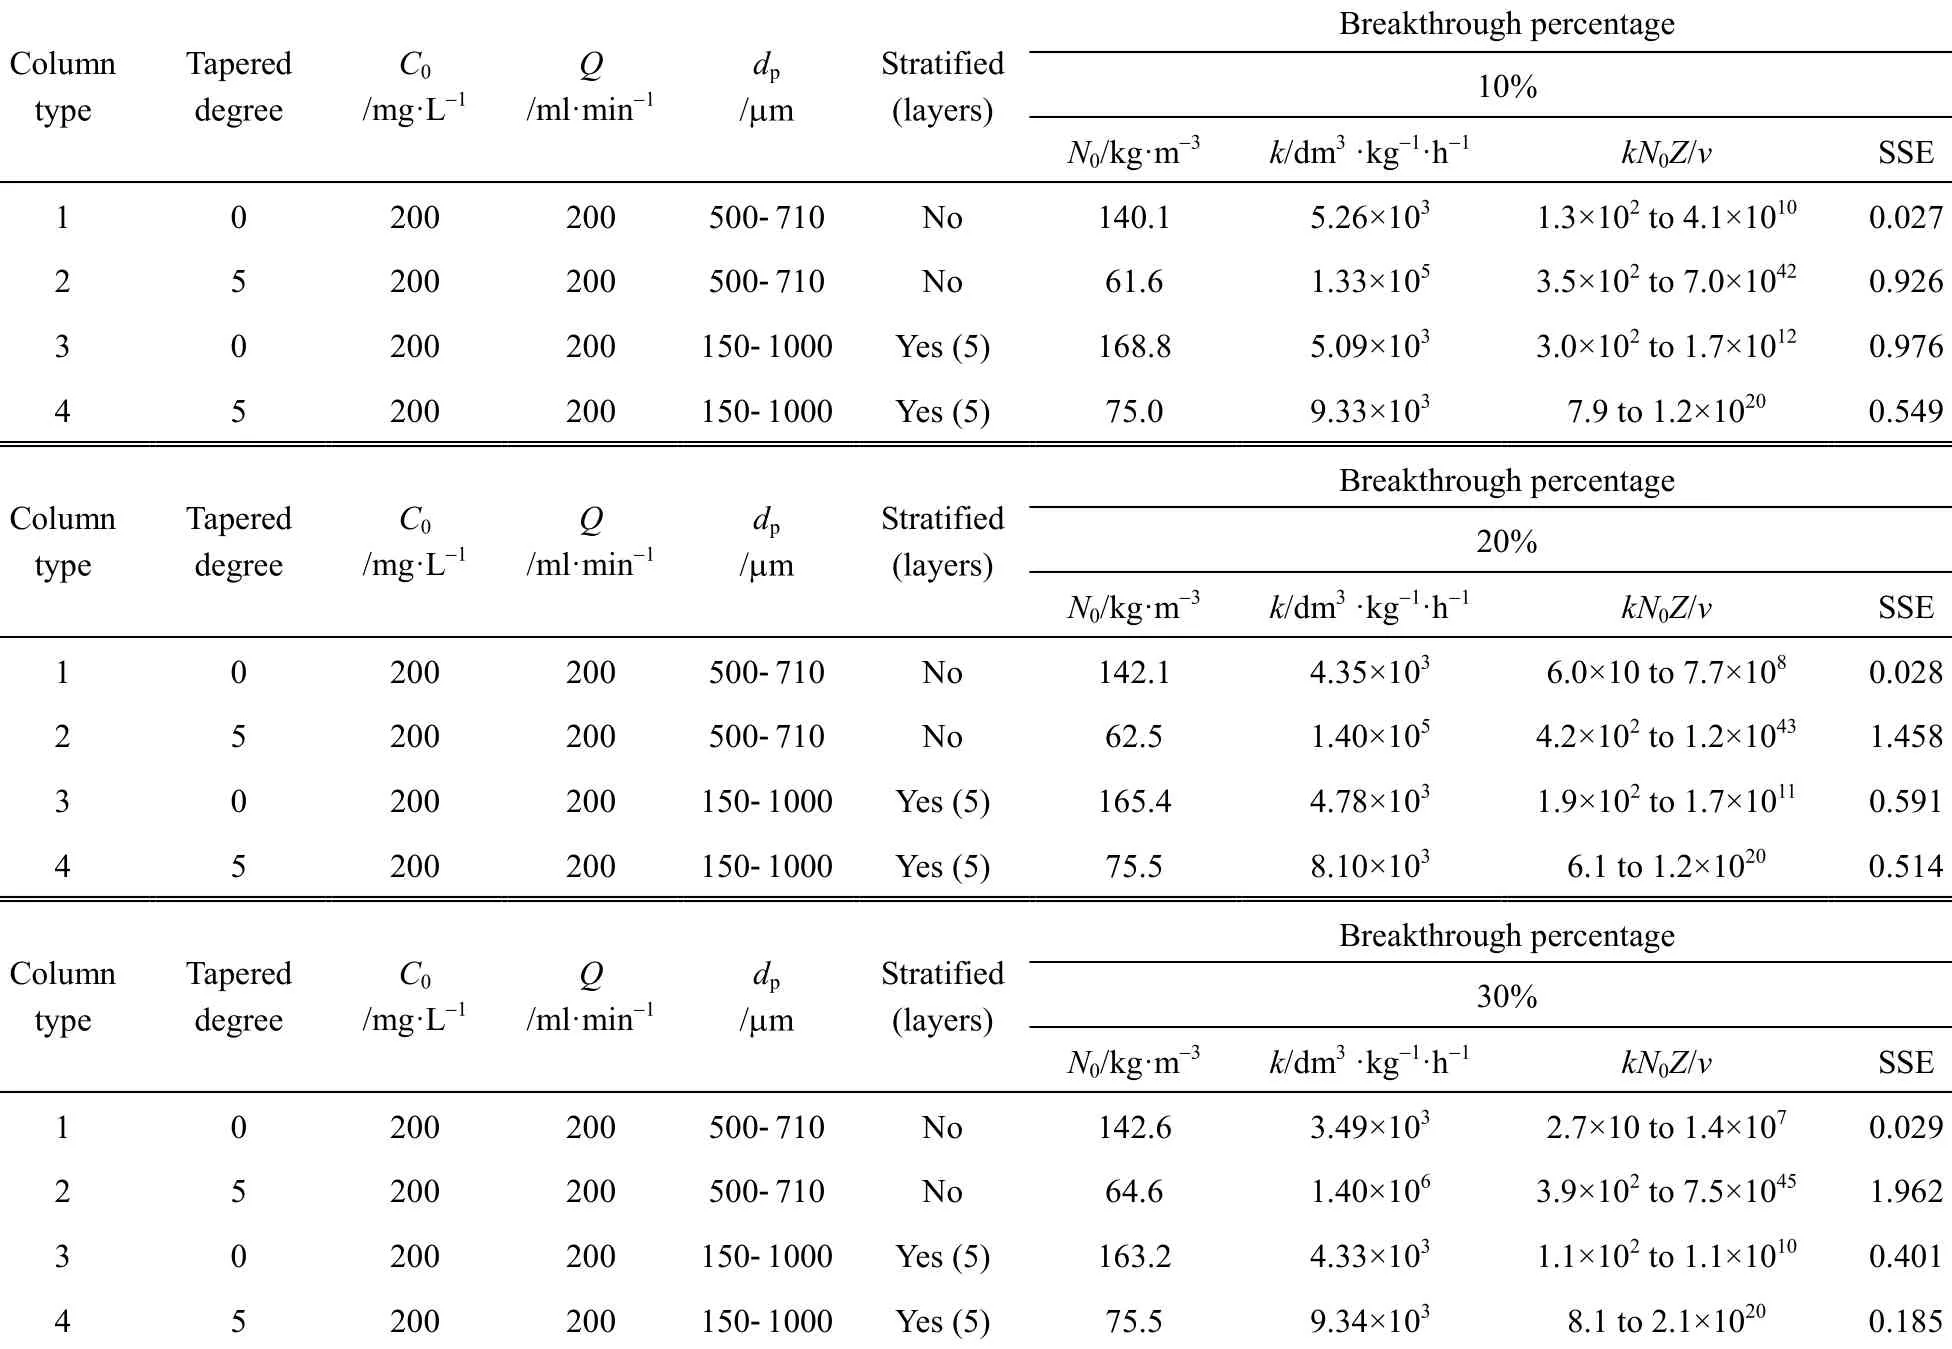
Table 5 Model parameters of original BDST model for the para-chlorophenol/F400 carbon fixed-bed adsorption column operation
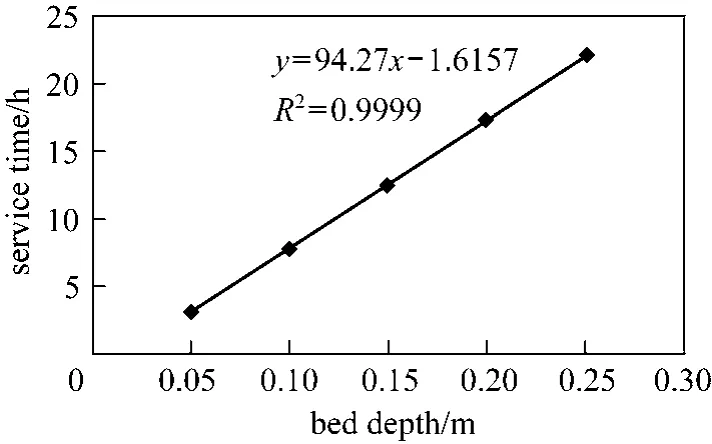
Figure 6 Original BDST and linearised BDST model predictions of Type 1 column (para-chlorophenol, cylindrical column, Q=200 ml·min−1, C0=200 mg·L−1, dp=500-710 μm,20% breakthrough)original BDST; linearized BDST
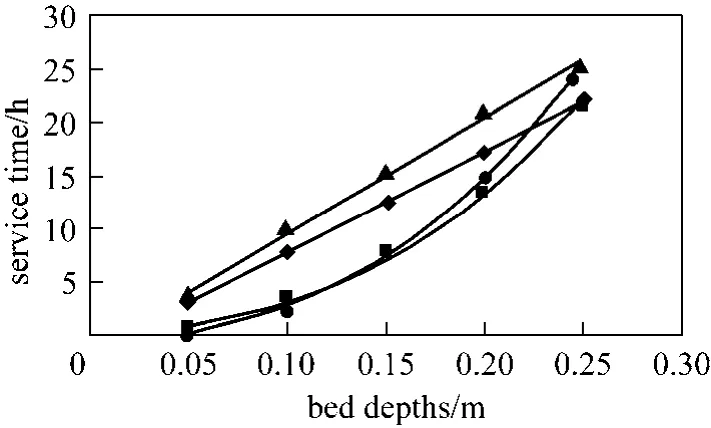
Figure 7 BDST model prediction of Types 1 to 4 columns(para-chlorophenol, Q 200 ml·min−1, C0=200 mg·L−1, 20%breakthrough)◆ Type 1; ■ Type 2; ▲ Type 3; ● Type 4
4.2.2 Comparison of BDST model predicted results for four different types of columns
Types 1 to 4 columns, which are operated under the same conditions (Q 200 ml·min−1, C0200 mg·L−1, M 215 g) are compared using the BDST model, and Fig. 7 illustrates the BDST plot of thesecolumns for 20% breakthrough. Obviously, the slope of the BDST plots of cylindrical columns (Types 1 and 3 columns) are linear, which is represented by Eq. (8),while they are curved for tapered columns (Types 2 and 4 columns) and in accordance with Eq. (11).
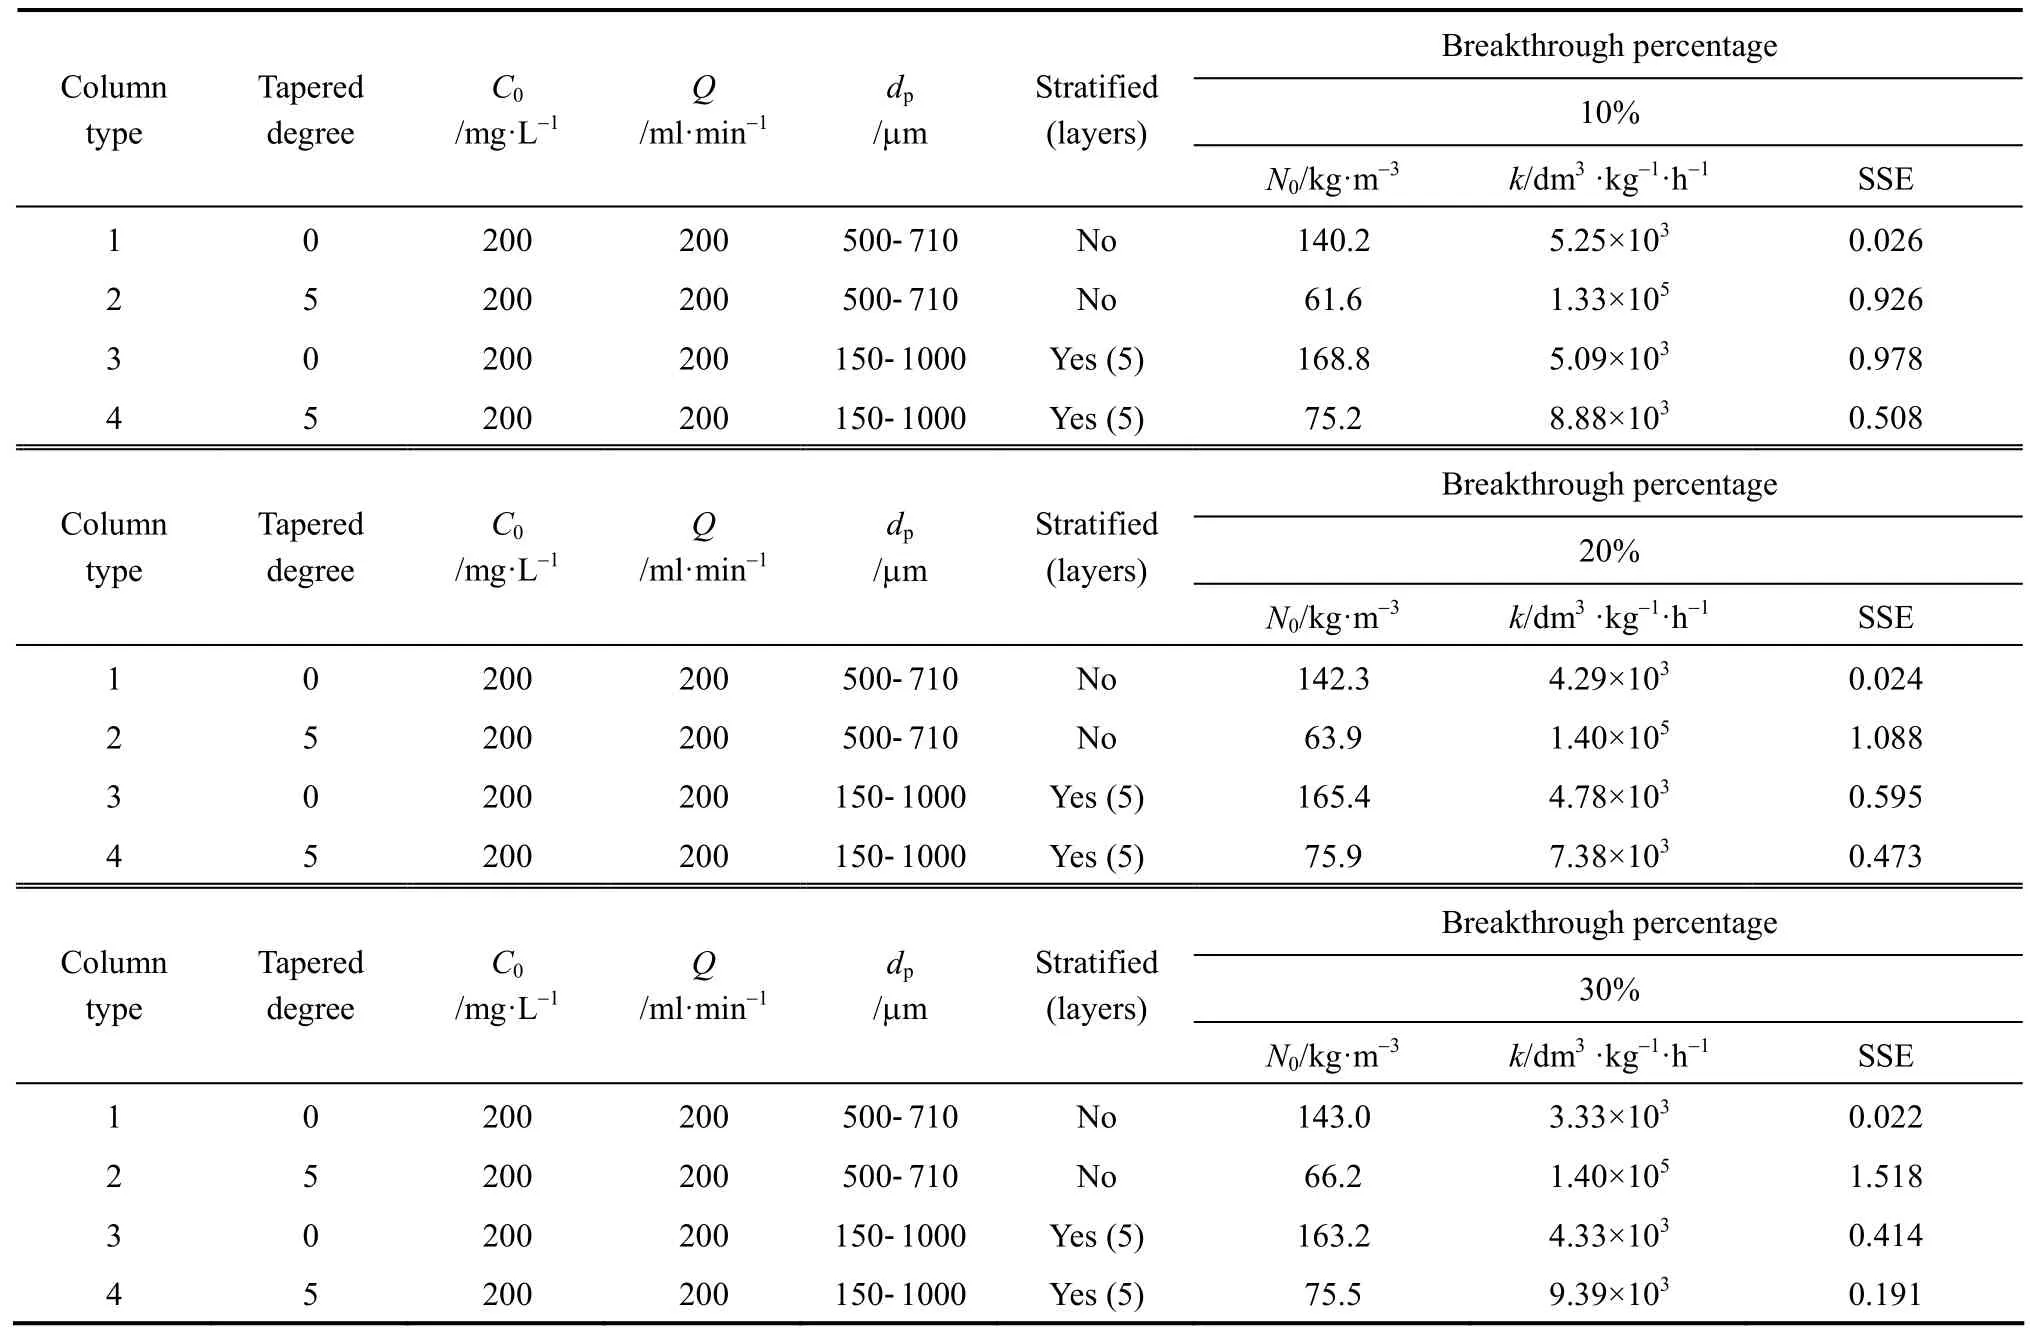
Table 6 Model parameters of linearised BDST model for the para-chlorophenol/F400 carbon fixed-bed adsorption column operation
In Fig. 7, the cylindrical columns exhibit longer service time than tapered columns, while the stratified columns show superior performance compared with non-stratified columns. In fact, the service time of the beds at the last sampling point of the Types 3 and 4 columns are very close, and those for Types 1 and 2 columns are almost identical. This indicates the top part of the tapered column, with smaller particle size packing and slower interstitial adsorbate velocity, is more efficient in removing para-chlorophenol than the bottom portion of the bed. From a practical operational point of view, the last sampling point is always the focus of a single adsorption column, since this point represents the same mass of carbon used and hence is more representative to be used for comparison. As a result,both Types 1 and 2 columns without particle stratification do not show any significant difference in terms of service time, while the service time of the stratified cylindrical column is about 5% longer than that of the stratified 5 degree tapered column. Besides, the optimised adsorption capacity values from the minimisation process of BDST model (listed in Table 6) also suggest stratified columns are superior to non-stratified columns, with 19% and 16% increase of the BDST adsorption capacity for tapered bed and cylindrical bed respectively.
4.2.3 Dependence of BDST adsorption capacity on the tapered angle
According to Table 6, the BDST adsorption capacity optimised for each type of column could not be compared directly, due to a dependence of BDST adsorption capacity on the tapered angle. The optimised adsorption capacity decreased with increasing tapered angle. Fig. 8 shows the correlation of averaged BDST adsorption capacity with the tapered angle, which is inferred from the high value of regression value(R20.9946). Hence, the BDST model equation with the incorporation of tapered angle becomes Eqs. (19)and (20) for predicting the cylindrical columns and tapered columns respectively.where N0,θis the BDST adsorption capacity for θ degree tapered column and N0,0is the BDST adsorption capacity for cylindrical column.
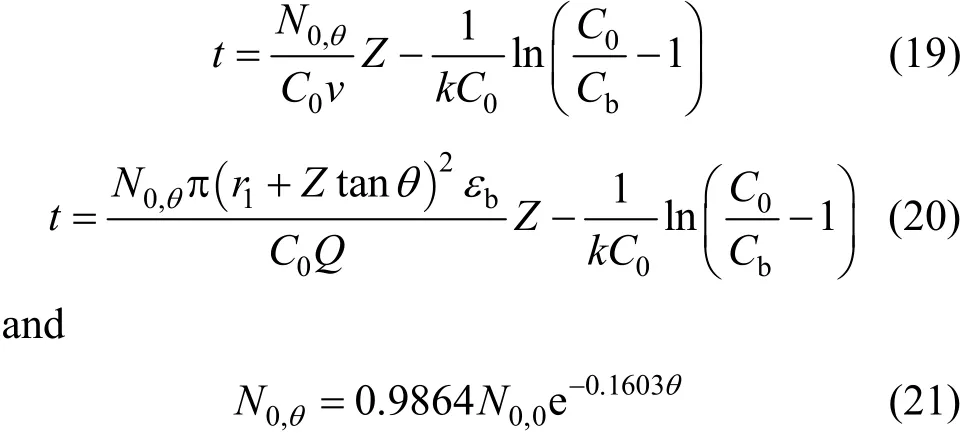
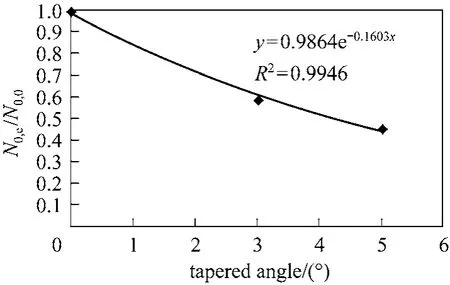
Figure 8 Correlation of BDST adsorption capacity with tapered angle for para-chlorophenol/F400 carbon column system
Actually, Eq. (19) is reduced and approximately equal to Eq. (8) for cylindrical columns with θ0.
4.3 Estimation of pressure drop using Ergun’s equation
For liquid phase system, the effect of pressure drop on the solute concentration (fluid density) is negligible [23], hence, the pressure drop is excluded from the design calculation of the fixed-bed reactor. But the pressure drop exerted by the friction when the liquid flow through a packed bed is a critical factor determining the pumping energy required, and eventually link up with the operating cost and capital cost of a wastewater treatment plant employing adsorption columns as unit operation.
The required pump power strongly depends on particle geometry, bed porosity, bed length and liquid flow characteristic, such as liquid flow rate (superficial velocity), liquid density and viscosity.
From the aforementioned results, the columns with carbon particle stratification could sharpen the breakthrough curve at the column outlet, which in turn would enhance the column service time, and reduce the frequency of adsorbent replacement or regeneration. Nevertheless, the pressure drop associated with the liquid flow may become a critical factor, if the columns are stratified into different layers and usually small carbon granules are involved.
Particle geometry does not significantly affect usable adsorptive capacity, but reduction in particle size does improve the adsorption rate. Powdered carbons adsorb more rapidly than granular carbons and fine granules more rapidly than coarse ones [24]. However,powdered activated carbon is avoided for column operation because of the large pressure drop associated with small particulate or powdered beds.
The pressure drop across a packed bed in an adsorption tower can be calculated using the friction factor correlation attributed to Ergun [25], which is given as:
where fpand Repare the friction factor for the packed bed and the particle Reynolds number respectively,and defined as:
where Δp is pressure drop across packed-bed, dpis particle diameter, ρ is density of adsorbate solution, vsis interstitial adsorbate velocity, εbis bed voidage and μ is the viscosity of adsorbate solution.
Rearranging Eq. (22) gives
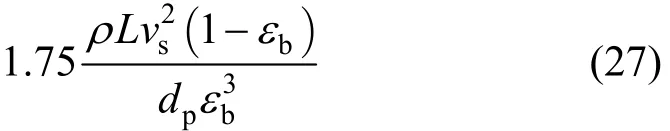
The first and the second terms on the right-hand side of the Eq. (25) represent the pressure drop derived from the viscous effect and kinetic effect respectively,that is:Pressure drop term 1 (due to viscous effect):
Pressure drop term 2 (due to kinetic effect):
Actually, the Ergun’s equation combines the Kozeny-Carman equation with the Burke-Plummer equation, in which Kozeny-Carman equation is valid for Rep<10 (laminar flow), while the Burke-Plummer equation is valid for Rep>1000 (turbulent flow).
For estimating the pressure drop across the packed bed, all adsorption columns investigated in the research are virtually segmented into layers with 0.1 m interval, and the Eq. (25) is used to calculate the pressure drop when the adsorbate solution flows through the packed bed. Table 7 summarizes the total pressure drop across the adsorbent bed of all columns investigated in this research. The para-chlorophenol/F400 carbon column system is used for demonstrating the effect of tapered angle, volumetric flowrate and particle size stratification on the pressure drop across the adsorbent bed.
Comparison of pressure drop across the adsorbent bed in type 1 to 4 columns
However, the total pressure drop does not necessarily increase with increasing the tapered angles; the pressure drop is reduced in the tapered columns after the introduction of particle size stratification. In Fig. 9,the total pressure drop shows a maximum value forthe Type 3 column, but the Type 4 column is exhibiting a lower pressure drop than Type 2 and 3 columns.The pressure drop concept across the packed bed is a crucial factor for determining the pump energy requirement of the whole adsorption system and hence affects the operating costs of a wastewater treatment plant using the adsorption column operation technique.Adsorption columns with small adsorbent packing usually show a significantly higher saturation percentage and hence longer service time [26, 27], but the significant pressure drop inhibits its feasibility. The stratified columns are superior to the non-stratified columns in term of the service time and saturation percentage of the adsorbent bed, in which the Type 4 column is slightly inferior to the Type 3 column.Therefore, combining the effects of the adsorption efficiency and the associated total pressure drop, the Type 4 columns become the most appropriate choice to be used in adsorption column operation. This is corroborated by the Pota and Mathews [13], who reported an adsorber configuration utilising both tapered geometry and stratification could enhance the breakthrough time and reduce the overall activated carbon bed head loss as compared with conventional cylindrical fixed-beds.
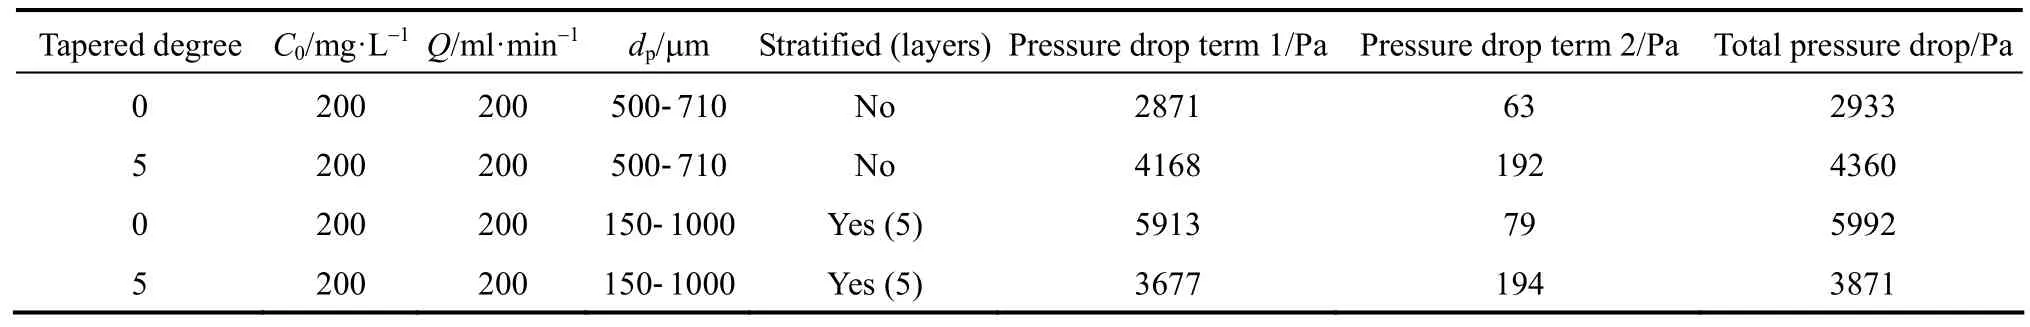
Table 7 Pressure drop across the adsorbent bed within different types of columns for para-chlorophenol/F400 carbon systems
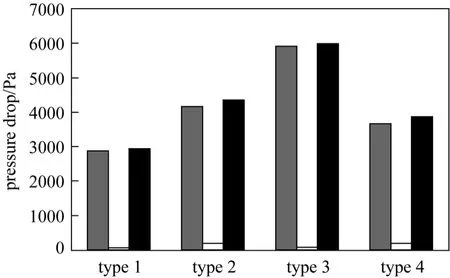
Figure 9 The pressure drop term 1, pressure drop term 2 and total pressure drop associated with the para-chlorophenol flow through the different types of adsorption columns(Q=200 ml·min−1, C0=200 mg·L−1)
5 CONCLUSIONS
Various isotherm models (Langmuir, Freundlich,Redlich-Peterson and Sips equations) are employed for modeling the adsorption behaviors of p-chlorophenol adsorption. The experimental isotherm data are compared with theoretical predicted values using the Sum of Squared Error (SSE) analysis. The Redlich-Peterson equation is shown to be the best fit model, since it possesses the least SSE values amongst the isotherm models used, for describing the adsorption of the para-chlorophenol/F400 carbon system.
The Bed Depth Service Time (BDST) model,which is one of the simplified design models, is used to describe the relationship between bed depth and the service time of an adsorption column. The linearised BDST model proposed by Hutchins is proved to be applicable as the original BDST model developed by Bohart and Adams, since the exponent term is always larger than unity. The linearised BDST model fits the experimental data of the para-chlorophenol/F400 carbon system well for cylindrical columns, regardless of particle size distribution packing inside. The linearised BDST model has been modified with the introduction of the variable interstitial adsorbate velocity, which is a function of bed height, and is implemented to correlate the experimental data obtained for the tapered columns.Those optimised BDST adsorption capacities for the tapered columns obtained in this research show a dependence on the tapered angles, regardless of the carbon particle stratification involved and have been found to be not specific to the adsorbate/adsorbent system.
According to the BDST model predictions on all types of adsorption columns investigated for the para-chlorophenol/F400 carbon systems, the following findings were concluded. The service time and adsorption capacity of an adsorbent bed increased with increasing breakthrough percentages. Generally, the cylindrical columns exhibit longer service time than tapered columns, and the stratified columns show superior performance compared with the non-stratified columns. Considering the service time of the adsorbent bed exhibited by the last sampling point in each type of columns and the optimised BDST adsorption capacity values, amongst the stratified columns, the Type 3 column showed a slight improvement in the service time over that of the Type 4 column. Both Type 1 and 2 columns possess similar service time, which indicated these two columns have a similar adsorption capacity.
However, the pressure drop across the fixed-bed is a crucial factor for determining the pump energy requirement of the whole adsorption system and hence affects the operating cost of a wastewater treatment plant using the adsorption column operation technique.The total pressure drop does not necessarily increase with increasing the tapered angles, the pressure drop is reduced in the tapered columns with adsorbent stratification. The Type 4 column exhibits a lower total pressure drop than the Types 2 and 3 columns. Therefore, combining the effects, adsorption efficiency and the associated pressure drop, the Type 4 column is the most appropriate choice for being used in adsorption column operation.
1 Tsyganok, A.I., Yamanaka, I., Otsuka, K., “Dechlorination of chloroaromatics by electrocatalytic reduction over palladium-loaded carbon felt at room temperature”, Chemosphere, 39, 1819-1831(1999).
2 Dabo, P., Cyr, A., Laplante, F., Jean, F., Menard, H., Lessard, J.,“Electrocatalytic dehydrochlorination of pentachlorophenol to phenol or cyclohexanol”, Environmental Science and Technology, 34,1265-1268 (2000).
3 Pera-Titus, M., García-Molina, V., Baños, M. A., Giménez, J., Esplugas, S., “Degradation of chlorophenols by means of advanced oxidation processes: A general review”, Applied Catalysis B: Environmental, 47, 219-256 (2004).
4 Verschueren, K., Handbook of Environmental Data on Organic Chemicals, Wiley, New York (2001).
5 Huff, J., “Sawmill chemicals and carcinogenesis”, Environmental Health Perspectives, 109, 209-212 (2001).
6 Lampi, P., Hakulinen, T., Luostarinen, T., Pukkala, E., Teppo, L.,“Cancer incidence following chlorophenol exposure in a community in southern Finland”, Archives of Environmental Health, 47,167-175 (1992).
7 Hayward, K., “Drinking water contaminant hit-list for US EPA,”Water, 21, 4-9 (1999).
8 “EC Decision 2455/2001/EC of the European Parliament and of the Council of November 20, 2001—establishing the list of priority substances in the field of water policy and amending Directive 2000/60/EC”,Official Journal of the European Communities, L 331, (2001).
9 Przepiórski, J., “Enhanced adsorption of phenol from water by ammonia-treated activated carbon”, Journal of Hazardous Materials,135, 453-456 (2006).
10 Inglezakis, V.J., Poulopoulos, S.G., Adsorption, Ion Exchange, and Catalysis: Design of Operations and Environmental Applications,Elsevier, Amsterdam (2006).
11 Basmadjian, D., “The adsorption drying of gases and liquids”, In:Advances in Drying, Mujumdar, A.S., ed., Hemisphere Inc., Washington D.C. (1983).
12 Mathews, A.P., “Effect of adsorbent particle layering on performance of conventional and tapered fixed-bed adsorbers”, Journal of Environmental Engineering, 131, 1488-1494 (2005).
13 Pota, A.A., Mathews, A.P., “Adsorption dynamics in a stratified convergent tapered bed”, Chemical Engineering Science, 55,1399-1409 (2000).
14 Langmuir, I., “The constitution and fundamental properties of solid and liquids-Part I. Solids”, Journal of the American Chemical Society, 40, 1361-1403 (1918).
15 Freundlich, H., “Over the adsorption in solution”, Journal of Physical Chemistry, 57, 385-471 (1906).
16 Redlich, O., Peterson, D. L., “A useful adsorption isotherm”, Journal of Physical Chemistry, 63, 1024-1026 (1959).
17 Sips, R., “Combined form of Langmuir and Freundlich equations”,Journal of Chemical Physics, 16, 490-495 (1948).
18 Bohart, G.S., Adams, E.Q., “Some aspects of the behavior of charcoal with respect to chlorine”, Journal of the American Chemical Society, 42, 523-544 (1920).
19 Sze, M.F.F., Lee, V.K.C., McKay, G., “Simplified fixed bed column model for adsorption of organic pollutants using tapered activated carbon columns”, Desalination, 218, 323-333 (2008).
20 McKay, G., Bino, M.J., “Fixed bed adsorption for the removal of pollutants from water”, Environmental Pollution, 66, 33-53 (1990).
21 Hutchins, R.A., “Optimum sizing of activated carbon systems”, Industrial Water Engineering, 10, 40-43 (1973).
22 Calgon Carbon Corporation, “Product bulletin of Filtrasorb 400 activated carbon”, Calgon Carbon Corporation, 2009 [2009-01-21], http://www.calgoncarbon.com/carbon_products/documents/Filtrasorb400.pdf
23 Fogler, H.S., Elements of Chemical Reaction Engineering, Prentice Hall, New York (1999).
24 Slejko, F.L., Adsorption Technology: A Step-by-Step Approach to Process Evaluation and Application, Marcel Dekker, New York(1985).
25 Ergun, S., “Fluid flow through packed columns”, Chemical Engineering Progress, 48, 89-94 (1952).
26 Lee, V.K.C., Porter, J.F., McKay, G., “Development of fixed-bed adsorber correlation models”, Industrial and Engineering Chemistry Research, 39, 2427-2433 (2000).
27 Ko, D.C.K., Porter, J.F., McKay, G., “Correlation-based approach to the optimization of fixed-bed sorption units”, Industrial & Engineering Chemistry Research, 38, 4868-4877 (1999).
2012-02-20, accepted 2012-04-05.
* To whom correspondence should be addressed. E-mail: kemckayg@ust.hk
杂志排行

Chinese Journal of Chemical Engineering的其它文章
- Analysis of Absorption and Reaction Kinetics in the Oxidation of Organics in Effluents Using a Porous Electrode Ozonator*
- Flame Imaging in Meso-scale Porous Media Burner Using Electrical Capacitance Tomography*
- Modelling and Fixed Bed Column Adsorption of Cr(VI) onto Orthophosphoric Acid-activated Lignin
- Advances in Large-eddy Simulation of Two-phase Combustion (I)LES of Spray Combustion*
- Top-cited Articles in Chemical Engineering in Science Citation Index Expanded: A Bibliometric Analysis
- Mass Transfer of Copper(II) in Hollow Fiber Renewal Liquid Membrane with Different Carriers*