Analysis of Absorption and Reaction Kinetics in the Oxidation of Organics in Effluents Using a Porous Electrode Ozonator*
2012-10-31AlexanderMathewsandKishoraPandaDepartmentofCivilEngineeringKansasStateUniversityFiedlerHallManhattanKS66506USAHDREngineeringInc330ElCaminoRealSuite00IrvineCA9604USA
Alexander P. Mathews** and Kishora K. Panda Department of Civil Engineering, Kansas State University, Fiedler Hall, Manhattan, KS 66506, USA HDR Engineering, Inc., 330 El Camino Real, Suite 00, Irvine, CA 9604, USA
Analysis of Absorption and Reaction Kinetics in the Oxidation of Organics in Effluents Using a Porous Electrode Ozonator*
Alexander P. Mathews1,** and Kishora K. Panda21Department of Civil Engineering, Kansas State University, Fiedler Hall, Manhattan, KS 66506, USA2HDR Engineering, Inc., 3230 El Camino Real, Suite 200, Irvine, CA 92604, USA
A novel electrode design for the in situ generation of ozone in the reaction zone of a tubular reactor is described in this work. The ozone generator uses a porous inner electrode tube in the corona discharge assembly,and the ozone generated around the outer periphery of the porous tube diffuses into the tubular reactor and reacts with the contaminants in the fluid that is being treated. A mathematical model that includes absorption and second order reaction in the film is developed to describe ozonation kinetics of a contaminant dye in the tubular reactor.The model describes the experimental data for dye decolorization, oxidation byproducts, dissolved ozone, and ozone gas concentrations well. Model analysis indicates that the fast dye decolorization reaction occurs partly in the liquid film and partly in the bulk fluid. The model can be used in the selection of appropriate gas-liquid contactors for efficient oxidation of contaminants in effluents.
ozonation kinetics, absorption and reaction, ozone generator
1 INTRODUCTION
Ozone is a powerful oxidizing agent with an oxidation potential that is about 1.5 times that of chlorine, and is more effective than chlorine in the destruction of microorganisms including cryptosporidium cysts [1, 2]. It is also a relatively benign oxidant,and unlike chlorine, it does not produce chlorinated organic compounds many of which are carcinogens.As a result, ozone is being used to some extent in water treatment systems for disinfection, and for chemical oxidation of humic substances and other organic compounds in water supplies [2, 3]. Ozone is also being studied for use in wastewater treatment for the removal of color from textile and tannery effluents,the breakdown of high molecular mass organics from fermentation effluents, the prevention of microbial growth in integrated circuit process waters and cooling towers, and oxidation of metal finishing wastes [4, 5].
The widespread use of ozone in many applications is limited at present due to the high cost of ozonation. The low solubility of ozone, mass transfer limitations, and ozone self-decomposition, are some of the factors that contribute to poor utilization of applied ozone. The high costs associated with ozone application can be reduced by enhancing the ozone utilization efficiency through a better understanding of the mechanistic processes involved in ozone oxidation, and the design and utilization of appropriate gas-liquid contactors.
The reaction between ozone and an organic compound is a heterogeneous reaction that is governed by gas absorption and reaction rates. Depending on the chemical reaction rate, the reaction may occur in the liquid film, the bulk liquid, or a combination of both.Fast reactions can typically be expected to occur in the hydrodynamic film, and in such cases, contactors that provide high interfacial area will be efficient. At the other extreme, slow reactions will primarily occur in the bulk liquid, and contactors that provide large liquid holdup such as bubble columns will be suitable in these cases. Fast oxidation reactions involving hydroxyl radicals can be expected to occur in the film.Hence, it is important to investigate the absorption and reaction regime, and choose the type of contactor system that will be most efficient in such cases.
Ozone dissolution efficiency is increased typically by using fine bubble diffusers in deep tanks. This results in a higher ozone partial pressure and increased ozone solubility. Capital and operating costs are however higher for deep tank ozonation due to the high cost of gas compression. Moreover, there is a need to treat off-gases for residual ozone and stripped VOCs.Hollow fiber membranes have been studied to provide bubble-less transfer of oxygen across membranes into the solution [6]. These can provide much higher transfer efficiencies by maintaining high pressures (as high as 0.6 MPa) on the gas side of the membrane. However, the overall costs of such systems utilizing hollow fiber membranes are high. Moreover, this system still does not use the ozone as it is generated. The ozone must be produced in a generator, pressurized and transmitted to the ozone contactor, and hence there is loss of activity due to decomposition and the absence of short-lived species.
In this research, a porous electrode ozone generator was investigated for the generation of ozone in situ,and immediate reaction of the ozone with the contaminants flowing in the porous tube. Experimental data developed for the oxidation of a high molecular mass dye is analyzed in terms of mass transfer and reaction mechanisms in the ozonator.
2 MATERIALS AND METHODS
A schematic of the porous electrode ozonator is shown in Fig. 1. The porous electrode ozonator (PEO)design is based on a novel corona discharge tube construction in which the discharge gap is kept juxtaposed to the tubular pathway through which the treatment fluid is passed [7, 8]. A porous inner electrode tube is employed in the discharge tube, and the generated ozone diffuses through the outer periphery of the porous tube and dissolves and reacts with the contaminants in the fluid that is being treated. The inner porous ceramic tube is grounded while the outer glass electrode is positively charged for corona discharge.Ozone and any short-lived species that are generated in the corona discharge along the outer periphery of the porous electrode will diffuse and react with the contaminants at the gas-liquid interface in the porous tube. The experimental reactor has a porous cylindrical electrode of length 29.6 cm, internal diameter of 1.95 cm, and thickness of 2.8 mm. The outer glass tube is 3.5 cm in diameter, 30 cm in length, and the discharge gap between the glass and the periphery of the porous electrode is 0.6 mm. The volume of the porous tubular reactor is 0.09 L.
The reactor was operated in the recycle mode due to its small volume. A 1.1 L recirculation reservoir was used along with a pump to circulate the liquid through the porous tubular reactor. Simultaneously, ozone was generated around the periphery of the porous tube due to corona discharge in the gap. The ozone and short-lived species along with the unreacted oxygen diffuse through the porous tube and react with the contaminants in the circulating fluid. After gas-liquid separation in the reservoir, gas and liquid samples were analyzed for ozone concentrations in the respective phases. The gas was bubbled through potassium iodide solution to quench any unreacted ozone prior to discharge to the atmosphere.
Reactive Blue 19 (Remazol Brilliant Blue R, C.I.6200) dye was used as the reactant in the ozone oxidation studies. Dye samples were analyzed by measuring absorbance at 590 nm using a Visible Spectrophotometer. COD analyses of the dye samples and ozonation byproducts were done following the closed reflux and colorimetric method. High purity oxygen was used for generation of ozone. Ozone concentration in the gas phase was analyzed using a BMT 964 (BMT Messetechnik, Berlin, Germany) ozone analyzer. The instrument was calibrated using the KI wet test method. Ozone generation rate was determined indirectly by mass balance analysis using dissolved and gas phase ozone concentrations at steady state as given by Eq (1).Ozone generation rate of the PEO cannot be measured directly as the ozone generated immediately diffuses and dissolves in the fluid in the reactor.
3 MECHANISTIC ANALYSIS OF OZONE ABSORPTION AND REACTION
In physical absorption of ozone in water, the rate of absorption of ozone from gas phase to liquid phase can be expressed using the film theory according to Eq. (1). When there is simultaneous absorption and chemical reaction, the rate of ozone mass transfer will increase depending upon the relative concentrations of reacting compounds in the gas and liquid phases, their solubility, and the relative rates of the mass transfer and reaction steps. In order to describe this increase in ozone transfer, an enhancement factor E has been introduced as defined by Eq. (2), as the ratio of actual rate of mass transfer in the presence of chemical reaction to the mass transfer rate in the absence of chemical reaction [9-11].
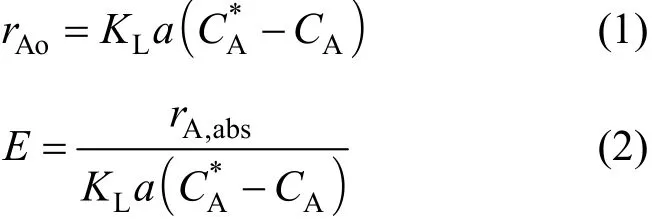
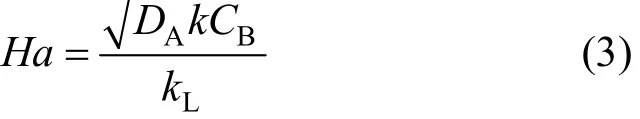
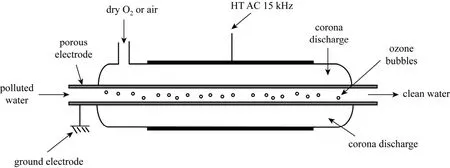
Figure 1 In situ porous electrode ozonator
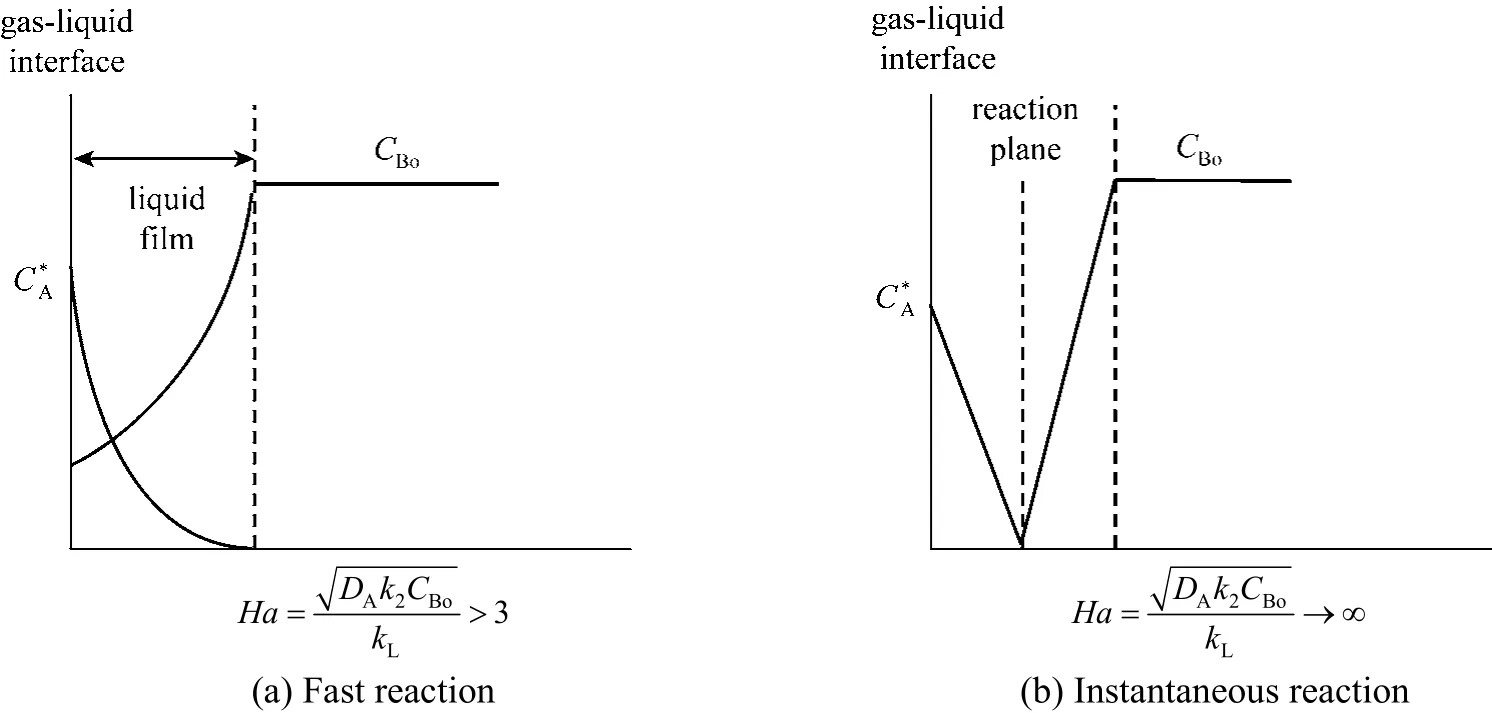
Figure 2 Dye (CB) and ozone (CA) profiles for fast reaction (a) and instantaneous reaction (b)
Here rA,absis the rate of ozone transfer in the presence of chemical reactions. Depending on the rate of reaction of ozone with the contaminants in water, the kinetic regime can be classified from slow to instantaneous [11]. The reaction regime is often described by a dimensionless parameter, Hatta number (Ha), which is defined by Eq. (3).CBis the reactant concentration, k the rate constant for the reaction between ozone and the organic contaminant, and kLthe mass transfer coefficient. Depending on whether the reaction rate is slow or fast, and the concentration of the reactant, various classifications can be made in the reaction regimes. Three relevant cases are discussed here. In all cases, the gas film resistance is assumed to be negligible. For a slow reaction between ozone and the reactant, there will be very little reaction occurring in the liquid film, and E will be ~1.0 as there will be no enhancement of mass transfer due to reaction. This occurs when 0.02<Ha<0.3.
If the reaction is sufficiently fast (Ha>3), it will occur completely in the liquid film during ozone transport through the film, and the concentration of ozone in the bulk liquid will be virtually zero. This is illustrated in Fig. 2 (a). Fast reactions of contaminants with molecular O3can be expected to follow this behavior. For such reactions, the rate of absorption will be quite large if the interfacial area is high. Thus, contactors that provide high interfacial area would provide effective and efficient use of ozone. If the reaction between O3and the contaminant is instantaneous(high reaction rate constant), the reaction will occur at a plane in the liquid film where both O3and the reactant will be depleted. The concentration of O3in the bulk liquid will be zero. This will be the case when the solubility of the gas is high, and the reactant concentration is relatively low. The rate of reaction in this case is limited by the rate at which the reactant can diffuse to the reaction plane in the film. This case is illustrated in Fig. 2 (b). Reactions involving hydroxyl radicals and endocrine disrupting compounds such as estrogens, may potentially fall in this category. The mass transfer rate is given by

Here Einstis the limiting value of E, and is given by
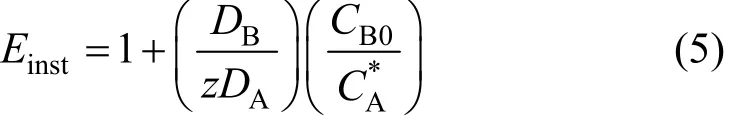
Einstis a function of the diffusivities of A and B and the relative concentrations of the reactant and dissolved ozone.
Few studies have considered the reactions of ozone with reactants separately in the film and the bulk liquid. Oinas et al. [12] introduced the concept of a depletion factor (D) analogous to E. D is defined as the ratio between the flow rate of ozone entering the bulk liquid in presence of a chemical reaction and the flow rate entering at the same surface during physical absorption alone [12, 13]. Benbelkacem and Debellefontaine [13] conducted detailed validations of this approach through modeling and experimental studies on ozonation of fumaric acid in a batch reactor. They reported that the approach is universally applicable to all reaction orders, whatever their values. The value of E and D are calculated from the slope of the concentration profiles [Eq. (6) and Eq. (7)] of ozone inside the liquid film, which gives
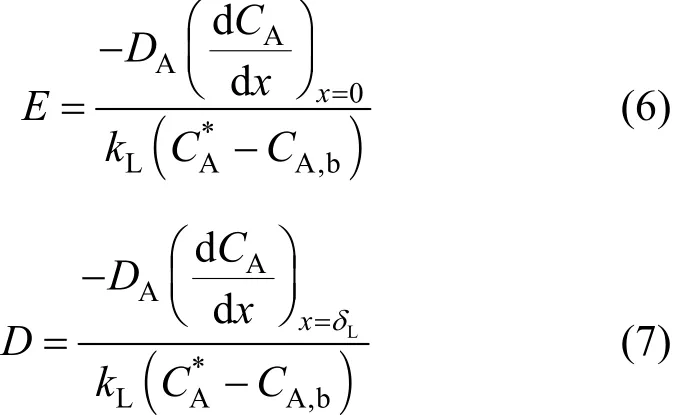
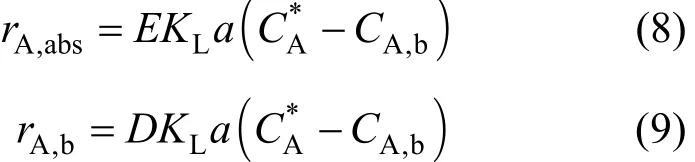
exact values for the reaction regime being considered[13]. Here CA,bis the bulk concentration of ozone (A),CA, and CBthe concentrations of A and B within the liquid film, and δLis the thickness of liquid film. The ozone absorption rate from the gas phase to the liquid film (rA,abs) and from the liquid film into the bulk liquid (rA,b) can be written respectively as Eq. (8) and Eq(9). The enhancement factor E is the ratio of mass transfer in the presence of chemicals reaction to that for physical absorption alone. Similarly, the depletion factor, D is the ratio of depletion of ozone into the bulk liquid in the presence of chemical reaction to that of depletion due to physical absorption alone. For slow reactions, the rate of ozone diffusion into the film at the interface is equal to the rate of ozone diffusion out at the film boundary into the bulk liquid. In this case the chemical reaction takes place in the bulk liquid, and E and D are equal to 1. As the reaction rate increases, the reaction will take place partly in the film and partly in the bulk.
This approach can be used to analyze the reaction between molecular ozone and organic contaminants,and the reaction between hydroxyl radicals (generated for example, using H2O2and O3) and organic contaminants. Experimental and modeling studies can provide information on the extents of reaction in the liquid film and the bulk liquid at various contaminant concentrations. This information will be useful in the choice of whether molecular ozone or hydroxyl radicals will be appropriate for a particular situation. It will also be useful in the choice of the appropriate contactor that will effectively utilize the ozone produced. A porous electrode system proposed in this work will provide substantial interfacial area along the periphery of the porous tube for fast reactions to occur in the film. No studies have been reported in the literature on the simultaneous mass transfer and reaction mechanisms that may be operative in the decolorization of dyes by ozone and subsequent oxidation of primary decomposition products by ozone.
4 DYE OZONATION KINETICS
Model equations were developed that describe diffusion and reaction in the liquid film, and reaction in the bulk liquid. The oxidation kinetics model for the dye is based on the consideration of two parallel reactions in the reactor. The reaction stoichiometries are given below. The dye (B) decolorization reaction is fast and results in the rapid utilization of ozone and the generation of primary ozonation products (P1). The primary ozonation products react further with ozone at a slower rate to produce secondary end products (P2).Ozone oxidation of high molecular mass organics results in a number of primary and secondary products whose analyses are cumbersome and expensive.Chemical oxygen demand (COD) was used as the surrogate parameter to keep track of the primary and secondary product concentrations.
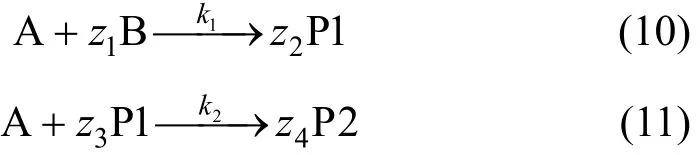
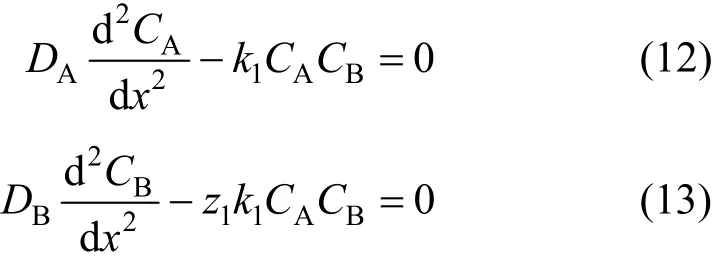
Depending on the relative rates of reaction and mass transfer, the gas-liquid reactions can occur in the liquid film, the bulk liquid, or a combination of both[11]. The decolorization reaction is moderately fast,and is assumed to occur in the film and the bulk liquid.The second reaction is slow, and is assumed to occur in the bulk liquid only. For the second order reaction between ozone and dye as given by Eq. (10) and Eq.(11), the steady-state diffusion and reaction equations for ozone and the contaminant are given by Eqs. (12)and (13). These equations along with the appropriate boundary conditions must be solved to obtain ozone and contaminant concentration profiles in the film,and the enhancement and depletion factors.
5 ABSORPTION AND REACTION IN A POROUS ELECTRODE OZONATOR
The tubular PEO can be modeled using the dispersed plug flow model with equations for each specie in the liquid phase or as a series of completely mixed reactors. A model schematic is shown in Fig. 3. As ozone is supplied along the periphery of the tubular reactor, the latter approach is expected to yield better results. This is due to the fact that gas flow is not admitted concurrently at the bottom of the reactor, but along the periphery of the reactor. Each succeeding compartment in the reactor will have gas and liquid input from the previous compartment and gas input from the periphery to that compartment. A uniform gas composition and a perfect mixed reactor assumption are not appropriate in this case. A model as described in this section is new, and has not been reported in the ozonation literature. A set of mass balance equations for ozone gas, dissolved ozone, and contaminant is developed for the reactor and recirculation unit. Tracer studies were conducted to approximate the tubular reactor with n compartments-in-series reactor system.
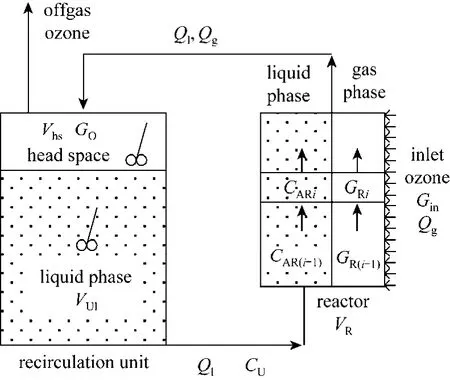
Figure 3 Schematic representation of porous electrode reactor and recirculation unit
5.1 Model equations for porous electrode reactor
The mass balance equations for a reactor with n compartments are as follows:
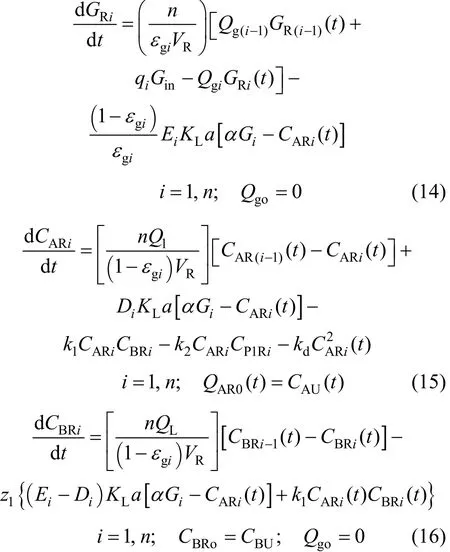
Here, GRi, CARi, and CBRi, are the reactor gas,dissolved ozone and contaminant concentrations in the ith compartment. α is the ozone gas to liquid partition coefficient, kdthe ozone self-decomposition rate constant, KLa the mass transfer coefficient, E the enhancement factor, and D the depletion factor. The first term in Eq. (14) on the right hand side (RHS) is the ozone gas bulk flow in each compartment, and the second term the ozone mass transfer in the presence of reaction. The first term on the RHS in Eq. (15) describes dissolved ozone bulk flow in each compartment i, the second term the ozone transfer into the bulk fluid from the gas phase, the third term the reaction of ozone with the contaminant, the fourth term the secondary reaction of ozone with primary byproducts of ozonation, and the last term the self-decomposition of ozone.In Eq. (16), the first term on the RHS describes bulk flow of contaminant, the second term the consumption of contaminant by reaction in the film, and the third term the consumption of contaminant by reaction in the bulk liquid. Similar mass balance equations can be written for the primary and secondary products of dye decomposition in the reactor.
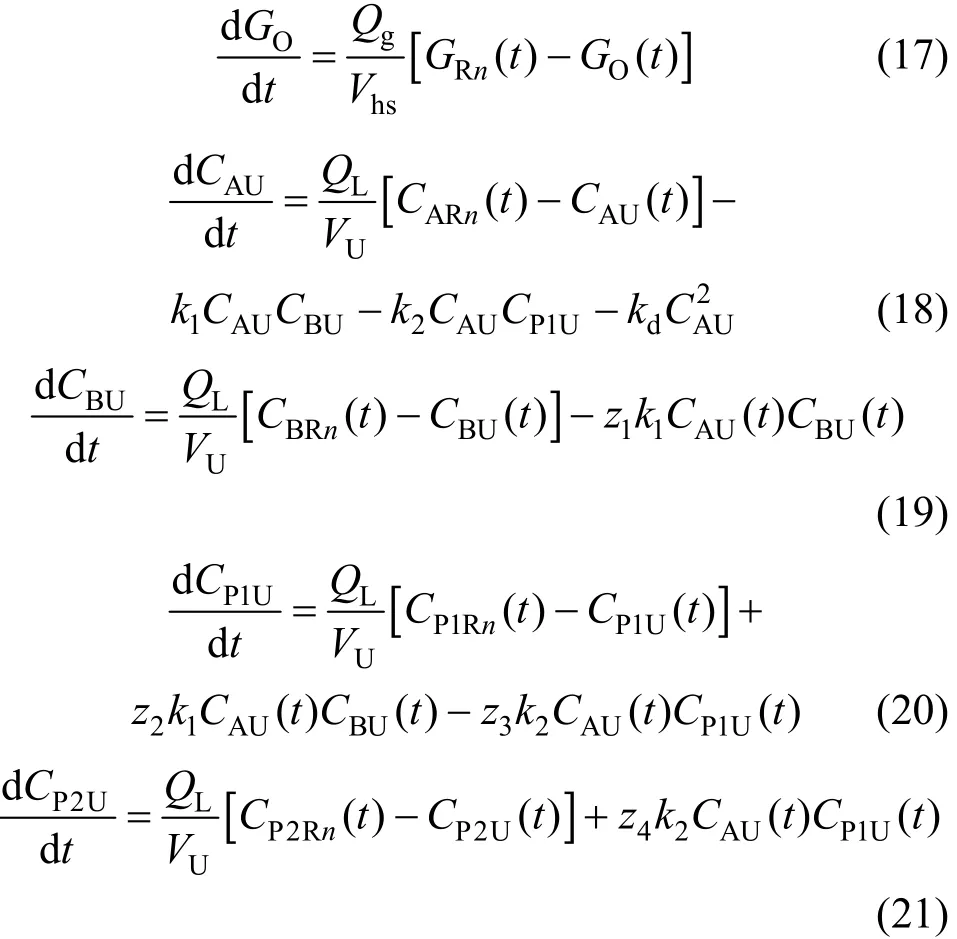
5.2 Model equations for recirculation system
Mass balances for gas and liquid phase ozone,dye, byproducts, and products in the recirculation unit are given below.
The initial conditions for the reactor are:
The initial conditions for the recirculation unit are:
The solution of the model consists of two parts: (1)solution of the mass balance equations for the film,and (2) solution of the mass balance equations for the bulk liquid. The coupled solution of these equations were executed using MATLAB programs, and concentration profiles for ozone and the contaminant in the liquid film, and the concentrations of all the species in the bulk liquid in the reactor were obtained.
6 RESULTS AND DISCUSSION
6.1 Determination of model parameters from experimental data
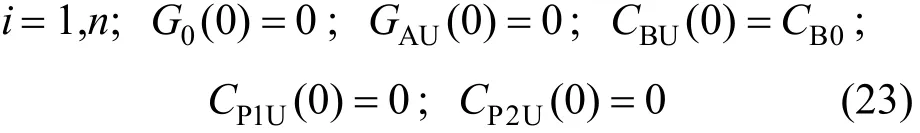
Ozonation studies were conducted with the Reactive Blue 19 (RB-19) dye in the PEO operating in the recycle reactor mode at pH values of 2 and 7. At pH 2,only molecular ozone is expected to be involved in oxidation reactions, whereas at pH 7, both molecular ozone and hydroxyl radicals can mediate reactions.Typically, steady-state conditions were achieved over a period of about 600 to 700 minutes. Fig. 4 displays concentrations of dye, COD, dissolved ozone, and off-gas ozone with an initial dye concentration of 160 mg·L−1, and an in situ ozone generation rate of 46.6 g·m−3. The liquid recycle flow rate through the reactor was 0.05 L·min−1.
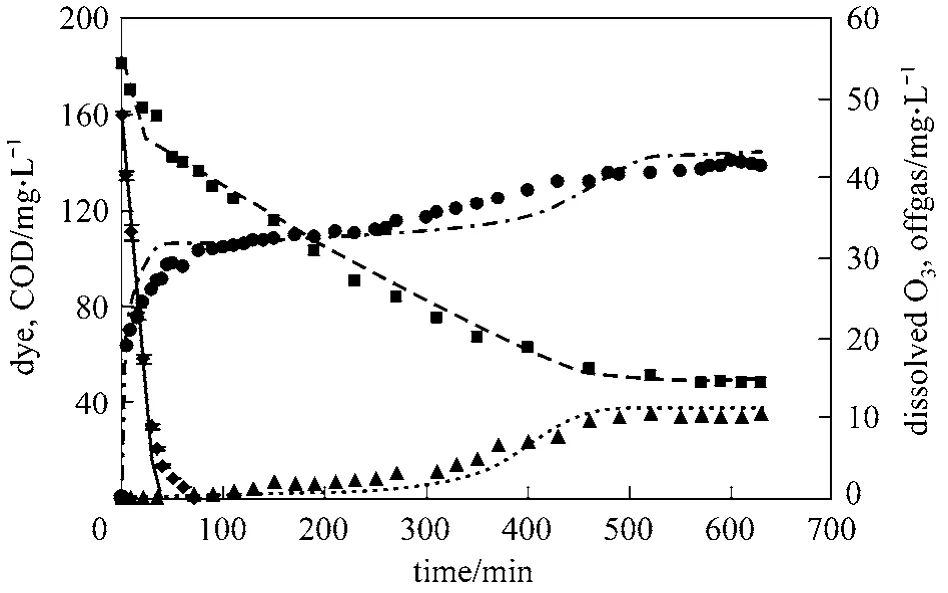
Figure 4 Experimental and model fit for RB-19 oxidation (CB0 160 mg·L−1, Qg 0.05 L·min−1, Ql=0.1 L·min−1, pH 2)◆ dye (Exp.); dye (Mod.); ■ COD (Exp.); COD (Mod.); ▲ ozone (Exp.); ozone (Mod.); ● offgas (Exp.);offgas (Mod.)
As evident from the dye concentration profile,dye decolorization as indicated by Eq. (10) occurs over a short period of time of about 35 minutes. This is a fast reaction, and occurs partly in the liquid film.During this period, the dissolved ozone concentration in the bulk liquid is virtually zero. Thereafter, ozone is consumed in secondary reactions with primary product P1 [Eq. (11)]. This is a slow reaction and occurs primarily in the bulk liquid. At steady-state about 60 mg·L−1of COD remained unreacted. The dissolved ozone concentration begins to increase in the bulk liquid after decolorization, and reaches a maximum steady-state value in equilibrium with the off-gas ozone concentration. At steady-state, the off-gas concentration is equal to the ozone generation rate indicating no further dye COD is being reacted.
The stoichiometric constant z1, was determined from independent experiments to obtain ozone consumption per unit amount of dye reacted in the decolorization step. This was accomplished by using high dye to ozone mole ratios of 5 to 10 in the reaction rate studies. From experiments at three different dye concentrations, z1was estimated to be 8.5 mg dye per mg ozone. The unit for z1is expressed in mg of dye per mg of ozone instead of mole basis for consistency with COD units of mg·L−1for the ozonation byproducts. The stoichiometric factor z2was obtained from the initial portion of the COD curve in Fig. 4 where the dye decolorization is almost complete, and the secondary product formation is negligible. This coefficient was calculated as z2z1(Δ[CODP1]/Δ[dye]).The value of z2was estimated to be 8.2 mg COD per mg ozone. The stoichiometric factor z3, was calculated to be 0.68 mg COD per mg ozone based on ozone the requirement for COD oxidation after decolorization step is complete. The factor z4for secondary products formed from primary products was calculated as 0.23 mg COD per mg COD from the COD left at steady-state.
The rate constants k1and k2, in Eqs. (10) and (11)can be obtained from the dye decolorization data and the dye COD curves in Fig. 4. Using least squares analysis of experimental and computer model generated data, k1was determined to be 1.53×10⁻²L·mg−1·s−1.Using this value for k1in the computer model, k2was determined from least squares analysis of the experimental COD data and the model generated data. The value of k2was estimated as 1.5×10⁻⁴L·mg−1·s−1.
Much of the previous work on modeling of ozonation kinetics has involved representation of the dye decolorization reaction by pseudo-first order kinetics [4, 14]. Rate constant values ranging from 1.9×10⁻²to 3.7×10⁻²were reported for gas phase ozone concentrations ranging from 4.6 mg·L−1to 6.2 mg·L−1.There are no comparable data for k2in the literature.
The mass transfer coefficient KLa, the ozone self-decomposition rate constant kd, and the partition coefficient α, were obtained from independent ozone mass transfer studies conducted with the porous electrode ozonator [15]. The diffusivities of ozone and the RB-9 dye were calculated as 1.36×10⁻⁹m2·s−1and 3.8×10⁻⁹m2·s−1respectively using the Wilke-Chang equation. The liquid mass transfer coefficient for the dye,kLwas obtained using Calderbank and Moo-Young [16]correlation for bubble sizes less than 2.5 mm.
6.2 Model simulation analysis
It is clear from Fig. 4 that the model predictions for the dye, COD, and the dissolved and off-gas ozone concentrations closely match the experimental data.The model can be used to analyze ozone oxidation efficiency under various operating conditions with different values for variables such as gas and liquid flow rates, ozone and dye concentrations, reactor to reservoir volume ratio, and temperature. The extent of reaction in the liquid film for different reactor operating conditions and different solute concentrations can also be ascertained. Fig. 5 shows the model predictions for dye decolorization for three different dye concentrations. The model is seen to represent the data reasonably well. Fig. 6 shows the effect of increasing the reactor volume relative to the recirculation reservoir volume. The experimental reactor volume to reservoir ratio is 0.076. As the reactor to reservoir volume ratio,V is increased to 50%, the time to reach steady-state value for COD changes from 630 minutes to 270 minutes.Increasing V further to 98% provides marginal improvement, as the time to reach steady-state goes down to 250 minutes. Better utilization of ozone is achieved at a V of 50% in that the amount of ozone lost as off-gas is reduced significantly.
Figure 5 Experimental data and model simulations for dye decolorization at various dye concentrations (pH 2,Qg=0.05 L·min−1, Ql=0.1 L·min−1, Gin=46.6 g·m−3)Model, Co=40 mg·L−1; Model, Co=80 mg·L−1;Model, Co=160 mg·L−1; ■ Exp., Co=40 mg·L−1;● Exp., Co=80 mg·L−1; ▲ Exp., Co=160 mg·L−1
6.3 Extents of reaction in film and bulk liquid
The enhancement and depletion factors can be calculated using Eqs. (6) and (7), and the solution of Eqs. (12) and (13) to obtain the variation of E and D as a function of time. Fig. 7 shows the change in dye concentration in the initial time period, and the corresponding changes in E and D values. The E value was 1.34 at the beginning of ozonation, and decreases with dye concentration to reach a value of 1.0 at the end of dye decolorization. D increased from 0.83 at the beginning of the experiment and reached a value of 1.0 at the end of dye decolorization. Ozone mass transfer enhancement at the beginning was 34%, and the value decreased to zero at the end as E reached value of 1.0.
The Hatta number, Ha was 1.05 initially, indicating reaction regime in the intermediate region. This implies that the dye decolorization reaction will occur partly in the film and partly in the bulk liquid. The variation of Ha, and the extent of reaction in the film are shown in Fig. 8. At the beginning of decolorization,about 38% of the reaction occurs in the film, and the remainder in the bulk liquid. At the end of dye decolorization in about 35 minutes, the extent of reaction in the film is zero.

Figure 6 COD, dissolved ozone, and off-gas ozone profiles at different reactor to total volume ratios, V (VT 1.18 L,CBo=160 mg·L−1, pH=2, Qg=0.05 L·min−1, Ql=0.1 L·min−1, Gin 46.6 g·m−3)1—COD, V=0.075; 2—COD, V 0.5; 3—COD, V=0.98; 4—O3g, V 0.075; 5—O3g, V 0.5; 6—O3g, V=0.98; 7—DO3, V 0.075;8—DO3, V=0.5; 9—DO3, V=0.98
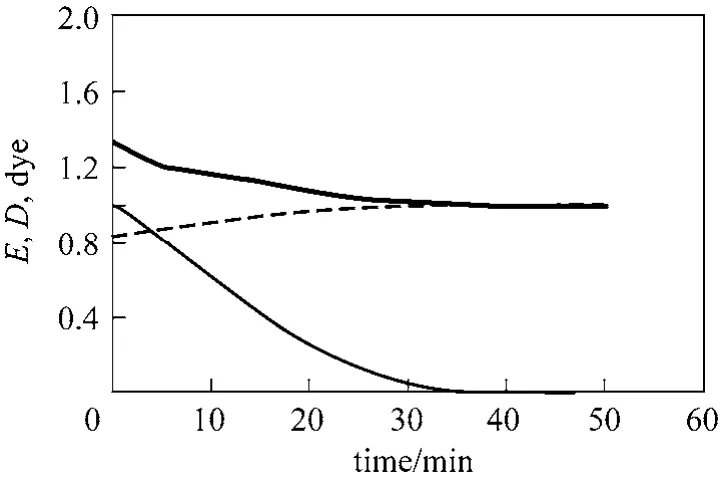
Figure 7 Variation of E and D (CBo=160 mg·L−1, pH 2,Qg=0.05 L·min−1, Ql=0.1 L·min−1, Gin=46.6 g·m−3)E; D; dye
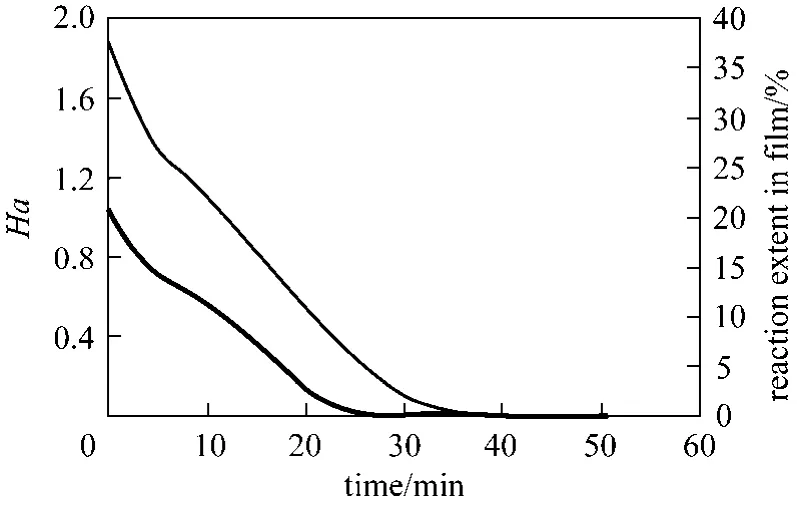
Figure 8 Ha and reaction extent in film (CBo=160 mg·L−1,pH 2, Qg 0.05 L·min−1, Ql0.1 L·min−1, Gin=46.6 g·m−3)Ha; reaction extent in film
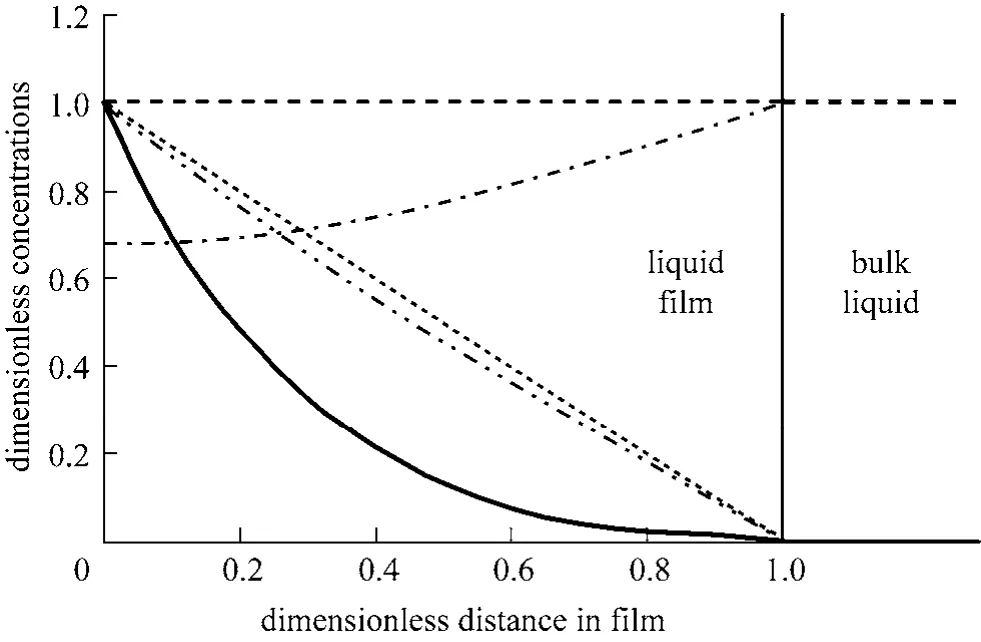
Figure 9 Ozone and dye profiles in the liquid film at the start of ozonation (CBo 160 mg·L−1 and 2 g·L−1, pH=2, Qg 0.05 L·min−1, Ql=0.1 L·min−1, Gin=46.6 g·m−3)ozone (CBo=2 g·L−1); ozone (CBo=0.16 g·L−1); dye (CBo 2 g·L−1); dye (CBo=0.16 g·L−1); ozone(CBo=0 g·L−1)
The Hatta number as given in Eq. (3) is a function of the initial dye concentration, the reaction rate constant between ozone and the dye, mass transfer coefficient of ozone, and the diffusivity of ozone. Reaction kinetics is classified as slow for Ha<0.3, and fast for Ha>3. Ha decreases from 1.05 to 0.52 mg·L−1for initial dye concentrations of 160 mg·L−1and 40 mg·L−1respectively for data shown in Fig. 5. The proportion of reaction occurring in the film, [(E-D)/E]will decrease as the initial dye concentration decreases.Conversely, as the dye concentration is increased,more of the reaction will take place in the film. The dye and ozone concentration profiles for various dye concentrations are shown in Fig. 9. When the dye concentration is zero, the hyphenated line shows the ozone profile in the liquid film. In this case 1E= . As the concentration of dye is increased to 0.16 g·L−1, the ozone profile in the film is curved, and as indicated by Eq. (6) part of the reaction occurs in the film. The extent of reaction is not high enough to reduce the concentration of dye in the film significantly. However, as shown in Fig. 9, at a dye concentration of 2 g·L−1, all of the reaction takes place in the film. The ozone profile is shown by the curved solid line, and the dye profile shown by the hyphenated dotted line. Thus, depending on the concentrations encountered and reaction kinetics, contactors may be selected to obtain best ozonation efficiency. If the reaction is completely in the film,contactors that provide high interfacial area would be most efficient. For reactions occurring in the bulk liquid, bubble columns would be more appropriate.
The reaction rate constant k will also have significant effect on reaction regime with ozone and other reactive species. In the case of hydroxyl radicals(OHo), a reaction rate constant of 9.8×10⁹was reported for reaction of the endocrine disruptor, 17-α ethinylestradiol [17, 18]. In such cases, even at low concentrations,much of the reaction may occur in the film.
7 CONCLUSIONS
A novel porous electrode ozonator wherein ozone is generated in situ and reacts with the contaminated fluid flowing in the porous electrode, was studied to determine mass transfer and ozonation kinetics in the oxidation of a high-molecular mass compound, Reactive Blue 19 dye. The reaction was characterized by a fast decolorization step followed by slower oxidation reaction with the primary ozonation byproducts. A model that includes absorption, reaction in the liquid film, and reaction in the bulk liquid was developed to analyze the overall reaction rate between the dye and ozone. The model represents experimental data well,and can be used to determine the extent of reaction in the film and bulk liquid. For the dye concentrations studied in this work, the decolorization step was found to occur partly in the liquid film and partly in the bulk liquid. However, at higher dye concentrations, model simulations indicate that the reaction will completely occur in the film. The model can be used in the selection of appropriate gas-liquid contactors for efficient ozonation of contaminants in effluents.
ACKNOWLEDGEMENTS
This research was supported in part by a research grant (BES-0209343) from the U.S. National Science Foundation.
NOMENCLATURE
CAdissolved ozone concentration in film
C*equilibrium dissolved ozone concentration
A
CA,bdissolved ozone concentration in bulk liquid
CARdissolved ozone concentration in reactor
CAUdissolved ozone concentration in recirculation unit
CBcontaminant concentration in film
CBoinitial concentration of contaminant
CBRcontaminant concentration in reactor
CBUcontaminant concentration in recirculation unit
CP1Rprimary product concentration in reactor
CP2Rsecondary product concentration in reactor
D depletion factor
DAdiffusivity of ozone in liquid
DBdiffusivity of contaminant in liquid
E enhancement factor
Einstinstantaneous enhancement factor
GOoff-gas ozone concentration
GRgas phase ozone concentration in reactor
Ha Hatta number
KLa overall liquid phase mass transfer coefficient
k overall reaction rate constant between ozone and contaminant
k1decolorization reaction rate constant between ozone and dye
k2reaction rate constant between ozone and primary products
kdozone self-decomposition rate constant
kLliquid film mass transfer coefficient
Qigas flow rate exiting ith compartment in reactor
Qlliquid flow rate to reactor
Qgtotal gas flow rate to reactor
qifeed gas flow rate to ith compartment in reactor
Vhsheadspace volume in recirculation unit
VRvolume of reactor
VUliquid volume in recirculation unit
z stoichiometric coefficient for reaction between A and B [Eq. (5)]
z1, z2stoichiometric coefficients for decolorization reaction [Eq. (10)]
z3, z4stoichiometric coefficients for reaction of ozone with primary products [Eq. (11)]
α gas-liquid partition coefficient for ozone
δLthickness of liquid film
εLliquid hold-up in reactor
εggas hold-up in reactor
Subscripts
i compartment number in reactor
n nth compartment of reactor
1 Driedger, A.M., Rennecker, J.L., Marinas, B.J., “Inactivation of cryptosporidium parvum oocysts with ozone and monochloramine at low temperature”, Water Research, 35, 41-48 (2001).
2 Hunt, N.K., Marinas, B.J., “Inactivation of Escherichia coli with ozone: chemical and inactivation kinetics”, Water Research, 33,2633-2641 (1997).
3 Masten, S.J., “Ozonation of VOCs in the presence of humic acids and soils”, Ozone: Science and Engineering, 13, 287 (1991).
4 Chu, W., Ma, C.W., “Quantitative prediction of direct and indirect dye ozonation kinetics”, Water Research, 34 (12), 3153-3160 (2000).
5 Inanc, B., Ciner, F., Ozturk, I., “Color removal from fermentation industry effluents”, Water Science and Technology, 40, 331-338 (1999).
6 Ahmed, T., Semmens, M.J., “The use of sealed end fibers for bubble-less membrane aeration: experimental studies”, J. Membr. Sci.,69, 1-10 (1992).
7 Padmanabhan, K., Ananthi, S., Patel, K., “Portable ozone generator”,Electronics for You, 32, 46-51 (2000).
8 Mathews, A.P., Panda, K.K., Ananthi, S., Padmanabhan, K., “Mass transfer and oxidation kinetics in an in situ ozone generator”, Water Science and Technology, 49 (4), 19-24 (2004).
9 Danckwerts, P.V., “Gas-Liquid Reactions”, McGraw-Hill, New York,USA, 234 (1970).
10 Levenspiel, O., Chemical Reactions Engineering, 2nd edition, Wiley,New York, USA (1972).
11 Charpentier, J.C., “Mass transfer rates in gas liquid absorbers and reactors”, Advances in Chemical Engineering, Academic Press, 11,1-133 (1981).
12 Oinas, P.A., Wild, G., Midoux, N., Haario, H., “Identification of mass transfer parameters in case of simultaneous gas absorption and chemical reaction”, Chem. Eng. Proc., 34, 503-513 (1995).
13 Benbelkacem, H., Debellefontaine, H., “Modeling of a gas-liquid reactor in batch conditions. Study of the intermediate regime when part of the reaction occurs within the film and part within the bulk”,Chem. Eng. Process., 42, 713-732 (2003).
14 Lall, R., Mutharasan, R., Shah, Y.T., Prasad, D., “Decolorization of the dye, Reactive Blue 19, using ozonation, ultrasound, ultrasoundenhanced ozonation”, Water Env. Res., 75 (2), 171-179 (2003).
15 Panda, K.K., Mathews, A.P., “Mass transfer of ozone in a novel in situ ozone generator and reactor”, J. Environ. Eng., ASCE, 134,860-869 (2008).
16 Calderbank, P.H., Mixing: Theory and Practice, Gary, J.B., Uhl,V.W., eds., Academic Press, New York, USA (1967).
17 Huber, M.M., Ternes, T.A., von Gunten, U., “Removal of estrogenic activity and formation of oxidation products during ozonation of 17 ethinylestradiol”, Environ. Sci. Technol., 39, 5177-5186 (2004).
18 Huber, M.M., Gobel, A., Joss, A., Hermann, N., Loffler, D.,Mcardell, C.S., Ried, A., Siegrist, H., Ternes, T.A., von Gunten, U.,“Oxidation of pharmaceuticals during ozonation of municipal wastewater effluents: a pilot study”, Environ. Sci. Technol., 39 (11),4290-4299 (2005).
2012-02-17, accepted 2012-03-21.
* Supported in part by a research grant (BES-0209343) from the U.S. National Science Foundation.** To whom correspondence should be addressed. E-mail: alex@k-state.edu
杂志排行

Chinese Journal of Chemical Engineering的其它文章
- Flame Imaging in Meso-scale Porous Media Burner Using Electrical Capacitance Tomography*
- Modelling and Fixed Bed Column Adsorption of Cr(VI) onto Orthophosphoric Acid-activated Lignin
- Advances in Large-eddy Simulation of Two-phase Combustion (I)LES of Spray Combustion*
- Top-cited Articles in Chemical Engineering in Science Citation Index Expanded: A Bibliometric Analysis
- Adsorptive Removal of Para-chlorophenol Using Stratified Tapered Activated Carbon Column
- Mass Transfer of Copper(II) in Hollow Fiber Renewal Liquid Membrane with Different Carriers*