Image Reconstruction for Invasive ERT in Vertical Oil Well Logging*
2012-10-31ZHOUHaili周海力XULijun徐立军CAOZhang曹章HUJinhai胡金海andLIUXingbin刘兴斌KeyLaboratoryofPrecisionOptomechatronicsTechnologyMinistryofEducationSchoolofInstrumentScienceandOptoelectronicEngineeringBeihangUniversityBeijing009ChinaPro
ZHOU Haili (周海力), XU Lijun (徐立军),**, CAO Zhang (曹章), HU Jinhai (胡金海) and LIU Xingbin (刘兴斌) Key Laboratory of Precision Opto-mechatronics Technology, Ministry of Education, School of Instrument Science and Opto-electronic Engineering, Beihang University, Beijing 009, China Production Logging Institute, Daqing Logging & Testing Services Company, Daqing 63453, China
Image Reconstruction for Invasive ERT in Vertical Oil Well Logging*
ZHOU Haili (周海力)1, XU Lijun (徐立军)1,**, CAO Zhang (曹章)1, HU Jinhai (胡金海)2and LIU Xingbin (刘兴斌)21Key Laboratory of Precision Opto-mechatronics Technology, Ministry of Education, School of Instrument Science and Opto-electronic Engineering, Beihang University, Beijing 100191, China2Production Logging Institute, Daqing Logging & Testing Services Company, Daqing 163453, China
An invasive electrical resistance tomographic sensor was proposed for production logging in vertical oil well. The sensor consists of 24 electrodes that are fixed to the logging tool, which can move in the pipeline to acquire data on the conductivity distribution of oil/water mixture flow at different depths. A sensitivity-based algorithm was introduced to reconstruct the cross-sectional images. Analysis on the sensitivity of the sensor to the distribution of oil/water mixture flow was carried out to optimize the position of the imaging cross-section. The imaging results obtained using various boundary conditions at the pipe wall and the logging tool were compared. Eight typical models with various conductivity distributions were created and the measurement data were obtained by solving the forward problem of the sensor system. Image reconstruction was then implemented by using the simulation data for each model. Comparisons between the models and the reconstructed images show that the number and spatial distribution of the oil bubbles can be clearly identified.
image reconstruction, electrical resistance tomography, invasive sensor, production logging, vertical well
1 INTRODUCTION
Nowadays, the long-term continuous exploitation of oil is driving some Chinese continental oil fields into high water cut stage. In order to improve oil productivity, the strategies for oil exploration should be adjusted according to the variation of oil production from different oil layers. The production logging (PL)is one of the necessary steps to measure the oil production of respective layers [1]. However, in the case of high water cut, water appears as the continuous phase and oil is in the form of drops. The volumetric concentration of oil is too low to measure the volume fraction accurately, which is extremely difficult for traditional PL methods. Thus we turn to determining the number and spatial distribution of oil drops at different depths. If the number of oil drops over the cross-section at a certain depth is very small, it indicates that the layer at that depth is in lack of oil; if the number of oil drops is very small in one side of the cross-section, the layer in the corresponding direction is in lack of oil, too. In this way, we can determine which oil layer or which direction(s) of a layer should be used or blocked for cost saving. Therefore, it is necessary to develop a PL method suitable for the application of vertical oil well with high water cut.
Although the optical fiber method [2], nuclear method [3], and acoustic method [4] for PL have been studied and applied for a couple of years, the methods based on electrical parameters measurement have been recognised as the most feasible for their high safety,fast response, concise structure, low cost, etc. The electrical sensors used in PL can be roughly classified into two categories: capacitance sensors and conductance sensors. The capacitance sensors, e.g., the capacitance array tool (CAT) [5], are invalid if water is the continuous phase. On the contrary, the conductance sensors are more suitable in the case of high water cut.The conductance sensors that usually consist of a number of electrodes are firstly employed to measure the average thickness of liquid film in vertical annular liquid-gas flow [6]. The conductance sensors are sensitive to the conductivity of the fluid, thus it is more effective and convenient for volume fraction measurement in oil pipes. For example, the resistance array tool (RAT) [7] and the vertical multi-electrode array conductance sensor [8] were used to measure the water cut of the oil/water flows. However, the precision of these sensors are not high because only local information around each electrode is used, and the number of electrodes is limited.
Electrical resistance tomography (ERT) has been investigated extensively during the past decades as a visualization measurement technique [9-15]. By applying excitation signals to the boundary of the region of interest (ROI) and detecting the corresponding responses, ERT can provide cross-sectional images of conductivity distribution in the ROI.
When applied to PL in vertical oil well with high water cut, ERT technique has obvious advantages over other PL techniques. Firstly, unlike the statistics-based techniques, ERT can obtain the data on conductivity distribution over the whole cross-section of the pipeline. Secondly, as the imaging process is real-time and continuous, every single oil drop that flows through the imaging cross-section can be detected. Thirdly, the information on oil drop distribution can be presented in a visible manner through image reconstruction.
In order to fulfil the requirements of PL in vertical well with high water cut, a new ERT sensor was designed and presented in this work. Unlike the traditional ERT sensors, the electrodes of the proposed sensor are not installed in the wall of the pipe [16], but fixed to the logging tool so as to easily translate along the pipelines. As the sensor is invasive and movable,the cross-sectional distributions of oil drops at different depths of the well can be obtained.
In the paper, the invasive ERT sensor will be used to obtain the cross-sectional distributions of oil/water flows. Three dimensional (3D) model of the ERT sensor will be established to analyse the sensitivity field under different conditions. Imaging results of several typical distributions of conductivity were presented to verify the feasibility and effectiveness of the proposed method for vertical oil well logging.
2 SENSOR CONFIGRATION
The invasive ERT sensor is schematically depicted in Fig. 1. It consists of 12 insulating arms and 24 electrodes with two electrodes radially positioned on one arm. The symmetrically distributed arms are used to hold the electrodes and electrical wires.Twelve of the 24 electrodes form a circle electrode ring with a radius of Rinner, while the remaining 12 electrodes form another ring whose radius is Router. The two electrode rings are located on different crosssections. In the actual application, the ERT sensor is mounted on the logging tool for easy translation along the pipelines.
The advantages of the proposed ERT sensor are as follows:
(1) The holding arms can be contracted back into the central shaft for easy transportation within pipelines and stretched open for measurement at desired depths;
(2) The electrodes are distributed on two different cross-sections and the sizes of the electrodes are relatively small compared with the pipeline, thus the flow pattern will be less disturbed;
(3) Under this configuration, various excitation and measurement patterns can be implemented to meet different requirements;
(4) The large number of electrodes can provide a higher spatial resolution;
(5) A cannular insulating cover can be stretched open to coat onto the inner surface of the pipe wall to eliminate the short-circuit effect introduced by the metallic pipe wall.
3 IMAGE RECONSTRUCTION
In ERT, cross-sectional image is used to present the conductivity distribution in the ROI for a visualization purpose. The widely used algorithms for image reconstruction are based on the sensitivity theorem that was first introduced by Geselowitz [17] and Lehr [18].
3.1 Forward problem
In ERT, the measured value of resistance between an electrode pairs is only contributed by the distribution of conductivity in the ROI if the exciting frequency of the electrical field is fixed. Therefore, it is reasonable to assume that there exists a functional relationship between the measured resistances R and the conductivity distribution in the ROI, σ, which can be expressed as

By Taylor series expansion at a local point, Eq. (1)becomes

where (dF/dσ)(∆σ) is the sensitivity of the resistance versus the conductivity and o[(∆σ)2] is the higher order infinitesimal of (∆σ)2. Moving R0to the left side of Eq. (2) results in

In general, ∆σ is very small and o[(∆σ)2] can be ignored,thus Eq. (3) can be simplified to the linear form [19]
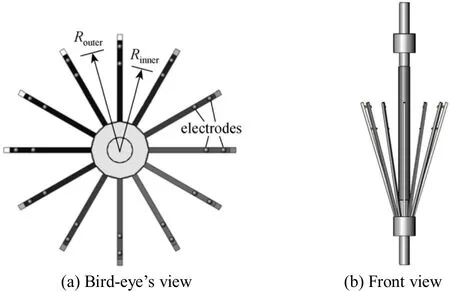
Figure 1 Configuration of the ERT sensor

where s=dF/dσ is the sensitivity of the measured resistance changes versus the conductivity changes in the ROI.
In order to visualize the conductivity distribution,the ROI is uniformly divided into N small pixels with different sensitivity coefficients, and the value of sensitivity coefficient at each pixel will change when different electrode pairs are selected to be in excitation and measurement, respectively. Therefore, in order to reconstruct a cross-sectional image, Eq. (4) has to be discretized. The linearized and discrete form of Eq. (4)can be expressed as

where JDis the discrete form of the Jacobin matrix,i.e., the sensitivity matrix. In order to visualize the conductivity distribution in the ROI, Eq. (5) is generally expressed in another form,

where z is an M×1 vector containing the measured resistance data [∆RDin Eq. (5)], g is the N×1 gray level vector [∆σDin Eq. (5)], S is the M×N sensitivity matrix [JDin Eq. (5)] that contains M sensitivity maps.
3.2 Sensitivity matrix
Consider a volume conductor shown in Fig. 2,the mutual impedance Z is defined by [17]

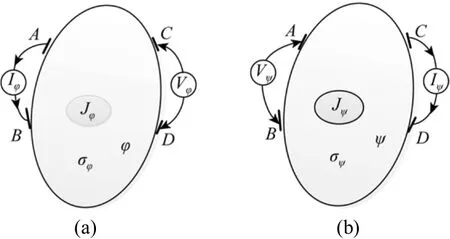
Figure 2 Schematic of a four-terminal excitation and measurement mode for ERT; (a) Current Iφ is applied to the volume through terminal pair AB, the current density and potential distribution associated with it are Jφ and φ,respectively, the conductivity is φσ, and the potential difference between terminal pair CD is CDφ; (b) Current Iψ is applied to the volume through terminal pair CD, the current density associated with it is Jψ, the corresponding potential distribution is ψ, the conductivity is ψσ and the potential difference between terminal pair AB is ABφ
Based on the divergence theorem and the reciprocal theory, Lehr derived a relationship between the mutual impedance changes and the conductivity changes [18], which is

The sensitivity theorem that is suitable to solve the ERT inverse problem can be expressed as

where R is the mutual resistance that is a special case of mutual impedance,iφ andjφ are the potential distributions in the ROI when the i-th and j-th electrode pairs are excited by currentiI andjI, respectively.Sijrepresents the sensitivity distribution when the i-th and j-th electrode pair are in excitation and measurement, respectively. If the unit current is used to excite the conductor volume, Eq. (9) can be simplified to

As the conductivity distribution is composed of N small uniform pixels, the sensitivity coefficient of each pixel can be expressed as [20-22]

where Ωkstands for a discrete 2D area of the k-th pixel, si,j(k) is the sensitivity coefficient at the k-th pixel when the i-th and the j-th electrode pairs are in excitation and measurement, respectively,ikφ is the potential distribution at the k-th pixel when the i-th electrode pair is in excitation whilejkφ is the potential distribution at the k-th pixel when the j-th electrode pair is in excitation.
The configuration of the sensitivity matrix can then be expressed by

In order to reconstruct the conductivity distribution of the ROI, the forward problem, i.e., calculation of the sensitivity matrix, should be carried out first. In this paper, the finite element analysis tool Comsol Multiphysics 3.5a was employed to establish the 3D model of the invasive ERT sensor and to solve the physical equations.
The forward problem is solved by the following steps:
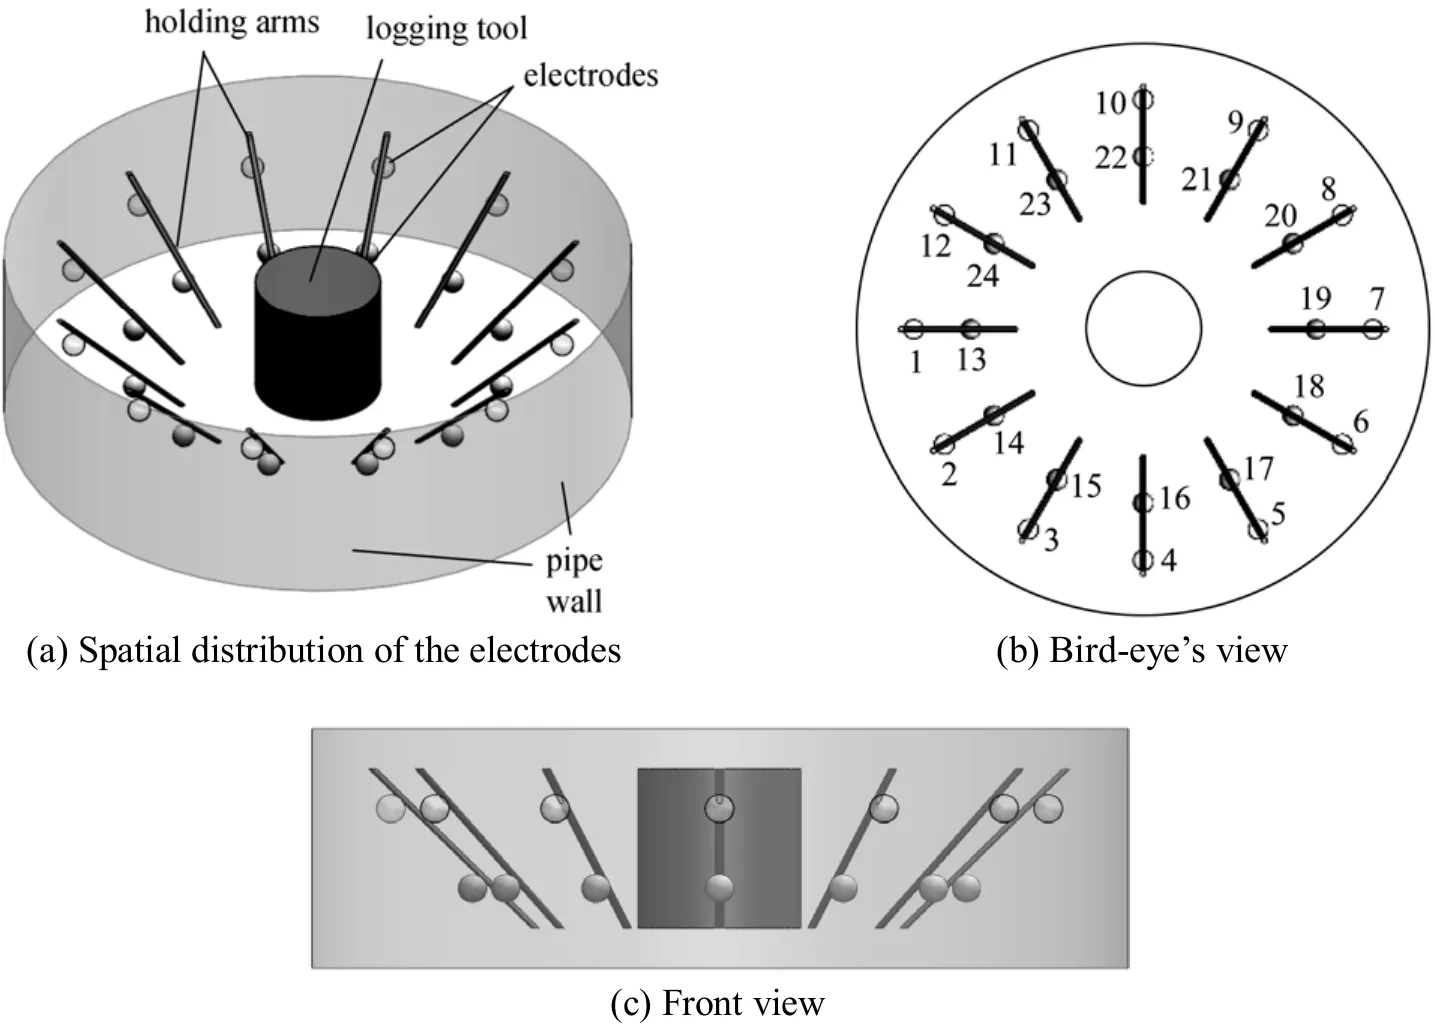
Figure 3 A 3D model of the ERT sensor
(1) Establishment of a 3D model of the ERT sensor. A 3D model of the ERT sensor was established and is shown in Fig. 3. The constituent parts of the sensor are illustrated in Fig. 3 (a). The geometric dimensions of each component are normalized by the radius of the pipe wall and are listed in Table 1. Conductivities of the components are defined in Table 2.To be clearer, the serial numbers of the 24 electrodes are given in Fig. 3 (b).
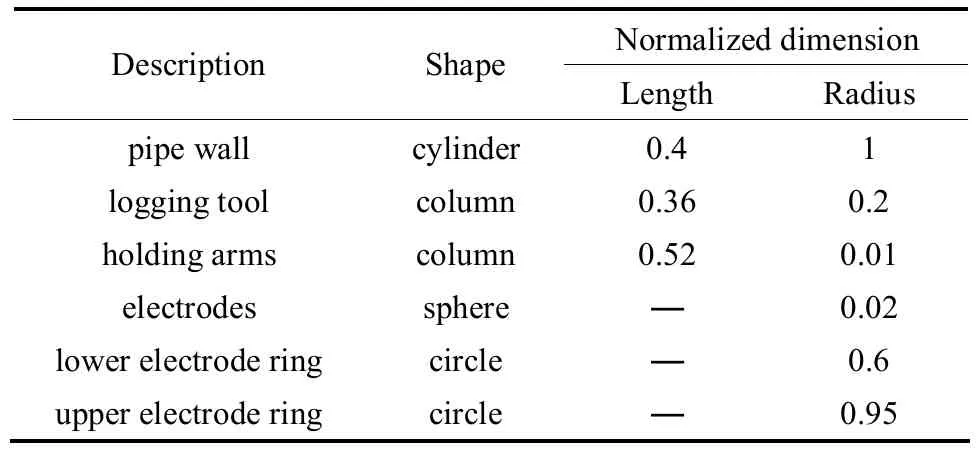
Table 1 Normalized geometric dimensions of the sensor model
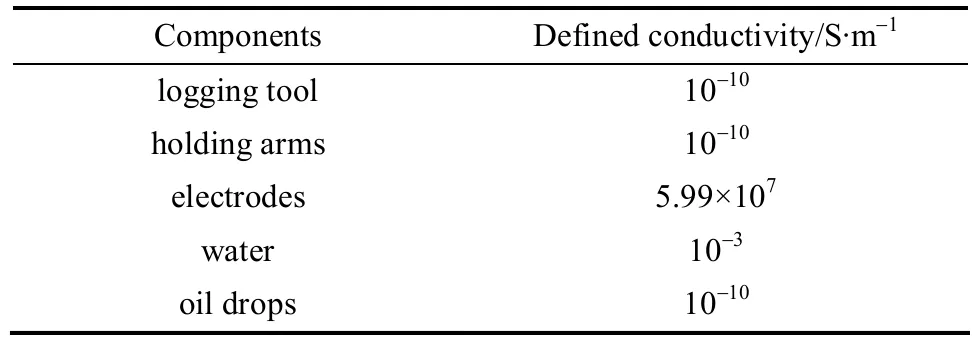
Table 2 Defined conductivities
(2) Establishment of corresponding physical equation. The governing equation of the sensitivity field of ERT can be written as

where σ and φ are the conductivity and the potential distribution in the ROI, respectively.
(3) Set-up of the boundary conditions. In this work, the relevant boundary conditions are electric insulation, ground, current source and continuity, respectively. The mathematical equations, physics meanings and corresponding circuit connections of the four boundary conditions are listed in Table 3. The detail boundary conditions of the model are listed in Table 4.In addition, boundary conditions of the pipe wall and the logging tool will be further discussed in Section 4.1.
(4) Generation of the meshes and solution of the model. The precision of solution can be improved by increasing the number of dissected meshes, but more computer memories and longer computation time are needed to solve the problem. Therefore, to make a trade-off between the computational complexity and precision, the normal mesh dissection pattern provided by Comsol Multiphsics was adopted and the domain of solution was finally dissected into 58511 tetrahedral elements.
(5) Subdivision of the ROI. Select the vertical position of the imaging cross-section, and then subdivide the imaging cross-section into a number of uniform square sub-domains that serve as pixels in the reconstructed images. In this work, the actual number of the pixels is 1800.
(6) Computation of the sensitivity coefficient of each pixel. The electric potential φ and the electric field intensity E satisfy

Table 3 Explanation of the relevant boundary conditions
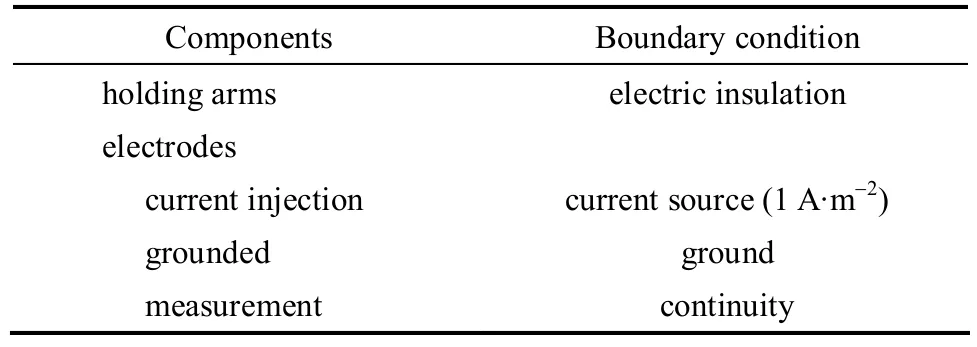
Table 4 Boundary conditions of the ERT model

where Eikand Ejkare the electric field intensity distributions at the k-th pixel when the i-th electrode pair is in excitation and the j-th electrode pair is in measurement. The pixels are so small that it is reasonable to assume that the electric field intensities are the same at every point of the areakΩ when a specified electrode pair is in excitation. Thus Eq. (15) can be further approximated as

where Eikcand Ejkcare the electric field intensities at the centre of the k-th pixel when the i-th electrode pair is in excitation and the j-th electrode pair is in measurement, AΩkis the area of the k-th pixel. Because the ROI is uniformly divided into N pixels, the areas of the N pixels are all the same, i.e.,

Finally, we can obtain the approximate expression that is suitable to calculate the sensitivity coefficients by using the finite element method, i.e.,

where Eikcand Ejkccan be easily obtained by calling the corresponding post-processing functions provided by Comsol Multiphysics.
(7) Set-up of the sensitivity matrix according to Eq. (12). The sensitivity matrix used to solve the inverse problem of ERT can then be obtained by expressing the sensitivity coefficients calculated in Step(6) in a matrix form as Eq. (12) indicates.
3.3 Inverse problem
The task of image reconstruction for ERT is to determine the conductivity distribution of the ROI from the measured resistance vectors. In the discrete form, it is to find the unknown g from the known z using Eq. (6). If the inverse of S exists, Eq. (6) can be directly solved by

However, Eq. (6) is generally an underdetermined problem in ERT, and the inverse of S does not exist,thus an iterative method, i.e., the conjugate gradient(CG) method was employed to solve g from Eq. (6) in this paper.
The CG method, due to its convergence characteristics, is one of the well-known iterative methods for solving a large system of linear equations with an N×N symmetrical and positively defined sparse coefficient matrix.
The solution of the inverse problem is obtained by taking the follow steps:
(1) Pre-compute the sensitivity matrix S.

(2) Measure the resistance changes between different electrode pairs by,where z0is a vector representing the measured resistances between different electrode pairs when the ROI is full of water, z1is a vector representing the measured resistances when there exist oil drops in the water,and ∆z means the resistance changes.
(3) Solve Eq. (6) to obtain g that represents the conductivity changes of each pixel in the ROI by using the CG method.
(a) Multiplying ST(the transposition of the sensitivity matrix) to both sides of Eq. (6) results in

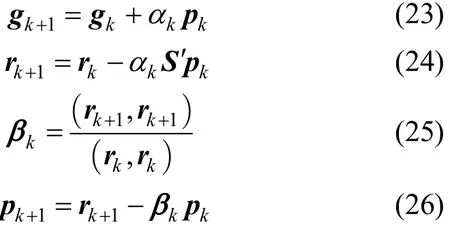
(b) An arbitrary vector g0with the same size as g is selected to be the initial value of g. Let r0= z ′ − S ′g0,and p0=r0, where S′ stands for STS and z′ stands for STz, respectively. Then execute the following iteration operations from Eq. (22) to Eq. (26) until gkfulfils a precision requirement or the iteration time k reaches to an upper limit specified beforehand.

where the operator (X,Y) means the inner product of the vectors X and Y.
4 RESULTS AND DISCUSSION
In order to determine the optimal boundary conditions, to optimize the position of the imaging crosssection and to validate the invasive ERT method, the following numerical simulations were carried out.
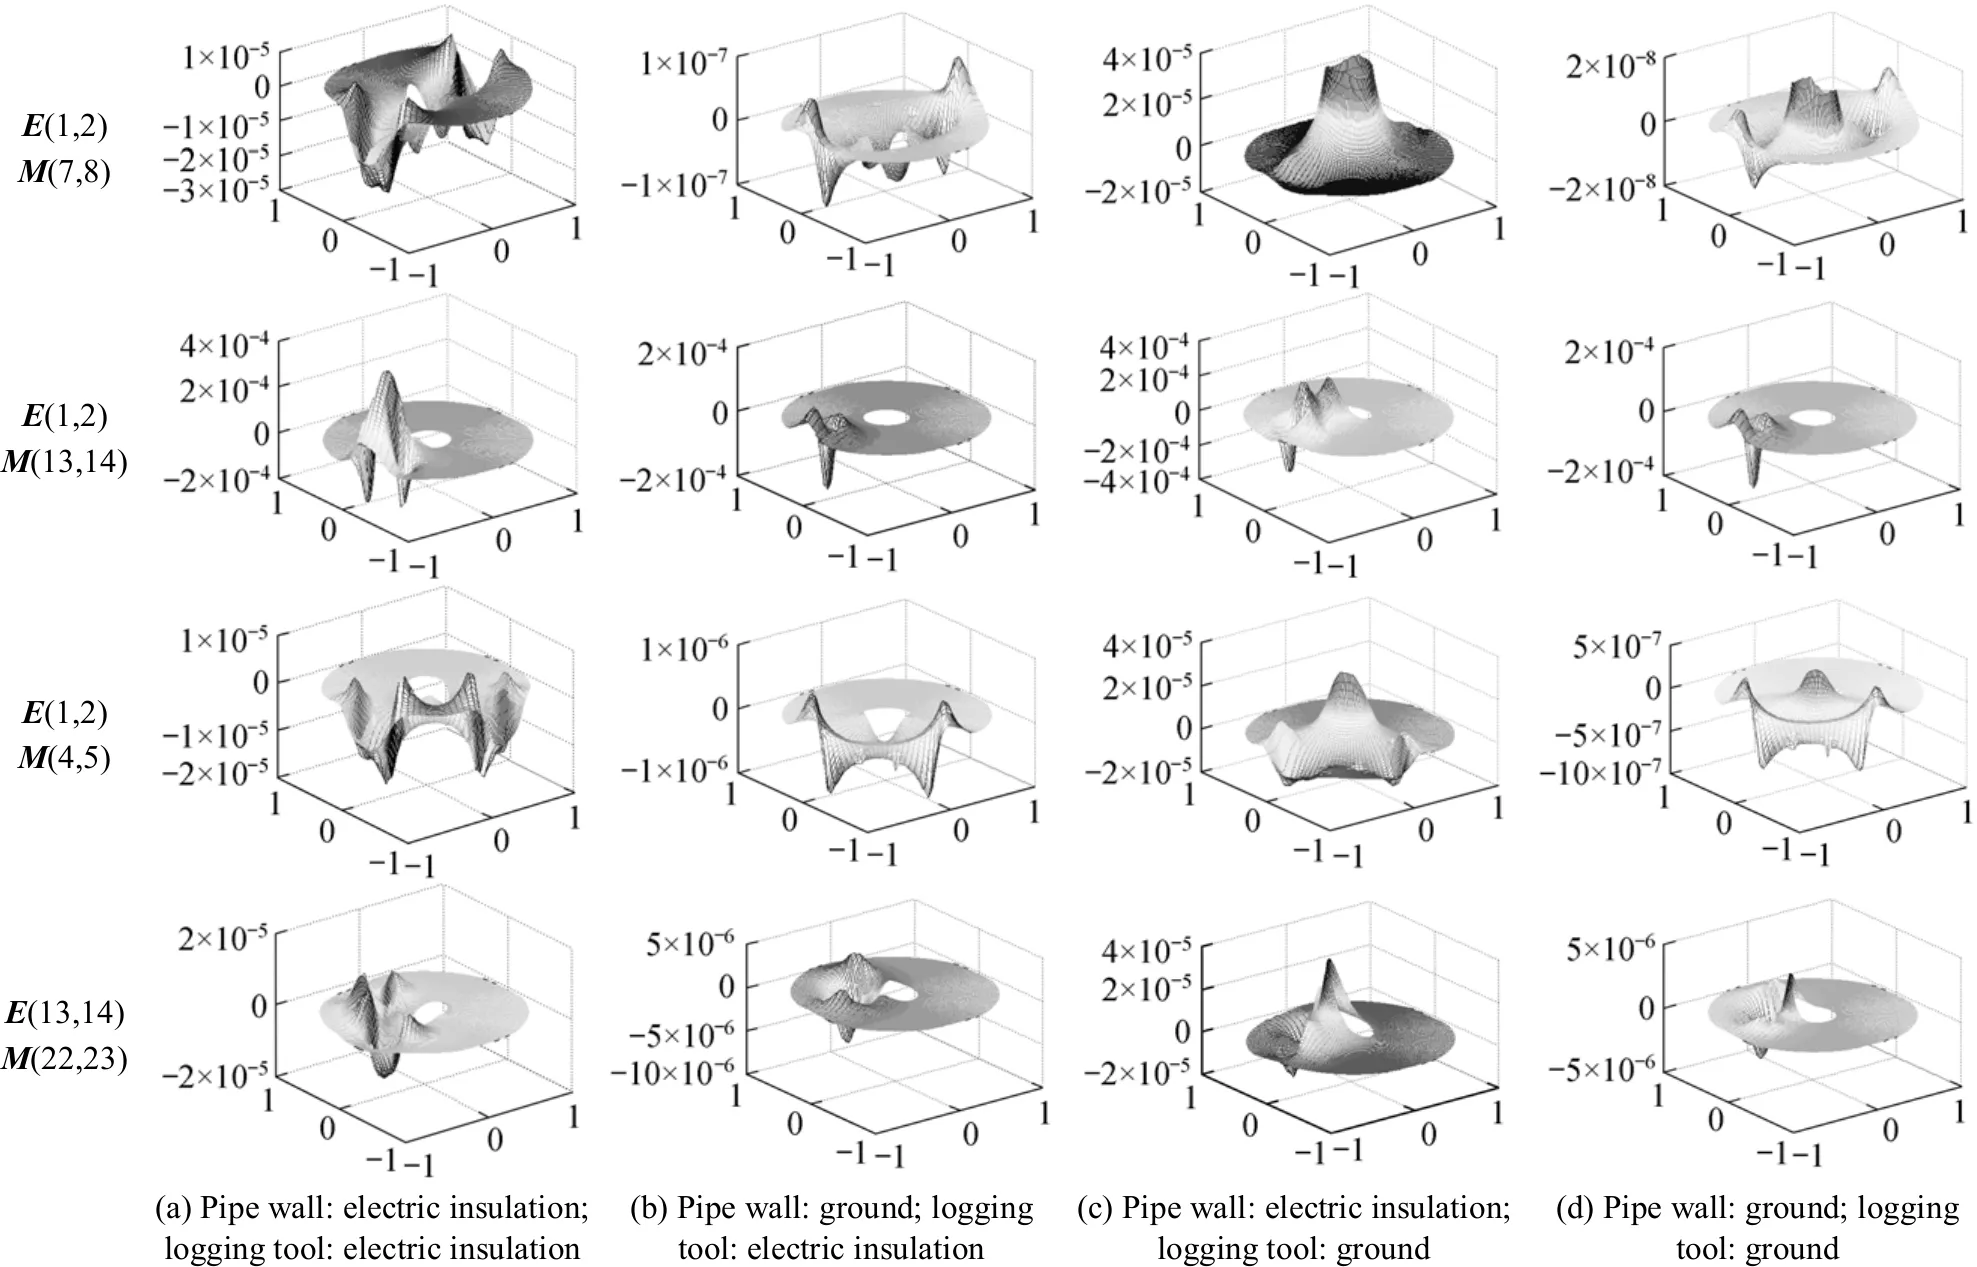
Figure 4 Sensitivity maps under different boundary conditions
4.1 Effect of short-circuit effect
In the oil industry applications, the pipeline and the logging tool are usually made of steel and are grounded for convenient power supply. A great part of current that comes from the excitation electrode pair flows into the grounded pipe wall and logging tool. In other words, the mutual impedance between the excitation and measurement electrode pair is weaken by the impedance between the excitation electrode pair and the grounded pipe wall and logging tool to a great extent.
In order to analyse the effect of short-circuit on the imaging process, the distributions of the ERT sensitivity field have been calculated under different boundary conditions as Table 4 indicates. The normalized geometric dimensions of the sensor and the pipe are listed in Table 1. Four groups of typical sensitivity maps are presented in Fig. 4, and the planelocated at h=0.22 (refer to Fig. 5) was selected to be the imaging cross-section. The images reconstructed under different boundary conditions are listed in Fig. 6.In Figs. 4 and 6, (a), (b), (c) and (d) stand for the boundary conditions described in Table 5; E(i, j) indicates that the i-th and j-th electrodes are in excitation while M(k, l) indicates the k-th and l-th electrodes are in measurement, and the serial numbers of the electrodes are shown in Fig. 3 (b).

Table 5 Boundary conditions of the pipe wall and the logging tool

Figure 5 Positions of the candidate imaging cross-sections (h indicates the position of the imaging cross-section normalized by the radius of the pipe wall)

Figure 6 Comparisons of the images reconstructed (a)-(d) under various boundary conditions with models
From the sensitivity maps shown in Fig. (4), the following conclusions can be drawn: (1) by comparing columns (a) and (b) in Fig. 4, it is shown that if the pipe wall is grounded, the negative sensitivity between the adjacent electrode pairs becomes more negative; and the farther the excitation electrode pair is from the measurement electrode pair, the more the values of the sensitivities decrease; (2) by comparing columns (a) and (c), it can be shown that the grounded logging tool leads to extremely high sensitivities in the centre area and low sensitivities in the fringing areas; (3) the image qualities become the worst if the pipe wall is grounded and the oil drop locates in the fringing areas of the ROI.
In addition, by comparing the reconstructed images under different boundary conditions of the pipe wall and the logging tool, it can also be seen that: (1)if the oil drop is close to the centre of the pipe, both the grounded pipe wall and logging tool will lead to spots of artefact in the background; (2) if the oil drop is in the peripheral area of the pipe, the grounded pipe wall and logging tool will introduce much more spots of artefact and blurring to the boundary of the oil drop or even distort the reconstructed image seriously.
Therefore, in order to obtain the images of high quality, the pipe wall and the logging tool should be insulated, i.e., they should be isolated by dielectric materials. It is feasible to coat the logging tool with insulating materials and stretch open an insulating cover to keep the metal pipe wall out of the sensitivity field when the logging tool is transported to the desired depth.
The results reported in the following parts were obtained on the basis that both the pipe wall and the logging tool are insulated.
4.2 Position of the imaging cross-section
In ERT, the sensitivity field is usually nonuniformly distributed over the imaging cross-section.The sensitivity is higher in the area close to the electrodes and lower in the area away from the electrodes.In general, a uniform sensitivity field is expected to obtain high-quality images.
In order to evaluate the uniformity of the sensitivity field quantitatively and hence select an optimal imaging cross-section with the most uniform sensitivity matrix, an objective function of uniformity (OFU)is introduced, which is defined by

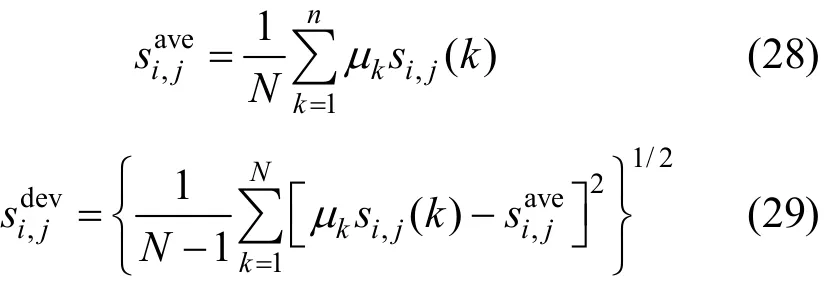
where M is the number of independent measurement,k and N stand for the serial and total numbers of the gridded pixels, respectively, μkis the weight representing the ratio between the area of the k-th pixel and the area of the ROI, si,j(k) indicates the sensitivity coefficient of the k-th pixel with the i-th and the j-th electrode pairs in excitation and measurement, respectively. Obviously, a smaller value of P implies a better uniformity. In the actual computation, the ROI was uniformly divided into 1800 pixels and μkequals to 1/1800 during the calculation.
Therefore, our task is to seek for an imaging cross-section with the least value of P. The lower electrode ring locates at the position h=0.1 and the upper electrode ring locates at the position h=0.3, as shown in Fig. 6, thus the candidate positions of the imaging cross-sections are uniformly distributed from h 0.1 to h 0.3 with an increasing step of 0.01. As the electrodes are spheres with the same radius of 0.1, the starting position is at h 0.111 and the ending position is at h 0.289. The variation of the OFU values with the positions of the imaging cross-sections is shown in Fig. 7. According to Fig. 7, the optimal imaging crosssection should be selected at h=0.22, and the corresponding position is indicated by the dash line in Fig. 5.
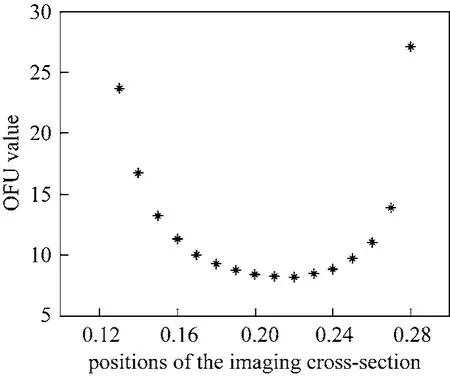
Figure 7 Variation of the OFU value with the position of the imaging cross-section
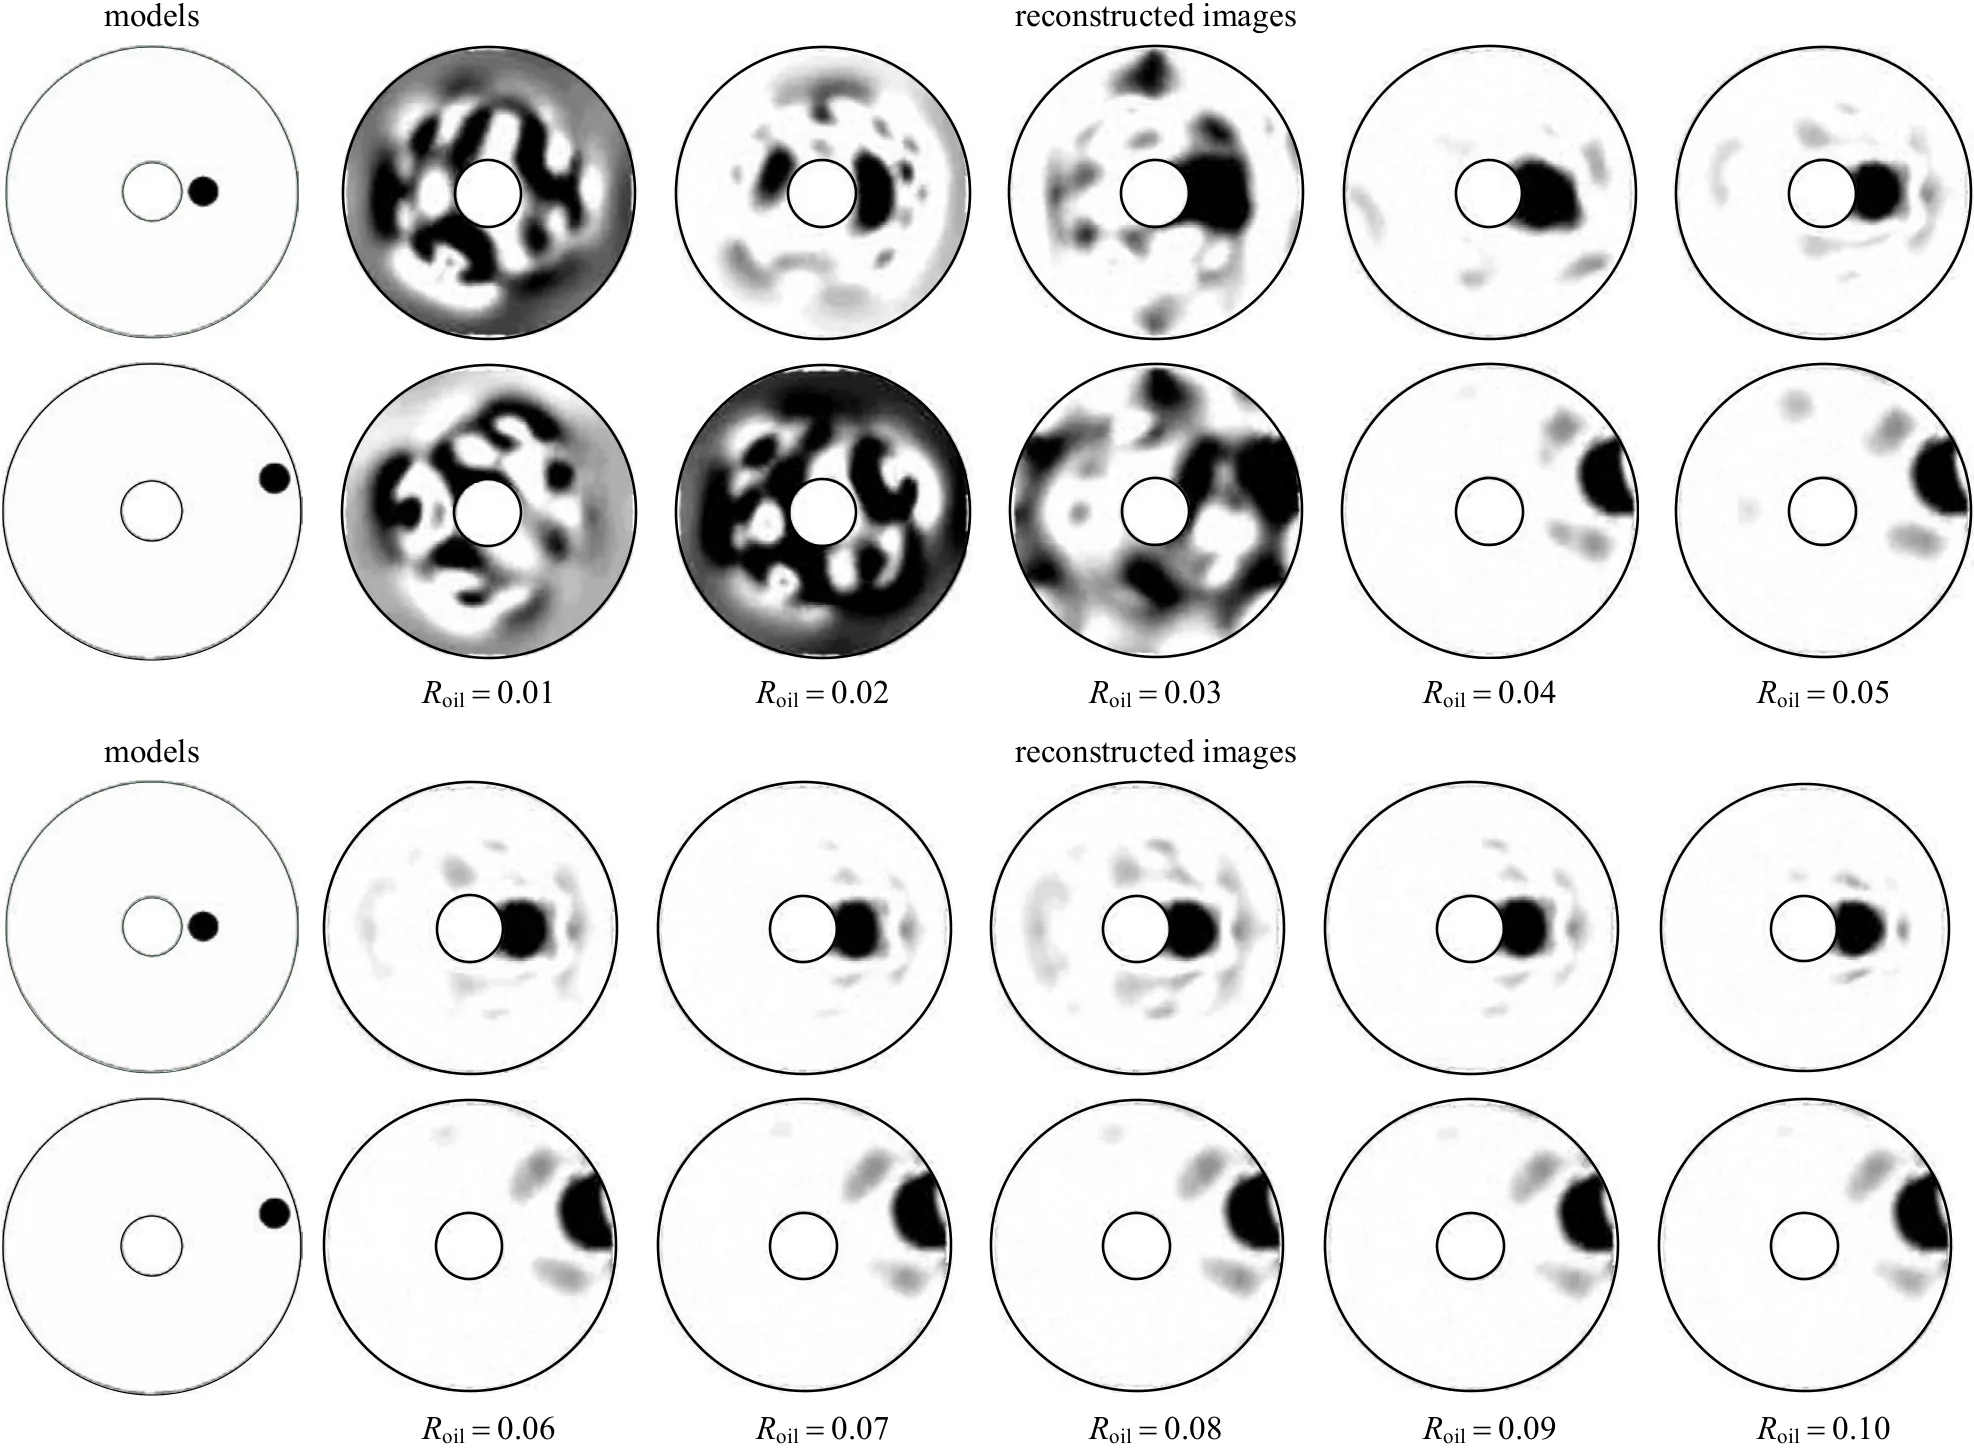
Figure 8 Reconstructed images of oil drops with different sizes (Roil)
4.3 Effect of the oil drop size
In order to test the performance of the proposed invasive ERT method in imaging oil drops with different sizes, a series of simulation experiments have been carried out. The corresponding results are shown in Fig. 8,where the imaging cross-section is selected at h 0.22,the pipe wall and the logging tool are both electrically insulated. In Fig. 8, Roilmeans the radius of the oil drop normalized by the radius of the oil pipe.
In can be seen from Fig. 8 that if the normalized radius of the oil drop is in the range from 0.04 to 0.1,the position and number of the oil drops in water can be clearly identified by using the proposed invasive ERT method and the image quality is slightly influenced by the size of the oil drops; if the normalized radius of the oil drop equals to or less than 0.03, the proposed method will be invalid in distinguishing the oil drops in water. This is in part a result of limited number of electrodes. Adoption of more electrodes may provide us with images of better resolution.However, the number of electrodes cannot be infinitely increased, thus the resolution of reconstructed images cannot be infinitely improved either.
4.4 Image reconstruction results
In order to verify the feasibility and effectiveness of the proposed invasive ERT sensor as well as the sensitivity-based image reconstruction algorithm, the imaging results of the eight models for the oil/water bubble flow are listed in Fig. 9, where the normalized radius of the oil drops is 0.07, the imaging cross-section is located at h=0.22 (refer to the dash line in Fig. 6) and the pipe wall and the logging tool are both electrically insulated.
It is shown by Fig. 9 that the reconstructed images agree well with the models of oil/water bubble flow. The number and spatial distribution of oil drops can be clearly distinguished wherever they locate in the pipeline. It is also shown that if the oil drops are closer to the centre of the pipeline, the reconstructed images are of more acceptable qualities according to the shape and location of the oil drops.
4.5 Discussion
The purpose of the paper is to introduce a new method for PL in vertical oil wells with high water cut.Although only preliminary results were obtained, the effectiveness of the invasive ERT sensor for PL in vertical oil wells has been demonstrated by numerical simulations.
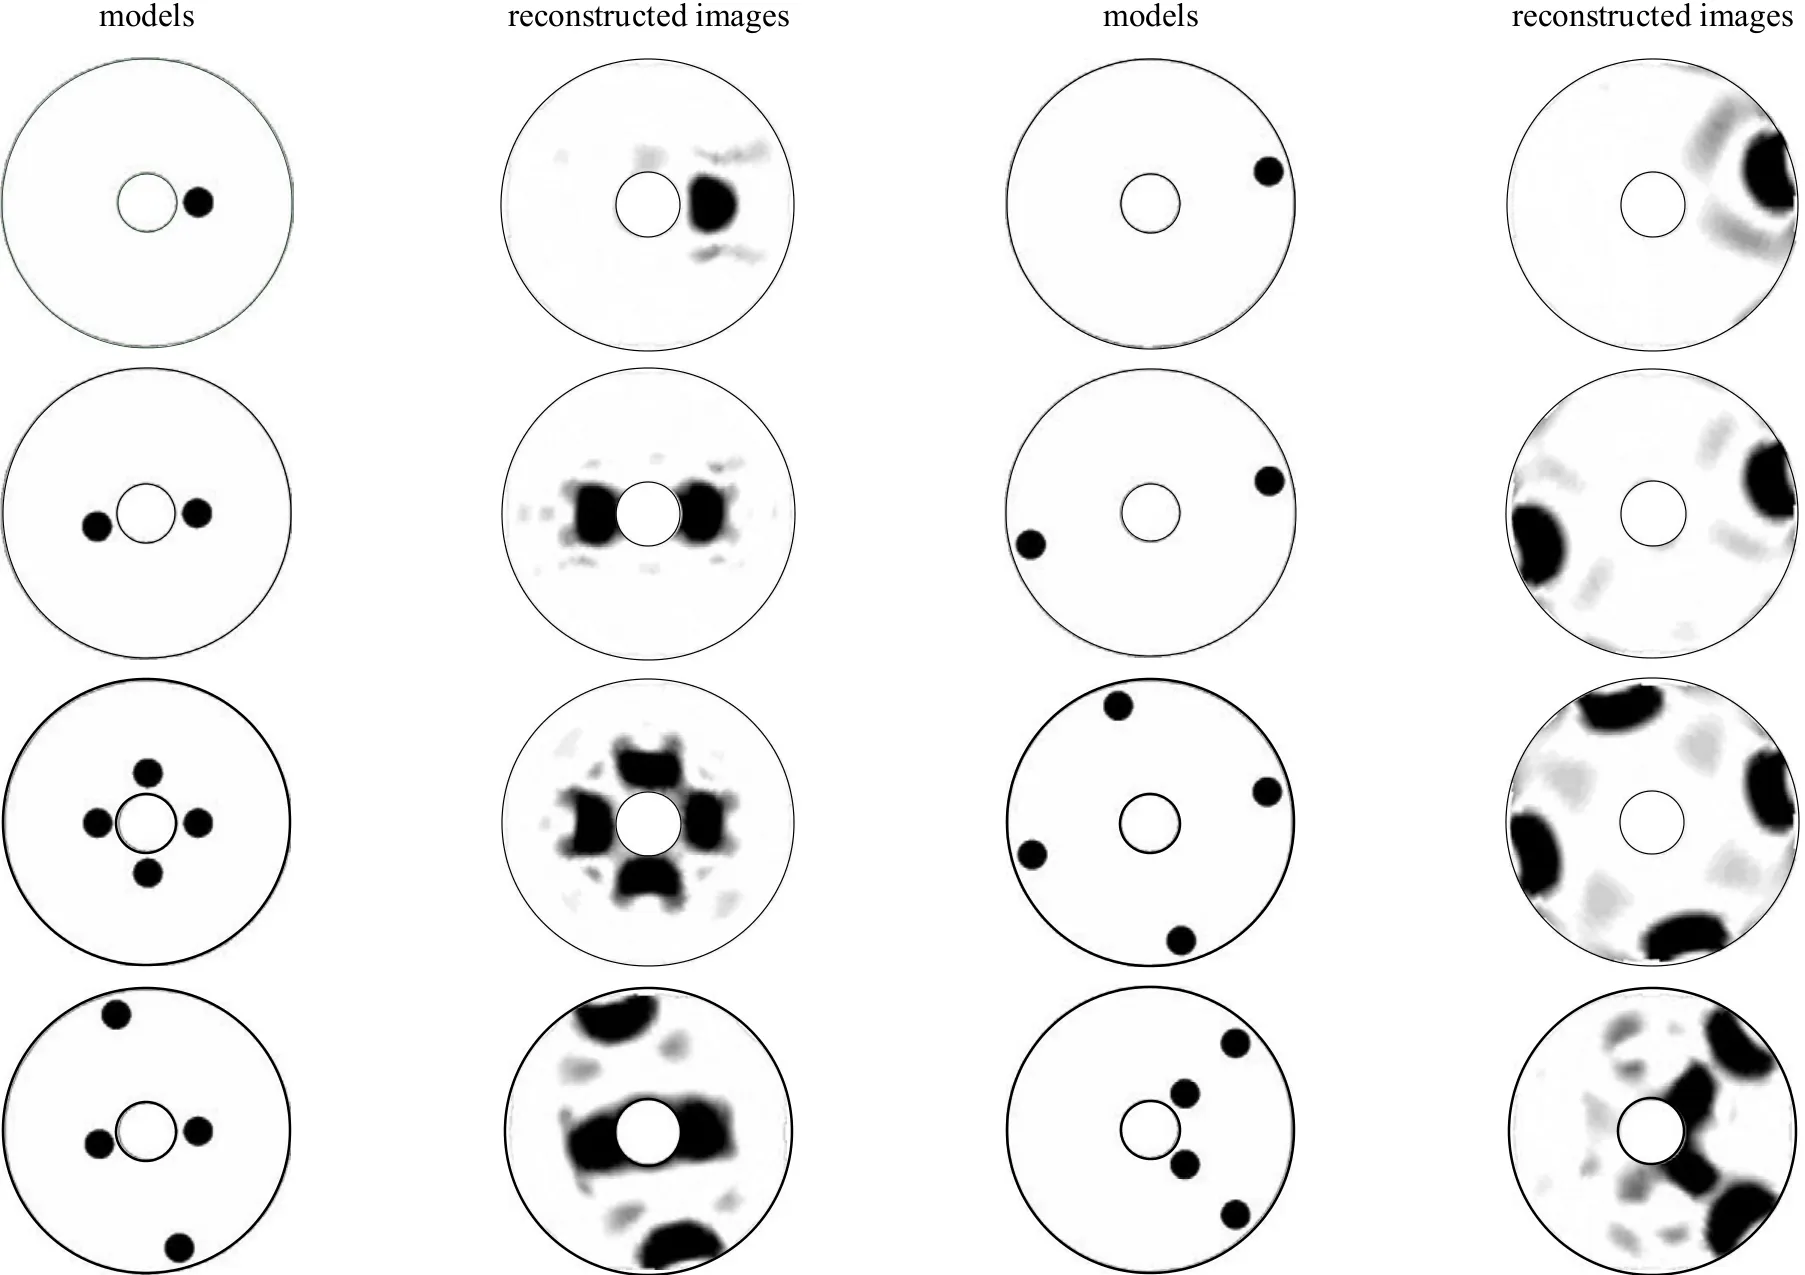
Figure 9 Image reconstruction results
In this paper, the pipe wall and the central shaft of the instrument were all treated as insulated. This is feasible if the logging tool is covered by an insulating layer and a cannular insulating cover is stretched open to insulate the metal wall of the well pipe from the sensing field when the logging tool is at a desired position. However, some researchers have shown that ERT system can work well for multiphase measurement with metal walled vessels and pipelines by adopting appropriate excitation and measurement strategies [23-25]. Therefore, applicability of the proposed sensor in pipes with metal wall and metal central shaft is also worth studying.
Although the qualities of the reconstructed images are acceptable for the application of vertical oil well logging with extremely high water cut, there still exits the problem that with the increase of the oil drop numbers, the qualities of the reconstructed images will get worse and more spots of artefact appear in the images. It is because that the sensitivity theorem based image reconstruction method is implemented on the assumption that the change of the conductivity ∆σ in the ROI is relative small and only in a local area [refer to Eqs. (3) & (4)], and the method will be not so proper if there are too many oil drops, i.e., the conductivity changes too much.
It is also worth mentioning that the proposed invasive ERT technique can be applied not only in oil industries but also in other industrial applications.
5 CONCLUSIONS
An invasive ERT sensor as well as the corresponding sensitivity-based image reconstruction algorithm for production logging in vertical oil wells was introduced. Compared with traditional ERT sensors,the sensor proposed in this paper is invasive and moveable, which is more suitable for production logging applications. It can provide cross-sectional images at different depths and offer the possibility to eliminate the short-circuit effect caused by the metallic pipe wall. Simulation results by using eight models of oil/water bubble flow have demonstrated that the invasive ERT sensor together with the sensitivitybased reconstruction algorithm is effective to provide cross-sectional images of an oil/water bubble flow. The drops over the cross-section can be well distinguished.
1 Whittaker, A.C., Lenn, C.P., Hammond, P., “Improving multiphase production logging answers with the mass-fraction spinner response model for gas-liquid flows”, Pertrophysics, 47 (2), 253-262 (1986).
2 Tor, K.K., Gregory, A.M., Gill, E.P., Dennis, E.D., Frederick, H.R.,“Downhole fiber-optic multiphase flowmeter: Design, operating principle, and testing”, In: SPE Annual Technical Conference and Exhibition, Society of Petroleum Engineers Inc., USA, 2719-2725(2002).
3 Morris, C., Aswad, T., Morris, F., Quinlan, T., “Reservoir monitoring with pulsed neutron capture logs”, In: SPE Annual Technical Conference and Exhibition, Society of Petroleum Engineers Inc., Madrid,Spain, USA, 363-378 (2005).
4 Daniel, L.G., Tom, B., “Accurate liquid phase density measurement of aerated liquids using speed of sound augmented coriolis meters”,Technical Papers of ISA, 454, 217-226 (2004).
5 Halliburton Inc., “Capacitance Array Tool”, http://www.halliburton.com/public/lp/contents/Data_Sheets/web/-H/H06275.pdf, 2010-12-5 (2008).
6 Asali, J.C., Hanratty, T.J., Paolo, A., “Interfacial drag and film height for vertical annular flow,” AIChE J., 31 (6), 895-902 (1985).
7 Halliburton Inc., “Resistance Array Tool”, http://www.halliburton.com/public/lp/contents/Data_Sheets/web/H/H0-6292-A4.pdf, 2010-12-5(2008).
8 Jin, N.D., Wang, J., Xu, L.J., “Optimization of a conductance probe with vertical multi-electrode array for the measurement of oil-water two-phase flow”, In: Proceedings of the 2nd International Conference on Machine Learning and Cybernetics, Xi’an, China 899-905(2003).
9 Dong, F., Liu, X.P., Deng, X., Xu, L.J., Xu, L.A., “Identification of two-phase flow regimes in horizontal, inclined and vertical pipes”,Meas. Sci. Technol., 12 (8), 1069-1075 (2001).
10 Li, Y., Yang, W.Q., “Measurement of multi-phase distribution using an integrated dual-modality sensor”, In: IEEE International Workshop on Imaging Systems and Techniques, Shenzhen, China,335-339 (2009).
11 Trevor, Y., “Status of electrical tomography in industrial applications”, J. Electron. Imag., 10 (3), 608-619 (2001).
12 Tan, C., Dong, F., “Gas-water two-phase flow regime identification with feature fusion from an ERT system and a V-cone meter”, In:IEEE International Workshop on Imaging Systems and Techniques,Shenzhen, China, 307-312 (2009).
13 Dong, F., Xu, Y.B., Hua, L., Wang, H.X., “Two methods for measurement of gas-liquid flows in vertical upward pipe using dual-plane ERT system”, IEEE Trans. Instrum. Measur., 55 (5), 1576-1586(2006).
14 Hua, S., Dong, F., “Flowrate measurement with characteristic value cross-correlation by ERT in two-phase vertical pipe flows”, In: Proceedings of the 5th International Conference on Machine Learning and Cybernetics, Dalian, China, 1428-1432 (2006).
15 Meng, Z.Z., Huang, Z.Y., Wang, B.L., Ji, H.F., Li, H.Q., “Flowrate measurement of air-water two-phase flow using an electrical resistance tomography sensor and a venturi meter”, In: Proceedings of IEEE International Instrumentation and Measurement Technology Conference, Singapore, 118-121 (2009).
16 Cao, Z., Wang, H.X., Yang, W.Q., Yan, Y., “A calculable sensor for electrical impedance tomography”, Sensors Actuators A Phys., 140(2), 156-161 (2007).
17 Geselowitz, D.B., “An application of electrocardiographic lead theory to impedance plethysmography”, IEEE Trans. Biomed. Eng., 18(1), 38-41 (1971).
18 Lehr, J., “A vector derivation useful in impedance plethysmographic field calculations”, IEEE Trans. Biomed. Eng., 19 (2), 156-157 (1972).
19 Yang, W.Q., Peng, L.H., “Image reconstruction algorithms for electrical capacitance tomography”, Meas. Sci. Technol., 14 (1), R11-R13(2003).
20 Murai, T., Kagawa, Y., “Electrical impedance computed tomography based on a finite element model”, IEEE Trans. Biomed. Eng., 32 (3),177-184 (1985).
21 Barber, D.C., “Quantification in impedance imaging”, Clin. Phys.Physiol. Meas., 11 (A), 45-46 (1990).
22 Breckon, W.R., Pidcock, M.K., “Mathematical aspects of impedance imaging”, Clin. Phys. Physiol. Meas., 8 (A), 77-84 (1987).
23 Wang, M., Dickin, F.J., Williams, R.A., “Electrical resistance tomography of metal walled vessels and pipelines”, Electron. Lett., 30(10), 771-773 (1994).
24 Dickin, F.J., Wang, M., “Electrical resistance tomography for process applications”, Meas. Sci. Technol., 7 (3), 247-260 (1996).
25 Davidson, J.L., Ruffino, L.S., Stephenson, D.R., Mann, R., Grieve,B.D., York, T.A., “Three-dimensional electrical impedance tomography applied to a metal-walled filtration test platform”, Meas. Sci.Technol., 15 (11), 2263-2274 (2004).
2011-11-28, accepted 2012-01-20.
* Supported by the National Natural Science Foundation of China (61001135) and the Fundamental Research Funds for the Central Universities (YWF-11-03-Q-072).
** To whom correspondence should be addressed. E-mail: lijunxu@buaa.edu.cn
猜你喜欢
杂志排行
Chinese Journal of Chemical Engineering的其它文章
- Optimization for Production of Intracellular Polysaccharide from Cordyceps ophioglossoides L2 in Submerged Culture and Its Antioxidant Activities in vitro*
- A Pilot-scale Demonstration of Reverse Osmosis Unit for Treatment of Coal-bed Methane Co-produced Water and Its Modeling*
- ECT Image Analysis Methods for Shear Zone Measurements during Silo Discharging Process*
- Temperature-triggered Protein Adsorption and Desorption on Temperature-responsive PNIPAAm-grafted-silica: Molecular Dynamics Simulation and Experimental Validation*
- Adsorptive Thermodynamic Properties and Kinetics of trans-1,2-Cyclohexandiol onto AB-8 Resin
- Tracking Submicron Particles in Microchannel Flow by Microscopic Holography*
