黄、东海春季和秋季微型浮游动物对浮游植物的摄食压力
2011-09-24张武昌张翠霞
张武昌, 张翠霞,, 王 荣, 肖 天
(1. 中国科学院 海洋研究所海洋生态和环境科学重点实验室, 山东 青岛 266071; 2. 中国科学院 研究生院,北京 100049)
黄、东海春季和秋季微型浮游动物对浮游植物的摄食压力
张武昌1, 张翠霞1,2, 王 荣1, 肖 天1
(1. 中国科学院 海洋研究所海洋生态和环境科学重点实验室, 山东 青岛 266071; 2. 中国科学院 研究生院,北京 100049)
2000年秋季(10月21日-11月7日)和2001年春季(4月30日-5月15日)用稀释培养法在黄海和东海测定了微型浮游动物对浮游植物的摄食, 结果表明: (1)秋季表层浮游植物叶绿素a(Chla)的内禀生长率为0.40~0.59 d−1, 微型浮游动物对Chla的摄食率为0.21~0.63 d−1, 对Chla现存量的摄食压力为19%~47% d−1, 对Chla生产力的摄食压力为59%~108% d−1。深层Chla的内禀生长率为0.25~0.65 d−1, 微型浮游动物对Chla的摄食率为0.29~0.53 d−1, 对浮游植物Chla现存量的摄食压力为25%~41%d−1, 对 Chla生产力的摄食压力为 86%~114% d−1。(2) 春季表层Chla的内禀生长率为0.01~0.81 d−1, 微型浮游动物对Chla的摄食率为0.13~0.54 d−1, 对Chla现存量的摄食压力为12%~42% d−1, 对Chla生产力的摄食压力为21%~3920% d−1。深层Chla的内禀生长率为0.55~0.60 d−1, 微型浮游动物对Chla的摄食率为0.57%~0.63 d−1, 对Chla现存量的摄食压力为44%~47% d−1, 对Chla生产力的摄食压力为103%~104% d−1。
微型浮游动物; 稀释培养; 摄食压力; 黄海; 东海
微型浮游动物(Microzooplankton)是指体长小于200 µm的浮游动物[1], 分属于原生动物的纤毛虫、鞭毛虫和后生动物桡足类的幼虫等。微型浮游动物在细菌、微型浮游生物和大型浮游动物之间起中枢作用[2]。微型浮游动物对浮游植物的摄食和浮游植物的生长是海洋浮游生态学研究的重要参数, 已在世界许多海区用稀释培养的方法研究了微型浮游动物对浮游植物的摄食压力[3]。但是, 在黄、东海微型浮游动物对浮游植物的摄食压力的研究并不多[4-6], 这些研究进行的稀释培养实验主要是海洋表层水的培养,本文报道2000年秋季和2001年春季在黄东海进行的稀释培养, 其中有4次是在深层水进行的培养, 为这一海区提供基础资料和参数。
1 材料与方法
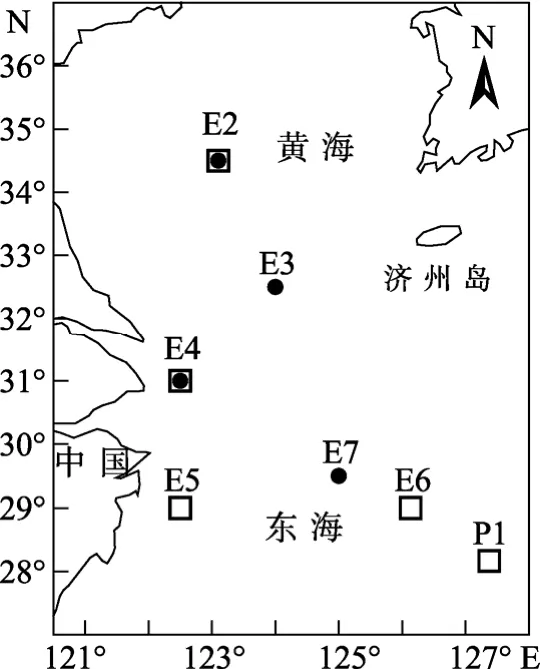
2000年秋季(10月21日-11月7日)和2001年春季(4月30日-5月15日), “东方红2号”科学考察船在黄、东海(图 1)进行调查, 秋季的调查站位共 4个, 春季的站位有5个, 站位水深(表1)最浅为20 m(E4), 最深为1000 m (P1)。
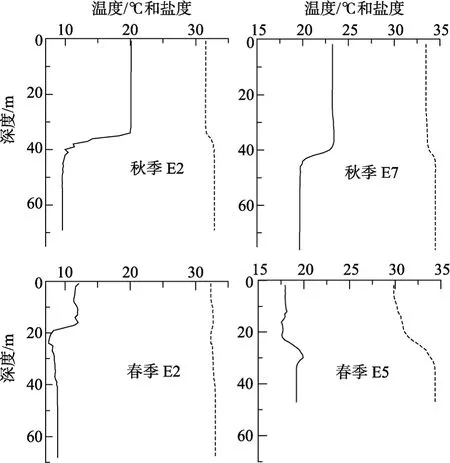
调查船在每一站位抛锚27 h, 在此期间用CTD测量水体不同深度的温度、盐度, 用Rosette采水器采水, 进行稀释培养实验。在每个站都进行了表层水的稀释培养试验。根据温度盐度剖面(图 2), 在个别站位还在温度跃层附近采水[秋季: E2站的42 m和E7站的20 m(该站流大, 培养瓶放的深度较浅, 所以只好采较浅的水); 秋季: E2站的25 m和E5站的25 m]进行了稀释培养。

图1 调查站位图Fig. 1 Investigation stations

图2 秋季和春季有深层培养站位的温度(实线)和盐度(虚线)的垂直分布Fig. 2 Vertical profiles of temperature (solid line) and salinity (dashed line) at stations with deep-water incubation.
稀释培养[7]按照按UNESCO[8]方法进行。10%盐酸浸洗1.3 L的聚碳酸酯瓶10 h以上, 使用前用现场海水冲洗。采水器采水 20 L, 一部分海水用 GF/F®滤膜过滤, 称为过滤海水, 另一部分海水用 200 µm筛绢过滤以除去大于200 μm的浮游动物, 称为原始海水。将过滤海水与原始海水按一定比例混合, 稀释度d为原始海水体积与混合后总体积的比值。将过滤海水和原始海水按0:1, 1:3, 1:1, 3:1 的比例(稀释度分别为1、0.75、0.5、0.25)混合, 在每个稀释度采水500 mL, 用于测定叶绿素a(Chla)浓度, 剩余海水分装于聚碳酸酯瓶中, 每个稀释度有2个平行样。培养瓶用网包住放入果品箱, 果品箱用绳索吊在采水深度进行培养24 h。培养后, 每瓶采水500~1000 mL,用于测定Chla浓度。
用于测定Chla浓度的水样采集后, 用GF/F®滤膜过滤, 滤膜在−20 °C保存, 一个月内测定。测定时,用10 mL浓度为90%的丙酮−20°C黑暗中提取滤膜上的Chla, 用Turner II型荧光光度计测量Chla浓度[9]。
假设原始海水中浮游植物的内禀生长率为k, 微型浮游动物的摄食率为g, 浮游植物处于指数增长期,培养前浓度为P0, 培养后Pt, 那么,Pt=P0e(k−g)t, 表观生长率 ln(Pt/P0)/t=k−g, 混合海水中, 浮游植物的生长率k不会改变, 微型浮游动物的摄食率却因动物数量的减少而按比例降低, 变为d×g。培养时间t以后,Pt=P0e(k−d×g)t, 表观生长率 ln(Pt/P0)/t=k−d×g。k和g是通过4个稀释度培养瓶中的Chla表观生长率对稀释度的回归求得。
微型浮游动物对 Chla现存量和初级生产力的摄食压力(分别用Pi和Pp表示)用下列公式求出[10]:

2 结果
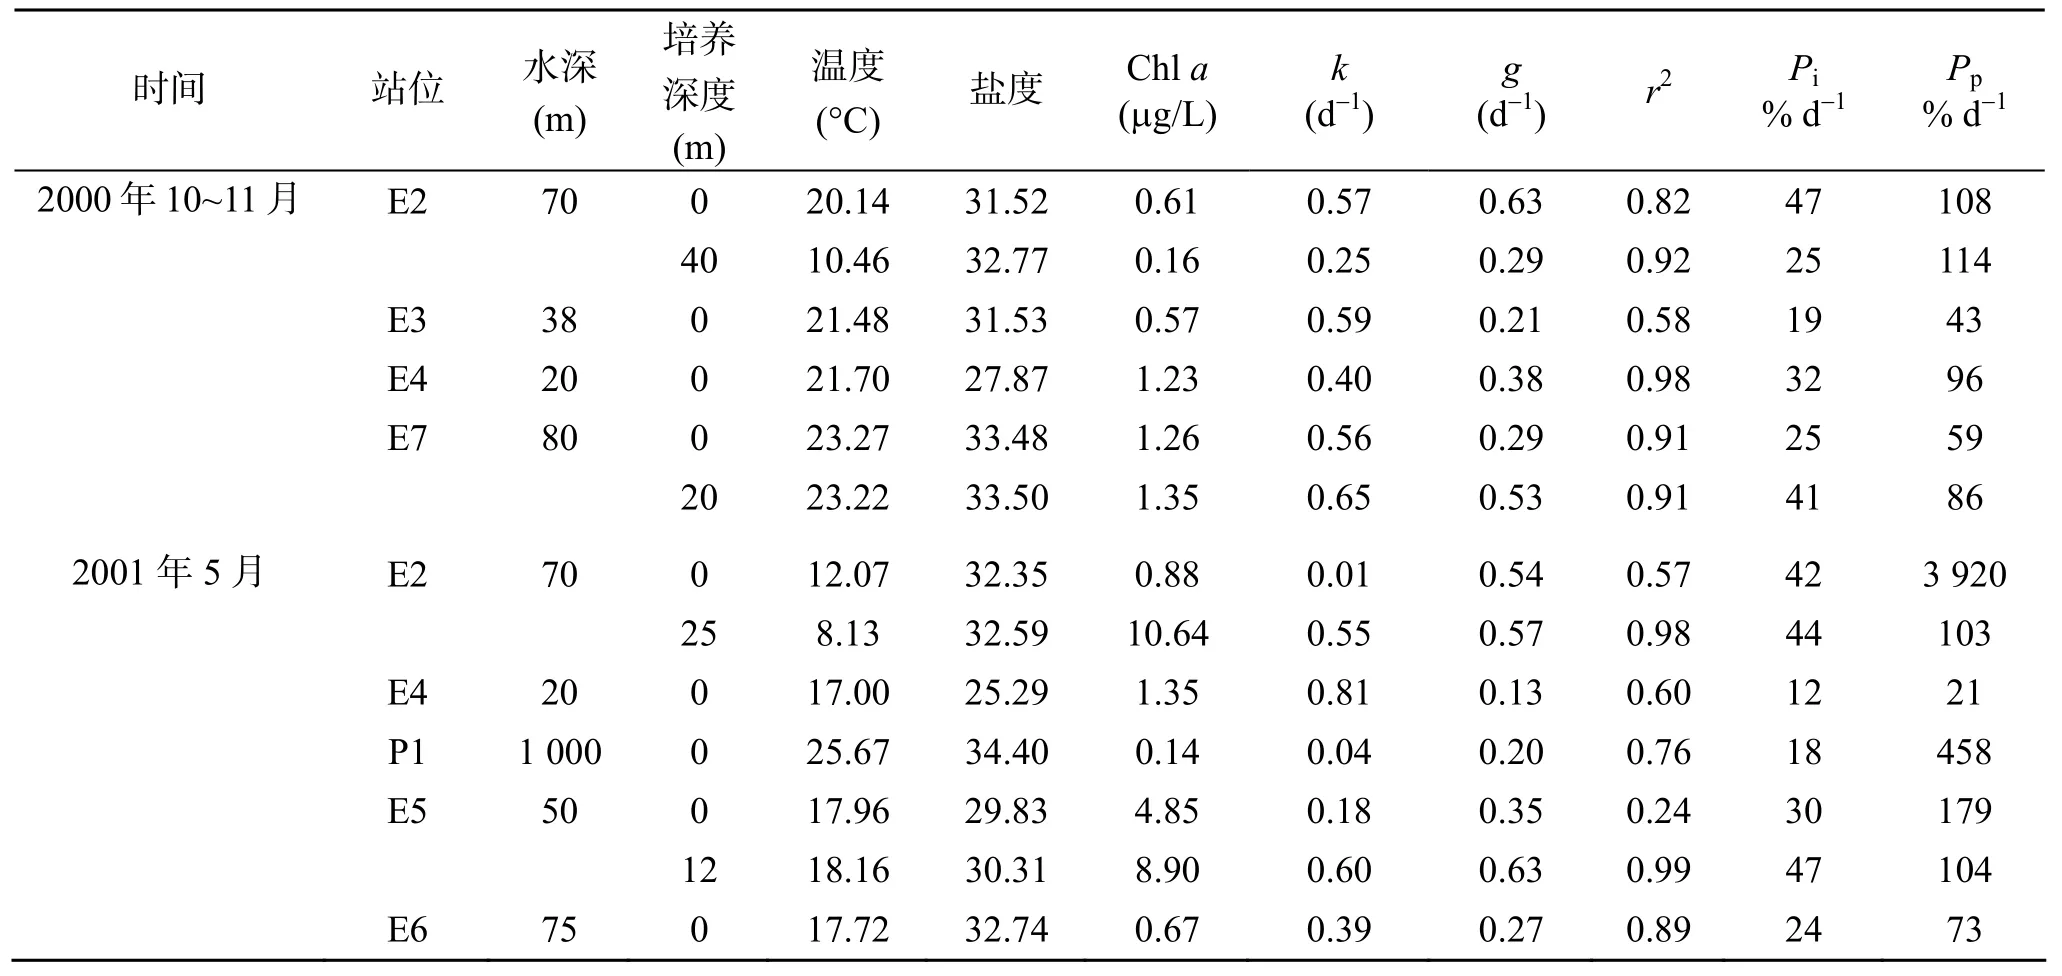
各培养站位和层次的温度、盐度和Chla浓度的情况见表 1。秋季各站表层温度为 20.14~23.27 °C, 盐度为 27.87~33.48, Chla浓度为 0.57~1.26 μg/L。温度和盐度的垂直分布有明显的跃层(图 2), 底层温度比表层低。E2站的深层培养水样采自水深40 m处, 处于温跃层以下(图2), 温度为10.46 °C, Chla浓度低于表层(表1)。E7站的深层培养水样采自水深20 m,处于温跃层以上(图2), Chla浓度高于表层(表1)。
春季各站表层温度为 12.07~25.67 °C, 盐度为25.29~34.40, Chla浓度 0.14~4.85 μg/L。P1 站和 E6站位置接近, 但是, P1站的表层温度比E6站的表层温度和盐度都升高很多, Chla浓度也最低(0.14 μg/L)。在近岸(E5)底层比表层温度高, 但表底相差不大, 在远岸(E2)底层温度比表层低(图2)。E2站的深层(25 m)培养水样采自温跃层以下, E5站的深层培养水样采自水深12 m, 处于温跃层以上(图2)。但是,两站深层培养水样的Chla浓度都比表层高(表1)。
表层稀释培养的结果(表 1)表明, 秋季表层浮游植物Chla浓度的内禀生长率为0.40~0.59 d−1, 微型浮游动物对Chla浓度的摄食率为0.21~0.63 d−1, 对Chla现存量的摄食压力为19%~47% d−1, 对Chla生产力的摄食压力为59%~108% d−1。春季表层Chla的内禀生长率为0.01~0.81 d−1, 微型浮游动物对Chla的摄食率为0.13~0.54 d−1, 对Chla现存量的摄食压力为12%~42% d−1, 对Chla生产力的摄食压力为21%~3920% d−1。
深层海水稀释培养的结果(表 1)表明, 秋季深层Chla浓度的内禀生长率为0.25~0.65 d−1, 微型浮游动物对Chla的摄食率为0.29~0.53 d−1, 对Chla现存量的摄食压力为25%~41% d−1, 对Chla生产力的摄食压力为86%~114% d−1。春季深层Chla的内禀生长率为0.55~0.60 d−1, 微型浮游动物对Chla的摄食率为0.57~0.63 d−1, 对Chla现存量的摄食压力为44%~47% d−1, 对Chla生产力的摄食压力为103%~104% d−1。

表1 各站位稀释培养水层的温度、盐度和Chla浓度和培养结果Tab. 1 Initial incubation conditions (T: temperature,S: Salinity) and results ofk(potential growth rate of Chla),g(microzooplankton grazing rate on Chla),Pi(microzooplankton grazing pressure on Chlastanding stock), andPp(microzooplankton grazing pressure on Chlaprimary production)
3 讨论
自然海水稀释培养的方法是估计微型浮游动物摄食压力的常用方法, Calbet and Landry[3]总结了用稀释法研究的浮游植物初级生产力被微型浮游动物摄食的比例平均为60%~75%。本文中有7个培养的结果中, 微型浮游动物对浮游植物生产力的摄食压力高于100%, 即浮游植物的现存量减少, 微型浮游动物对浮游植物现存量的摄食压力不会高于100%(表1), 所以这样的数据是正常的。因为稀释培养测定的是一天内的瞬时值, 所以这样的结果不会长时间持续。
与表层的结果相比, 深层稀释培养的结果有如下的特点: (1)深层稀释培养结果的相关性好, 回归系数(r2)较高(0.91~0.99, 表1), 表层的r2值较为分散(0.24~0.98), 这说明深层培养比较符合稀释法要求的条件[7]; (2)深层的浮游植物生产力被摄食的比例都比较接近 100% (86%~114%), 说明浮游植物的生产基本被微型浮游动物摄食掉了。
[1] Dussart B M. Les differentes categories de plancton. [J]Hydrobiologia, 1965, 26: 72-74.
[2] Gifford, D J, Dagg, M J. The microzooplankton-mesozooplanktom link: consumption of the planktonic protozoa by the calanoidAcartiatonsaDana andNeocalanus plumchrusMurukawa. [J]. Marine Microbial Food Webs, 1991, 5: 161-177.
[3] Calbet A, Landry M R. Phytoplankton growth, microzooplankton grazing, and carbon cycling in marine systems [J]. Limnology and Oceanography, 2004, 49(1):51-57.
[4] Zhang W, Xu K, Wan R, et al. Spatial distribution of ciliates, copepod nauplii and eggs,Engraulis japonicuspost-larvae and microzooplankton herbivorous activity in the Yellow Sea, China[J]. Aquatic Microbial Ecology,2002, 27(3): 249-259.
[5] Zhang W, Li H, Xiao T, et al. Impact of microzooplankton and copepods on the growth of phytoplankton in the Yellow Sea and East China Sea[J].Hydrobiologia, 2006, 553: 357-366.
[6] 孙军, 刘东艳, 王宗灵, 等. 春季赤潮频发期东海微型浮游动物摄食研究. [J] 应用生态学报, 2003, 14 (7):1 073-1 080.
[7] Landry M R, Hassett R P. Estimating the grazing impact of marine microzooplankton[J]. Marine Biology,1982, 67: 283-288.
[8] UNESCO. Protocols for the Joint Global Ocean Flux Study (JGOFS) core measurements[R]. 1994.
[9] Strickland J D, Parsons T R. A practical handbook of seawater analysis[M]. 2nded. Bulletin Fisheries Research Board of Canada, 1972: 1-167.
[10] Verity P G, Stoecker D K, Sieracki M E, et al. Grazing,growth and mortality of microzoooplankton during the 1989 North Atlantic spring bloom at 47°N, 18°W[J].Deep-Sea Research I, 1993, 40: 1793-1814.
Received: Oct., 21, 2009
Key words:microzooplankton; grazing; Yellow Sea; East China Sea
Abstract:Microzooplankton grazing on phytoplankton was estimated using dilution incubation method in Autumn(21 October-7 November) 2000 and Spring (30 April-15 May) 2001 in Yellow Sea and East China Sea. (1) In Autumn. In the surface waters, the potential growth rate of Chlorophylla(Chla) was in a range of 0.40~0.59 d−1. Microzooplankton grazing rates on Chlawere 0.21~0.63 d−1. As a result, microzooplankton grazing pressure on Chlastanding stock and primary production were in the range of 19%~47% d−1and 59%~108% d−1, respectively. In deep waters, the potential growth rates of Chlawere in a range of 0.25~0.65 d−1. Microzooplankton grazing rates on Chlawere 0.29~0.53 d−1. As a result, microzooplankton grazing pressure on Chlastanding stock and primary production were in the range of 25%~41% d−1and 86%~114% d−1, respectively. (2) In spring. In the surface waters, the potential growth rates of Chlawere in a range of 0.01~0.81 d−1. Microzooplankton grazing rates on Chlawere 0.13~0.54 d−1. As a result, microzooplankton grazing pressure on Chlastanding stock and primary production were in the range of 12%~42% d−1and 21%~3 920% d−1, respectively. In deep waters, the potential growth rates of Chlawere in a range of 0.55~0.60 d−1. Microzooplankton grazing rates on Chlawere 0.57~0.63 d−1. As a result, microzooplankton grazing pressure on Chlastanding stock and primary production were in the range of 44%~47% d−1and 103%~104% d−1, respectively.
(本文编辑:张培新)
Grazing pressure of microzooplankton on phytoplankton in spring and autumn in the Yellow Sea and East China Sea
ZHANG Wu-chang1, ZHANG Cui-xia1,2, WANG Rong1, XIAO Tian1
(1. Key Laboratory of Marine Ecology and Environmental Sciences, Institute of Oceanology, Chinese Academy of Sciences, Qingdao 266071, China; 2. Graduate University of Chinese Academy of Sciences, Beijing 100049, China)
Q958.885.3
A
1000-3096(2011)01-0036-04
2009-10-21;
2010-03-10
国家自然科学基金(40876085); 国家973计划项目(2011CB409804);国家自然科学基金(40821004); 中国科学院创新项目(KZCX2-YW-213-3)
张武昌(1973-), 男, 博士, 研究方向: 海洋生态学, E-mail:wuchangzhang@qdio.ac.cn
